
Nyheter
Understanding ETF Premiums and Discounts

One of the benefits of Exchange Traded Funds is the fact that the price of ETF units generally reflect the market value of its holdings. Understanding ETF Premiums and Discounts.
Market Price vs. NAV
Since ETFs trade on a stock exchange, they have two end-of-day “values”. The first is a closing market price, which is determined by trading activity on the exchange. Typically, this is the price at which the units last traded during the trading session (or the mid-point of the bid and ask quotes if the ETF does not trade during that trading session). The second value is Net Asset Value (NAV), which is calculated by the ETF’s independent fund accountant after the market closes. NAV is the weighted-average price of the ETF’s underlying securities, minus liabilities such as management fees and expenses, then divided by units outstanding. Understanding ETF Premiums and Discounts.
What is a Premium or Discount?
A premium or discount to NAV occurs when the market price of an ETF on the exchange rises above or falls below its NAV. If the market price is higher than NAV, the ETF is said to be trading at a “premium”. If the price is lower, it is trading at a “discount”. An ETF may trade at a premium or discount when, for example;
· its underlying assets trade at different hours than the stock exchange (e.g., commodities)
· its underlying assets trade infrequently (e.g., bonds)
· markets are in a heightened state of instability or flux (e.g., at market open or close)
Many ETFs track well-known indices for which performance data is independently reported by the stock exchange and financial news and data providers such as Thomson Reuters or Bloomberg. The daily closing price they quote is usually the price at which units last traded during the trading session. For ETFs that don’t trade frequently throughout the day, the quoted “last price traded” may not correspond to the daily change in the value of the ETF’s underlying index or basket of securities. This might lead an investor to mistakenly conclude that an ETF is trading at a premium or discount to its NAV.
Market Makers and their Role The majority of Canadian-listed ETFs generally trade with a tight bid/ask spread on either side of NAV, regardless of how often they trade. A tight bid/ask spread is facilitated by the presence of a “market maker”, a designated broker-dealer firm that tracks an ETF’s NAV throughout the trading day. The market maker is obligated to ensure liquidity and to attempt to maintain a tight bid/ask spread close to NAV. It does this by buying or selling ETF units from its own inventory when there are too few buyers or sellers in the market. This allows investors to get their orders filled as near to NAV as possible, when they choose to execute them, regardless of trading volume.
How a Premium or Discount can Occur
Understanding ETF Premiums and Discounts. There are three main reasons why the closing market price of an ETF may deviate from its NAV on any given day:
1. The last trade of the day usually occurs at the bid or ask price posted by the market maker, which reflects a spread on either side of NAV
2. The last daily trade of the ETF on the exchange may occur earlier in the trading day rather than at the market close*
3. The ETF’s underlying assets may trade infrequently or at different hours than the stock exchange (e.g., commodities or bonds)
*The greater the time between the last trade and the close of the market, the greater the spread can be.
The chart below illustrates a hypothetical ETF trading at a discount to NAV on Day 1, and how this results in a higher price change on Day 2:

For Illustration Purposes Only Premiums and discounts usually converge towards the NAV on the following trading day.
Horizons ETFs is a member of Mirae Asset Global Investments. Commissions, trailing commissions, management fees and expenses all may be associated with an investment in exchange traded products managed by AlphaPro Management Inc. and Horizons ETFs Management (Canada) Inc. (the “Horizons Exchange Traded Products”). The Horizons Exchange Traded Products are not guaranteed, their values change frequently and past performance may not be repeated. The prospectus contains important detailed information about the Horizons Exchange Traded Products. Please read the prospectus before investing.


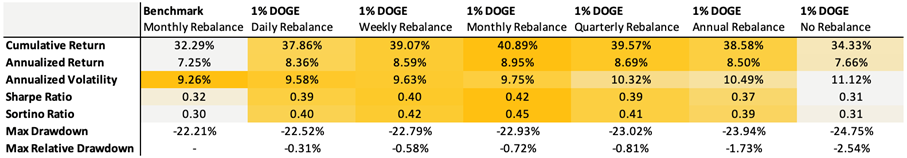
Dogecoin has outperformed other major cryptoassets over the past decade, while also exhibiting a low correlation to crypto and traditional assets. This creates a compelling argument for a portfolio allocation. We tested a Bitcoin-enhanced growth portfolio, which is a traditional 60/40 infused with 3% Bitcoin, and we introduced a modest 1% DOGE allocation. Since most prospective investors likely already hold Bitcoin, this offers a lens into how the two assets can complement each other.
Despite the small portfolio allocation, every approach delivered stronger returns. The benchmark returned 7.25% annually, while DOGE-enhanced portfolios reached as high as 8.95%. Sharpe ratios improved in almost all tests, indicating better risk-adjusted returns. Volatility did slightly tick up, but drawdowns remained largely contained. Even with no rebalancing, the max drawdown only deepened by a few percentage points, underscoring that even a 1% DOGE allocation adds meaningful punch without destabilizing the broader portfolio.
Rebalancing remains essential to capturing upside effectively. Without it, returns can plateau while risk quietly compounds. Monthly or weekly rebalancing offered the best balance, maximizing returns while keeping volatility and drawdowns in check, especially during periods of broader market stress, as we’ve recently seen. Given Dogecoin’s momentum-driven nature, a more strategic approach linked to broader crypto market cycles may offer even greater optimization beyond routine rebalancing.
With the right structure, a 1% allocation to Dogecoin isn’t reckless—it’s rewarding.
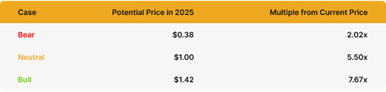
Bear Case
Despite strong fundamentals and a rich cultural legacy, Dogecoin’s recent rally, fueled by post-election memecoin mania, may have front-run its true cycle potential. As attention shifts to newer narratives, DOGE risks being seen as ’yesterday’s play,’ potentially underperforming even in a rising market. Still, that wouldn’t signal a flaw in its model, just a pause in a fast-rotating cycle.
Assuming a continued 10% compounded annual growth rate (CAGR) from its 2021 peak of $0.73, DOGE would be projected to land around $0.38 by 2025—still more than 2x from today’s levels but modest relative to past cycles. More notably, this would mark the first time Dogecoin fails to reach a new all-time high in a full market cycle.
Neutral Case
Dogecoin may not dominate headlines like it did at its peak, but it still holds cultural relevance and widespread recognition. In a scenario where the total crypto market cap peaks at $5 trillion this cycle and DOGE maintains a solid, albeit slightly reduced, market share of 3% instead of its previous 4%, this would result in a market capitalization of approximately $150 billion for DOGE.
At that valuation, DOGE would trade near $1 per coin, a ~5.5x gain from current levels around $0.185. This neutral case assumes Dogecoin retains its stature as the leading memecoin, despite increased competition, with stable adoption and renewed retail interest, but without the same euphoria of the last cycle.
Bull Case
If we take DOGE’s bottom price of $0.007 just before the last bull run began and fast-forward two years to the bottom of the current cycle at $0.0585, that move reflects a CAGR of 189%. If DOGE were to mirror this explosive growth, DOGE would reach approximately $1.42.
In this scenario, Dogecoin benefits from renewed memecoin mania, increasing real-world adoption, and stronger interest fueled by regulatory clarity and potential integration with major platforms like Elon Musk’s X. A full return of retail enthusiasm and broad cultural momentum could reestablish DOGE as the breakout asset of the cycle, potentially even doubling its all-time high.
Research Newsletter
Each week the 21Shares Research team will publish our data-driven insights into the crypto asset world through this newsletter. Please direct any comments, questions, and words of feedback to research@21shares.com
Disclaimer
The information provided does not constitute a prospectus or other offering material and does not contain or constitute an offer to sell or a solicitation of any offer to buy securities in any jurisdiction. Some of the information published herein may contain forward-looking statements. Readers are cautioned that any such forward-looking statements are not guarantees of future performance and involve risks and uncertainties and that actual results may differ materially from those in the forward-looking statements as a result of various factors. The information contained herein may not be considered as economic, legal, tax or other advice and users are cautioned to base investment decisions or other decisions solely on the content hereof.


SPFT ETF är en global satsning på teknikföretag

Dogecoin in a portfolio: A small 1% allocation has a loud bark!

VBTC ETN spårar priset på kryptovalutan Bitcoin

iShares och Franklin Templeton listar nya ETFer på Xetra

BE28 ETF företagsobligationer med förfall 2028 och inget annat

Fonder som ger exponering mot försvarsindustrin
Crypto Market Risks & Opportunities: Insights on Bybit Hack, Bitcoin, and Institutional Adoption

Warren Buffetts råd om vad man ska göra när börsen kraschar

Montrose storsatsning på ETFer fortsätter – lanserar Sveriges första globala ETF med hävstång

Svenskarna har en ny favorit-ETF
-
 Nyheter4 veckor sedan
Fonder som ger exponering mot försvarsindustrin
-

 Nyheter3 veckor sedan
Crypto Market Risks & Opportunities: Insights on Bybit Hack, Bitcoin, and Institutional Adoption
-
 Nyheter3 veckor sedan
Warren Buffetts råd om vad man ska göra när börsen kraschar
-
 Nyheter2 veckor sedan
Montrose storsatsning på ETFer fortsätter – lanserar Sveriges första globala ETF med hävstång
-
 Nyheter3 veckor sedan
Svenskarna har en ny favorit-ETF
-

 Nyheter4 veckor sedan
HANetf lanserar Europa-fokuserad försvars-ETF
-

 Nyheter2 veckor sedan
MONTLEV, Sveriges första globala ETF med hävstång
-

 Nyheter3 veckor sedan
Fastställd utdelning i MONTDIV mars 2025