
Nyheter
The good, bad and ugly of Chinese markets
ETF Securities Equity Research – The good, bad and ugly of Chinese markets
Summary
- China’s macroeconomic indicators are signalling a positive inflection point, however the debt overhang highlights a looming risk.
- China needs to maintain the balancing act between its new consumption led economy and slowing investment driven economy to stem the pace of credit expansion.
- Chinese stock market valuations are disguised by low earnings multiples of the state owned financial sector.
- Greater transparency and clarity of communication about policy is the only way to draw international investors back to the Chinese Equity markets.
Green shoots emerging

Following a challenging start to 2016, official macroeconomic data released by China, ranging from GDP, fixed asset investment, industrial production and retail sales (led by auto and internet sales) are now suggesting that the economy may in fact be at an inflection point. A concerted government effort to restore growth in the real estate sector via cuts in mortgage rates, down payments and a surge in lending has driven a rebound in housing sales. Rising ‘floor space started’ has also provided evidence that growth in construction is catching up. Overall business activity in China expanded for a second straight month in April albeit at a slower pace than March. The rate of new orders growth was the strongest seen in three months.
(click to enlarge)
Clearly a domestic consumption driven economy is trying to fill the gap left behind by manufacturing activity. While an uptick in the majority of the macro indicators are signs of green shoots emerging, China’s persistent and rising debt load poses a serious threat to the economy.
237% and counting

Debt has been financing the extraordinary growth rates that China has sustained so far. China’s credit growth has surged to 237% of GDP today from 164% in 2008, far above emerging market counterparts and is still growing. While there are countries with higher debt levels, the reason for concern in China’s case is the recent pace of credit growth, coupled with the declining quality. The dilemma facing the Chinese government is whether the new consumption led economy can support growth if credit is cut off from the private sector. In 2016, China faces a record 3.7tn yuan (US$567bn) of local bond maturities through year-end and this comes amidst deteriorating investor sentiment following news of seven companies reneging on their obligations so far this year. Non-performing loans (NPLs) have reached a record 1.3tn Yuan and account for 1.7% of total loans, and anecdotal evidence suggests this number is higher than disclosed. While most countries have seen their NPL loan growth decline recently, China remains an exception as highlighted in the chart below.
(Click to enlarge)
Back in 1999, specially created asset management companies relieved the big four state banks by buying these NPLs with government backed 10-year bonds. China’s rapid pace of expansion in the 10 years since 1999 helped shrink the debt levels from 20% to nearly 5% of GDP. However, since the maturity of those bonds came in the midst of the financial crisis in 2009, it seemed prudent at the time to roll over their maturities (to 2019) rather than recognize the losses. The Chinese authorities have recently announced their intention to deal with these non-performing loans in the banking sector with an Equity-for-Debt Swap (EDS) and securitisations of NPLs. The EDS will enable banks to swap bad loans on their books for equity stakes in the stressed corporates. While this will certainly allow banks to reduce the need to provision for loan losses aiding better use of their capital, it is hard to assess the time it will take for the stressed corporates to recover. We believe these are not comprehensive solutions by themselves and simply delay the inevitable to a later date.
Margin trading magnified market volatility
Stratospheric margin lending up 3057% since September 2012 – fuelled the MSCI China A shares index to attain a record high 5458.9pts in June 2015.

The balance of margin financing outstanding as a percentage of market capitalisation in June 2015 reached a record 4.09%.

These high levels of leverage explain the fast run up to the peak and its subsequent decline thereafter. Rising stock prices made it easy to repay margin interest rates however when these stocks reversed their trend, investor losses exceeded their margin payments forcing them to liquidate their equity holdings and exacerbate the downward slide. In an effort to contain these risks, the securities regulator capped the size of margin trading and short selling for the first time at 4x a brokerage’s net capital. Since the start of 2016 the outstanding balance of margin transactions has declined by 35% and has had a direct repercussion on the market.
Market meddling leads to lacklustre trading
Chinese stock markets got off to a turbulent start in 2016 that forced it to suspend trading activity twice in a matter of a week after 7% declines tripped a new circuit breaker mechanism. While the initial intention was to avoid panic selling, it appeared counterproductive forcing the mechanism to be withdrawn just days after being introduced. The lack of transparency from the stock market regulator caused more harm than good resulting in a loss of investor confidence.
Equity valuations not so cheap
The MSCI China A Shares Index currently trades at 18x earnings – seemingly attractive on the surface. The reality is that financial stocks, which account for 35% of the index, tend to deflate the index valuations due to their low valuations, at 4x earnings. By stripping out the financial sector and applying the valuation gap (difference in P/E’s of MSCI China A shares index excluding financials and the MSCI China Financial Index) we obtain a more realistic valuation of 28x earnings for the MSCI China A shares index.
Conclusion
While there is rising evidence that a majority of macroeconomic indicators are benefiting from China’s accommodative monetary policy, we believe it will eventually have to contend with its rising debt load. Credit expansion has expanded at an alarming rate, this coupled with the declining quality of debt makes it imperative for China to transition from an investment to a consumption driven economy. The lack of clarity and transparency by Chinese stock market regulators has subdued investor sentiment. From a timing perspective, Chinese stock markets are not as cheap as they appear since their valuations are flattered by financial stocks. For the time being we remain cautious on Chinese equities until the emerging green shoots become more established.
Important Information
General
This communication has been issued and approved for the purpose of section 21 of the Financial Services and Markets Act 2000 by ETF Securities (UK) Limited (“ETFS UK”) which is authorised and regulated by the United Kingdom Financial Conduct Authority (the “FCA”).
The information contained in this communication is for your general information only and is neither an offer for sale nor a solicitation of an offer to buy securities. This communication should not be used as the basis for any investment decision. Historical performance is not an indication of future performance and any investments may go down in value.


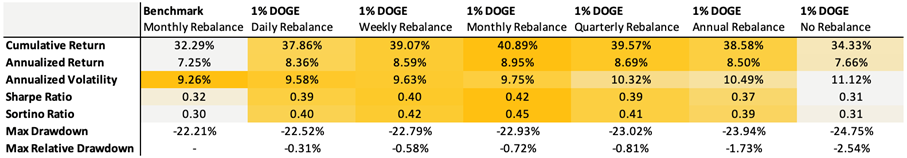
Dogecoin has outperformed other major cryptoassets over the past decade, while also exhibiting a low correlation to crypto and traditional assets. This creates a compelling argument for a portfolio allocation. We tested a Bitcoin-enhanced growth portfolio, which is a traditional 60/40 infused with 3% Bitcoin, and we introduced a modest 1% DOGE allocation. Since most prospective investors likely already hold Bitcoin, this offers a lens into how the two assets can complement each other.
Despite the small portfolio allocation, every approach delivered stronger returns. The benchmark returned 7.25% annually, while DOGE-enhanced portfolios reached as high as 8.95%. Sharpe ratios improved in almost all tests, indicating better risk-adjusted returns. Volatility did slightly tick up, but drawdowns remained largely contained. Even with no rebalancing, the max drawdown only deepened by a few percentage points, underscoring that even a 1% DOGE allocation adds meaningful punch without destabilizing the broader portfolio.
Rebalancing remains essential to capturing upside effectively. Without it, returns can plateau while risk quietly compounds. Monthly or weekly rebalancing offered the best balance, maximizing returns while keeping volatility and drawdowns in check, especially during periods of broader market stress, as we’ve recently seen. Given Dogecoin’s momentum-driven nature, a more strategic approach linked to broader crypto market cycles may offer even greater optimization beyond routine rebalancing.
With the right structure, a 1% allocation to Dogecoin isn’t reckless—it’s rewarding.
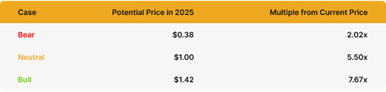
Bear Case
Despite strong fundamentals and a rich cultural legacy, Dogecoin’s recent rally, fueled by post-election memecoin mania, may have front-run its true cycle potential. As attention shifts to newer narratives, DOGE risks being seen as ’yesterday’s play,’ potentially underperforming even in a rising market. Still, that wouldn’t signal a flaw in its model, just a pause in a fast-rotating cycle.
Assuming a continued 10% compounded annual growth rate (CAGR) from its 2021 peak of $0.73, DOGE would be projected to land around $0.38 by 2025—still more than 2x from today’s levels but modest relative to past cycles. More notably, this would mark the first time Dogecoin fails to reach a new all-time high in a full market cycle.
Neutral Case
Dogecoin may not dominate headlines like it did at its peak, but it still holds cultural relevance and widespread recognition. In a scenario where the total crypto market cap peaks at $5 trillion this cycle and DOGE maintains a solid, albeit slightly reduced, market share of 3% instead of its previous 4%, this would result in a market capitalization of approximately $150 billion for DOGE.
At that valuation, DOGE would trade near $1 per coin, a ~5.5x gain from current levels around $0.185. This neutral case assumes Dogecoin retains its stature as the leading memecoin, despite increased competition, with stable adoption and renewed retail interest, but without the same euphoria of the last cycle.
Bull Case
If we take DOGE’s bottom price of $0.007 just before the last bull run began and fast-forward two years to the bottom of the current cycle at $0.0585, that move reflects a CAGR of 189%. If DOGE were to mirror this explosive growth, DOGE would reach approximately $1.42.
In this scenario, Dogecoin benefits from renewed memecoin mania, increasing real-world adoption, and stronger interest fueled by regulatory clarity and potential integration with major platforms like Elon Musk’s X. A full return of retail enthusiasm and broad cultural momentum could reestablish DOGE as the breakout asset of the cycle, potentially even doubling its all-time high.
Research Newsletter
Each week the 21Shares Research team will publish our data-driven insights into the crypto asset world through this newsletter. Please direct any comments, questions, and words of feedback to research@21shares.com
Disclaimer
The information provided does not constitute a prospectus or other offering material and does not contain or constitute an offer to sell or a solicitation of any offer to buy securities in any jurisdiction. Some of the information published herein may contain forward-looking statements. Readers are cautioned that any such forward-looking statements are not guarantees of future performance and involve risks and uncertainties and that actual results may differ materially from those in the forward-looking statements as a result of various factors. The information contained herein may not be considered as economic, legal, tax or other advice and users are cautioned to base investment decisions or other decisions solely on the content hereof.


SPFT ETF är en global satsning på teknikföretag

Dogecoin in a portfolio: A small 1% allocation has a loud bark!

VBTC ETN spårar priset på kryptovalutan Bitcoin

iShares och Franklin Templeton listar nya ETFer på Xetra

BE28 ETF företagsobligationer med förfall 2028 och inget annat

Fonder som ger exponering mot försvarsindustrin
Crypto Market Risks & Opportunities: Insights on Bybit Hack, Bitcoin, and Institutional Adoption

Montrose storsatsning på ETFer fortsätter – lanserar Sveriges första globala ETF med hävstång

Warren Buffetts råd om vad man ska göra när börsen kraschar

Svenskarna har en ny favorit-ETF
-
 Nyheter4 veckor sedan
Fonder som ger exponering mot försvarsindustrin
-

 Nyheter3 veckor sedan
Crypto Market Risks & Opportunities: Insights on Bybit Hack, Bitcoin, and Institutional Adoption
-
 Nyheter2 veckor sedan
Montrose storsatsning på ETFer fortsätter – lanserar Sveriges första globala ETF med hävstång
-
 Nyheter4 veckor sedan
Warren Buffetts råd om vad man ska göra när börsen kraschar
-
 Nyheter3 veckor sedan
Svenskarna har en ny favorit-ETF
-

 Nyheter4 veckor sedan
HANetf lanserar Europa-fokuserad försvars-ETF
-

 Nyheter2 veckor sedan
MONTLEV, Sveriges första globala ETF med hävstång
-

 Nyheter4 veckor sedan
Fastställd utdelning i MONTDIV mars 2025