
Nyheter
Successfully navigate through Bitcoin & Cryptoassets Markets
• Last week, cryptoassets posted their strongest weekly performance year-to-date on the back of a significant increase in risk appetite across all areas
• Our in-house “Cryptoasset Sentiment Indicator” has touched the highest reading since November 2021 indicating very bullish sentiment
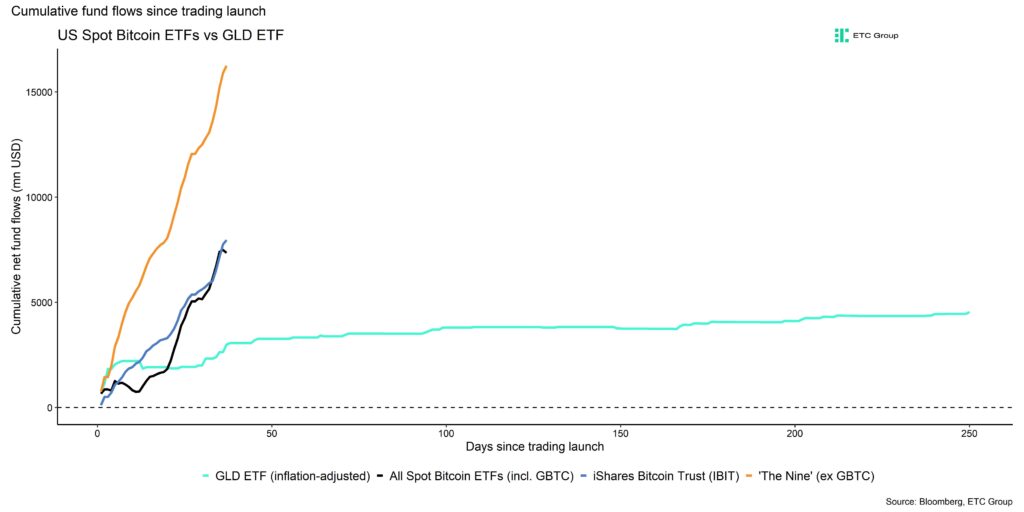
• US spot Bitcoin ETFs have kept a very high momentum of inflows over the past weeks, vastly surpassing historical inflows into the GLD ETF since trading launch in 2004
Chart of the Week
Performance
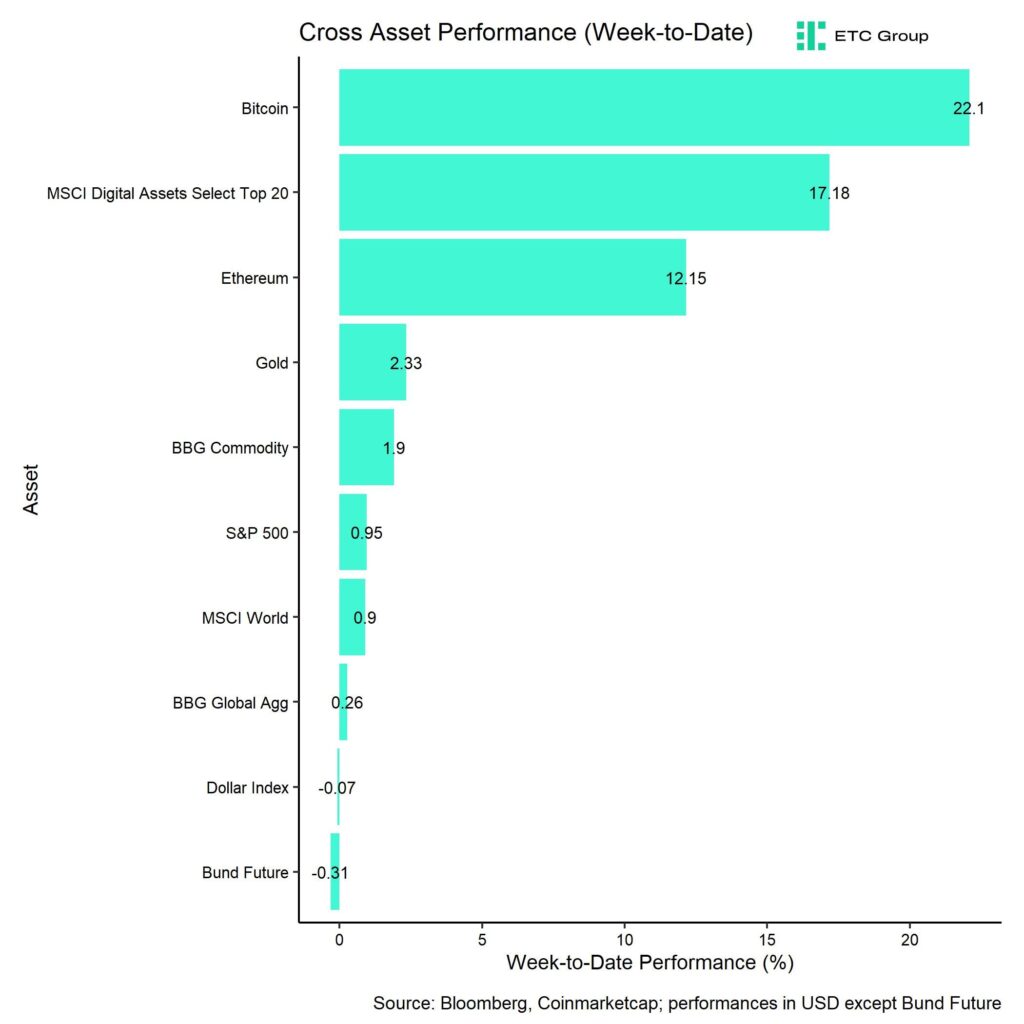
Last week, posted their strongest performance year-to-date on the back of a significant increase in risk appetite across all areas.
For instance, last week saw record daily inflows into US spot Bitcoin ETFs.
US spot Bitcoin ETFs have kept a very high momentum of inflows over the past weeks, vastly surpassing historical inflows into the GLD ETF since trading launch in 2004 (Chart-of-the-Week).
In fact, iShares Bitcoin Trust (IBIT) was the fastest ETF to ever get to 10 bn USD AuM within that short period of time.
Furthermore, significant BTC net exchange outflows from both Coinbase and Binance implied increased institutional buying interest as well. There were also rumours of a potential sovereign buyer of Bitcoin. Besides, the most recent price spikes were additionally fuelled by futures short liquidations that propelled Bitcoin above 60k USD.
That being said, many sentiment and positioning indicators already imply that sentiment is euphoric, and that positioning appears to be stretched. For instance, our in-house “Cryptoasset Sentiment Indicator” has touched the highest reading since November 2021. Moreover, technical price indicators for Bitcoin such as the Relative Strength Index (RSI) or the Fractal Dimension imply that a short-term price correction is imminent.
Based on these indicators, a short-term pull-back off the recent highs appears to be quite likely.
On-chain indicators imply that around 99% of Bitcoin supply is already in profit and short-term holders have recently sent the highest amount of coins in profit to exchanges since October 2021.
However, net inflows into US spot Bitcoin ETFs are bound to stay strong especially since recent GBTC sales from the Genesis liquidation are bound to level off and big banks like Bank of America or Wells Fargo have just recently declared to explicitly offer Bitcoin ETFs to their clients.
So, the market may stay overbought for a longer period of time.
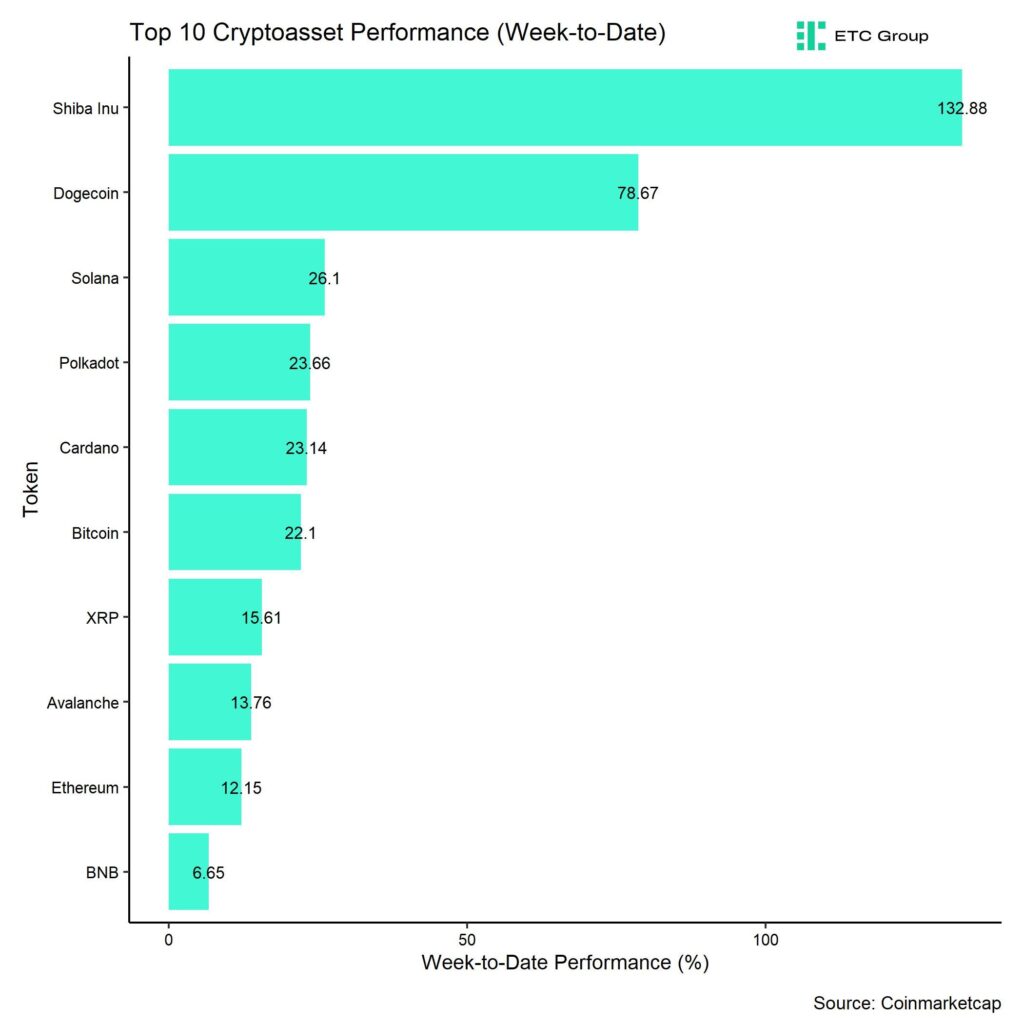
In general, among the top 10 crypto assets, Shiba Inu, Dogecoin, and Solana were the relative outperformers.
As mentioned above, overall altcoin outperformance vis-à-vis Bitcoin declined somewhat compared to the week prior, with 40% of our tracked altcoins managing to outperform Bitcoin on a weekly basis.
Sentiment
Our in-house “Cryptoasset Sentiment Index” has increased significantly and signals euphoric sentiment. In fact, the index increased to the highest level since November 2021 last week.
At the moment, 13 out of 15 indicators are above their short-term trend.
There were significant increases in crypto dispersion and the BTC perpetual funding rate across multiple exchanges.
The Crypto Fear & Greed Index still remains in ”Extreme Greed” territory as of this morning.
Meanwhile, our own measure of Cross Asset Risk Appetite (CARA) also increased throughout the week which signals improving sentiment in traditional financial markets as well.
As mentioned above, performance dispersion among cryptoassets has increased significantly to the highest reading ever recorded in our sample.
In general, high performance dispersion among cryptoassets implies that correlations among cryptoassets are low, which means that cryptoassets are trading more on coin-specific factors and that cryptoassets are increasingly decoupling from the performance of Bitcoin.
At the same time, altcoin outperformance vis-à-vis Bitcoin declined somewhat, with a clear underperformance of Ethereum vis-à-vis Bitcoin last week. Viewed more broadly, around 40% of our tracked altcoins have outperformed Bitcoin on a weekly basis.
In general, decreasing altcoin outperformance tends to be a sign of declining risk appetite within cryptoasset markets.
Fund Flows
Overall, we saw another week of record net fund inflows in the amount of +1873.4 mn USD (week ending Friday) based on Bloomberg data across all types of cryptoassets.
Global Bitcoin ETPs continued to see significant net inflows of +1745.2 mn USD of which +1722.9 mn (net) were related to US spot Bitcoin ETFs alone. The ETC Group Physical Bitcoin ETP (BTCE) saw net outflows equivalent to -48.7 mn USD last week.
The Grayscale Bitcoin Trust (GBTC) experienced a significant increase in net outflows of around -1456 mn USD last week. However, this was also more than offset by net inflows into other US spot Bitcoin ETFs which managed to attract +3179 bn USD (ex GBTC).
Note that some fund flows data for US major issuers are still lacking in the abovementioned numbers due to T+2 settlement.
Apart from Bitcoin, we saw comparatively small flows into other cryptoassets last week again.
Inflows into global Ethereum ETPs picked up significantly last week with around +124.8 mn USD. The ETC Group Physical Ethereum ETP (ZETH) also attracted +1.7 mn USD while the newly-launched ETC Group Ethereum Staking ETP (ET32) attracted +0.1 mn USD in inflows.
Besides, Altcoin ETPs ex Ethereum that managed to attract +5.7 mn USD last week.
In contrast, Thematic & basket crypto ETPs experienced net outflows of -2.2 mn USD, based on our calculations. The ETC Group MSCI Digital Assets Select 20 ETP (DA20) saw neither in- nor outflows last week. (+/- 0.0 mn USD).
Besides, the beta of global crypto hedge funds to Bitcoin over the last 20 trading has also increased significantly to around 1.2 which implies that global crypto hedge funds have significantly increased their Bitcoin market risks.
On-Chain Data
The most recent price increase was very well supported by positive on-chain developments as well. For instance, we saw the significant net exchange outflows from major exchanges that led to a strong decline in BTC exchange balances to a fresh 6-year low. Especially Friday saw very significant exchange outflows.
One of the highest exchange outflows in 2024 also happened last Friday during the Asian session.
In total, little more than 2.3 bn USD worth of Bitcoin was taken off exchanges on Friday. the largest withdrawal in more than five years. Looking more specifically into the numbers, it was more like a 2 bn USD outflow since about 200 mn USD of this went to Coinbase Prime.
Over the previous several days, Binance exchange has also seen significant outflows totalling over 400 mn USD. Coinbase saw the remaining outflows. The interesting outflows are from Binance since they are unrelated to the ETF and could be related to the sovereign buyer rumour mentioned above.
Increasing supply pressure was also intensifying because of decreasing BTC inventories at OTC desks. There were also some rumours that OTC desks were running out of bitcoins last week but which could definitely be seen in the data as well.
Despite all the bullish developments, we also saw increasing profit-taking by short-holders as well. On-chain indicators imply that around 99% of Bitcoin supply is already in profit and short-term holders have recently sent the highest amount of coins in profit to exchanges since October 2021.
This is also visible in the Short-Term Holder Spent Output Profit Ratio (STH SOPR) which spiked significantly last week (see appendix).
This increases the risk of a short-term pull back.
Futures, Options & Perpetuals
The last leg up was mostly fuelled by short futures liquidations that also led to a general decline in open interest both for BTC futures and perpetual contracts last week.
More specifically, we saw the highest number of futures short liquidations of around 149.6 mn USD on Wednesday last week according to data provided by Glassnode.
Besides, the 3-months annualized BTC futures basis also increased significantly to around 19.2% p.a. which is the highest reading since the pre-ETF approval highs.
BTC perpetual funding rates also increased to the highest level since October 2021 indicating very bullish sentiment on in BTC perpetual futures.
BTC options’ open interest also increased last week by around +50k BTC as traders increasingly bought puts to protect for downside risks. The Put-call open interest increased significantly throughout the week and reached 0.64 last Thursday.
The 25-delta BTC option skew for shorter expiries also decreased last week which is somewhat inconsistent with the increase in put-call open interest ratios.
In contrast, BTC option implied volatilities continued to drift higher throughout the week and reached the highest level year-to-date with around 71.6% p.a. for 1-month ATM options.
Bottom Line
• Last week, cryptoassets posted their strongest weekly performance year-to-date on the back of a significant increase in risk appetite across all areas
• Our in-house “Cryptoasset Sentiment Indicator” has touched the highest reading since November 2021 indicating very bullish sentiment
• US spot Bitcoin ETFs have kept a very high momentum of inflows over the past weeks, vastly surpassing historical inflows into the GLD ETF since trading launch in 2004
To read our Crypto Market Compass in full, please click the buton below:

Disclaimer
Important Information
The information provided in this material is for informative purposes only and does not constitute investment advice, a recommendation or solicitation to conclude a transaction. This document (which may be in the form of a blogpost, research article, marketing brochure, press release, social media post, blog post, broadcast communication or similar instrument – we refer to this category of communications generally as a “document” for purposes of this disclaimer) is issued by ETC Issuance GmbH (the “issuer”), a limited company incorporated under the laws of Germany, having its corporate domicile in Germany. This document has been prepared in accordance with applicable laws and regulations (including those relating to financial promotions). If you are considering investing in any securities issued by ETC Group, including any securities described in this document, you should check with your broker or bank that securities issued by ETC Group are available in your jurisdiction and suitable for your investment profile.
Exchange-traded commodities/cryptocurrencies, or ETPs, are a highly volatile asset and performance is unpredictable. Past performance is not a reliable indicator of future performance. The market price of ETPs will vary and they do not offer a fixed income. The value of any investment in ETPs may be affected by exchange rate and underlying price movements. This document may contain forward-looking statements including statements regarding ETC Group’s belief or current expectations with regards to the performance of certain asset classes. Forward-looking statements are subject to certain risks, uncertainties and assumptions, and there can be no assurance that such statements will be accurate and actual results could differ materially. Therefore, you must not place undue reliance on forward-looking statements. This document does not constitute investment advice nor an offer for sale nor a solicitation of an offer to buy any product or make any investment. An investment in an ETC that is linked to cryptocurrency, such as those offered by ETC Group, is dependent on the performance of the underlying cryptocurrency, less costs, but it is not expected to match that performance precisely. ETPs involve numerous risks including, among others, general market risks relating to underlying adverse price movements and currency, liquidity, operational, legal, and regulatory risks.


6PSE ETF ger exponering mot amerikanska aktier

iShares noterar fond för flyg- och försvarssektorn på Xetra

8RMY ETF köper bara aktier i europeiska försvarsföretag

Are Gold Mining Equities Regaining Attention Amid Rising Gold Prices?

Fem spanska fonder som har ökat med +12% under 2025
Crypto Market Risks & Opportunities: Insights on Bybit Hack, Bitcoin, and Institutional Adoption

Montrose storsatsning på ETFer fortsätter – lanserar Sveriges första globala ETF med hävstång

Svenskarna har en ny favorit-ETF

MONTLEV, Sveriges första globala ETF med hävstång

Sju börshandlade fonder som investerar i försvarssektorn
-

 Nyheter4 veckor sedan
Crypto Market Risks & Opportunities: Insights on Bybit Hack, Bitcoin, and Institutional Adoption
-
 Nyheter3 veckor sedan
Montrose storsatsning på ETFer fortsätter – lanserar Sveriges första globala ETF med hävstång
-
 Nyheter4 veckor sedan
Svenskarna har en ny favorit-ETF
-
 Nyheter3 veckor sedan
MONTLEV, Sveriges första globala ETF med hävstång
-
 Nyheter3 veckor sedan
Sju börshandlade fonder som investerar i försvarssektorn
-

 Nyheter3 veckor sedan
Världens första europeiska försvars-ETF från ett europeiskt ETF-företag lanseras på Xetra och Euronext Paris
-

 Nyheter3 veckor sedan
Europeisk försvarsutgiftsboom: Viktiga investeringsmöjligheter mitt i globala förändringar
-

 Nyheter2 veckor sedan
21Shares bildar exklusivt partnerskap med House of Doge för att lansera Dogecoin ETP i Europa