
Nyheter
Successfully navigate through Bitcoin & Cryptoassets Markets
• Cryptoassets rebound from losses sparked by geopolitical tensions amid Bitcoin Halving
• Our in-house “Cryptoasset Sentiment Indicator” has also rebounded from year-to-date lows
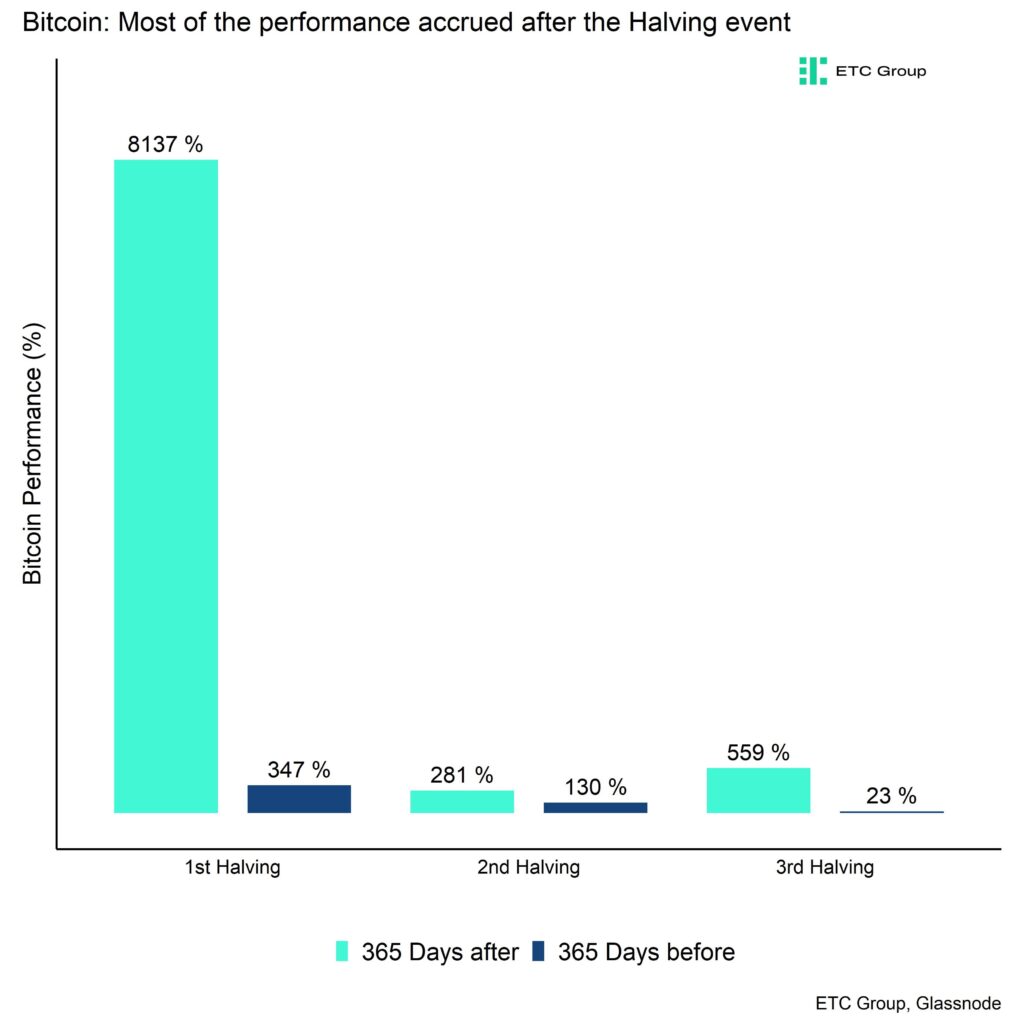
• Bitcoin Halving: In the past, most of the positive performance accrued after the Halving event
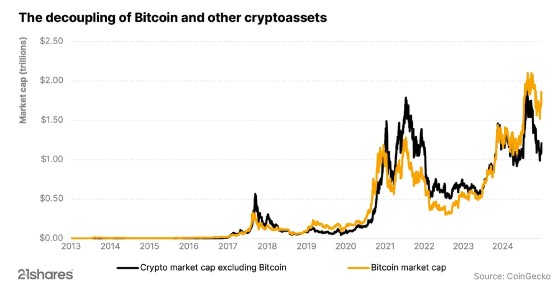
Chart of the Week
Performance
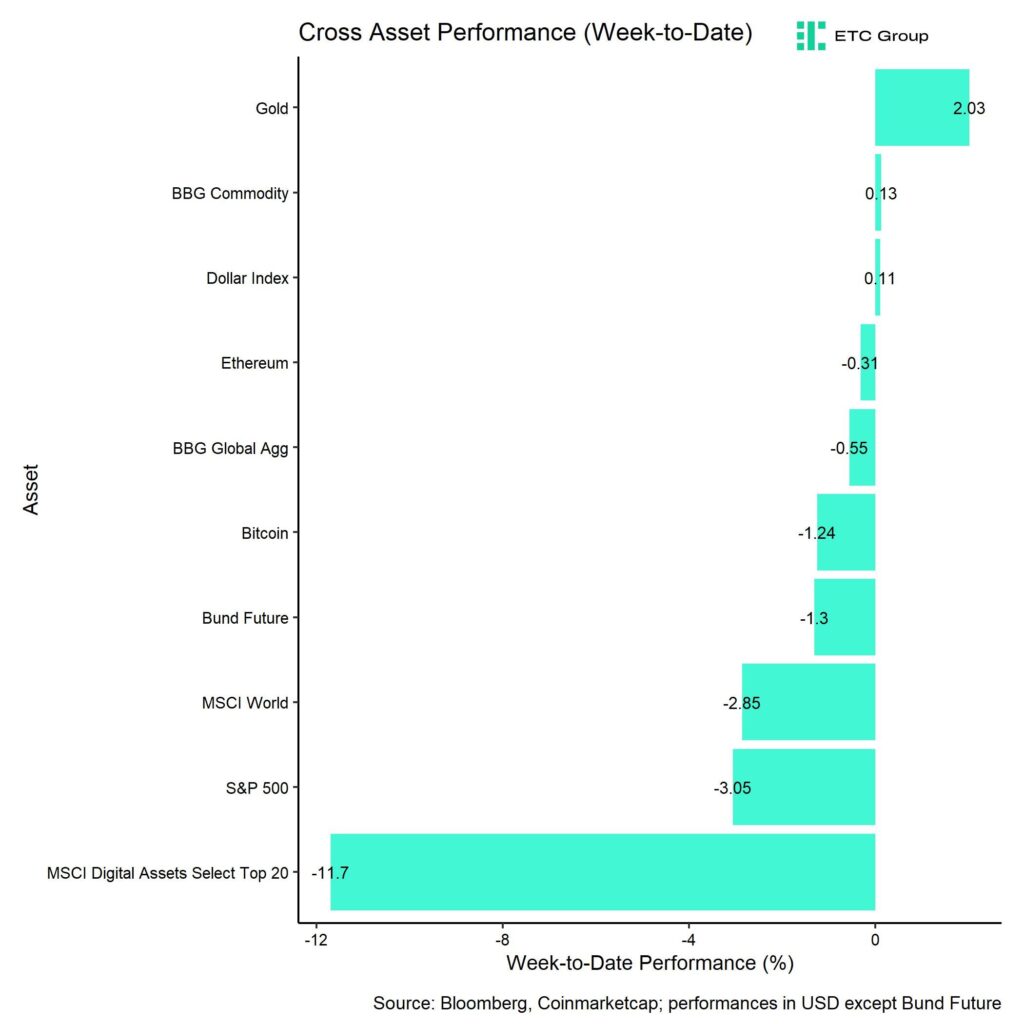
Last week, cryptoassets came under pressure on account of rising geopolitical risks in the Middle East that led to a general decline in risky assets across the board.
However, most major cryptoassets have already retraced most of these losses amid the highly anticipated Bitcoin Halving that has halved the block subsidy from 6.25 BTC per block to 3.125 BTC. The fourth Bitcoin Halving has occurred on the 20th April at 02:09:27 UTC.
We think that the positive performance effect of the Halving is not priced in and expect this effect to unfold after around 100 days after this event, i.e. around July 2024 onwards. The reason is that the supply deficit induced by the Bitcoin Halving only tends to accumulate over time and is rather insignificant in the very short term.
In general, it is important to note that most of the Halving related performance tends to accrue after Halving event dates which implies that Halving events have not been “front-run” by investors in the past. Besides, the performance differences post- and pre-Halving were so significant that the Halving effect is unlikely to be pure coincidence. Read more in our deep dive into the Bitcoin Halving here.
Along with the latest Halving, we saw a significant spike in transaction fees in the Bitcoin core network which has sparked renewed discussions around the viability of Bitcoin as a means-of-exchange. In fact, we saw a record-high in daily revenue for Bitcoin miners just yesterday of around 107 mn USD of which around 80 mn USD came from transaction fees alone.
The introduction of Runes, a new protocol that enables users to ”etch” and mint tokens on the Bitcoin blockchain, may be the cause of the fee increase. Speculators flocked to create tokens and trade meme coins as soon as Runes launched, which accelerated transaction volume and raised transaction fees.
At the time of writing, there were 3,700 Runes inscriptions total on the Bitcoin blockchain, according to data source Ord.io.
We think that these increases in transaction fees will only accelerate the usage of more cost-effective Bitcoin Layer 2 solutions like the Lightning Network and or no material risk to Bitcoin. To the contrary, the increase in transactions fees as a percentage of the overall block reward should continue to incentivize Bitcoin miners to secure the network amid decreasing block subsidies going forward.
Meanwhile, Ethereum managed to outperform Bitcoin amid the stalling bull market rallye along with a general rotation into altcoins.
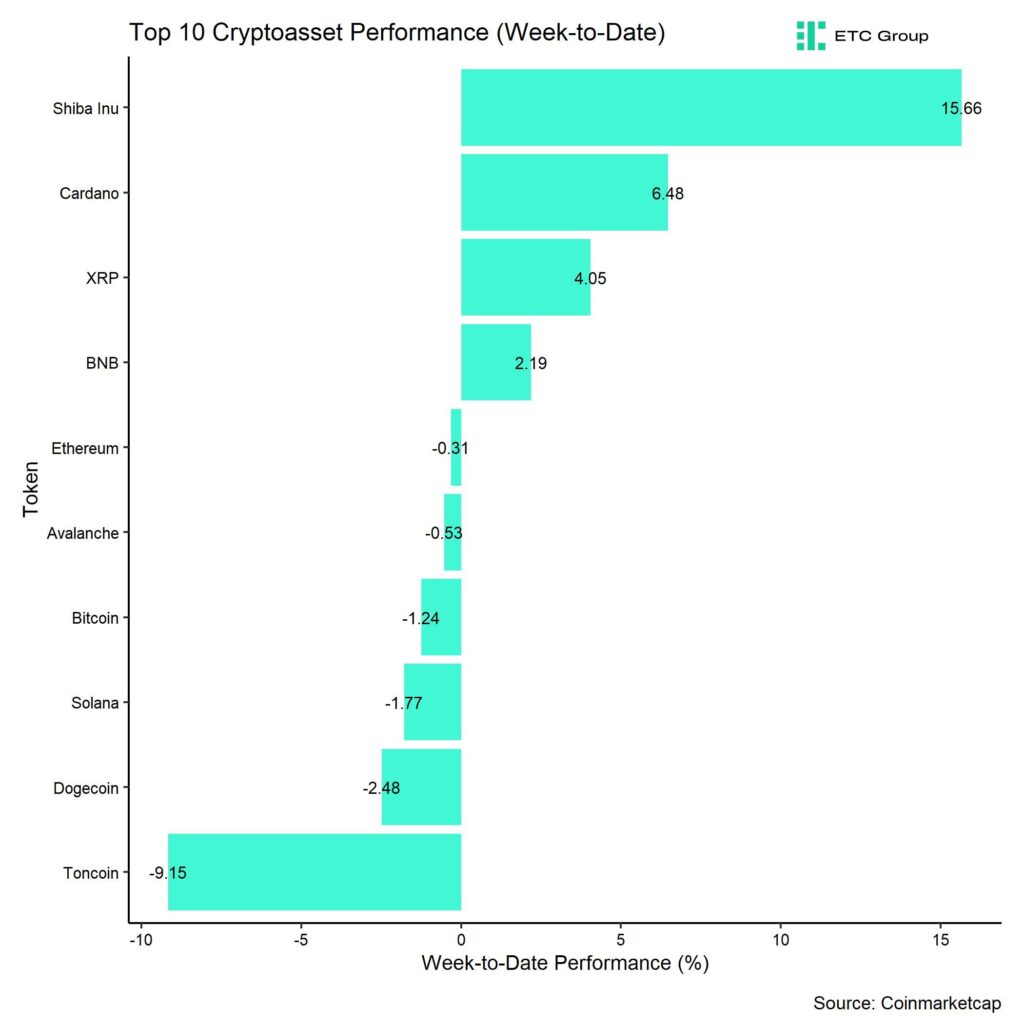
In general, among the top 10 crypto assets, Shiba Inu, Cardano, and XRP were the relative outperformers.
Overall altcoin outperformance vis-à-vis Bitcoin also picked up compared to the week prior, with around 65% of our tracked altcoins managing to outperform Bitcoin on a weekly basis.
Sentiment
Our in-house “Cryptoasset Sentiment Index” has rebounded from year-to-date lows that were induced by the rise in geopolitical tensions. The index is currently still signalling bearish sentiment.
At the moment, only 2 out of 15 indicators are above their short-term trend.
Based on the significant reduction in sentiment, we think that a short-term stabilization is very likely.
Last week, there were significant reversals to the downside in the global crypto hedge fund beta and BTC long futures liquidation dominance.
The Crypto Fear & Greed Index remains in ”Greed” territory as of this morning.
Besides, our own measure of Cross Asset Risk Appetite (CARA) has also decreased throughout the week which signals increased bearish sentiment in traditional financial markets.
Performance dispersion among cryptoassets has increased amid the recent correction. Overall performance dispersion still remains slightly elevated.
In general, high performance dispersion among cryptoassets implies that correlations among cryptoassets are low, which means that cryptoassets are trading more on coin-specific factors and that cryptoassets are increasingly decoupling from the performance of Bitcoin.
This is also consistent with the fact that altcoin outperformance vis-à-vis Bitcoin has recently picked up compared to the week prior, with around 65% of our tracked altcoins that have outperformed Bitcoin on a weekly basis. At the same time, there was a slight outperformance of Ethereum vis-à-vis Bitcoin last week.
In general, increasing altcoin outperformance tends to be a sign of increasing risk appetite within cryptoasset markets.
Fund Flows
Last week, we saw a pick-up in overall crypto ETP redemptions and net outflows amid a broad risk-off environment of around -239.7 mn USD (week ending Friday) based on Bloomberg data.
Global Bitcoin ETPs dominated with net outflows of -203.4 mn USD of which -204.6 mn (net) were related to US spot Bitcoin ETFs alone. The ETC Group Physical Bitcoin ETP (BTCE) also saw net outflows equivalent to -34.4 mn USD last week.
The Grayscale Bitcoin Trust (GBTC) continued to experience high net outflows of approximately -458.4 mn USD last week. However, other US spot Bitcoin ETFs even managed to attract +254 mn USD (ex GBTC).
Global Ethereum ETPs also saw significant net outflows last week of around -67.7 mn USD. Meanwhile, the ETC Group Physical Ethereum ETP (ZETH) had neither creations nor redemptions (+/- 0 mn USD). The same is true for the ETC Group Ethereum Staking ETP (ET32) last week.
Besides, Altcoin ETPs ex Ethereum again managed to attract net inflows of around +19.3 mn USD amid the rotation into altcoins last week.
Besides, Thematic & basket crypto ETPs also experienced net inflows of +11.9 mn USD, based on our calculations. The ETC Group MSCI Digital Assets Select 20 ETP (DA20) also experienced net inflows of around +0.8 mn USD last week.
Besides, the beta of global crypto hedge funds to Bitcoin over the last 20 trading decreased significantly to around 0.64 which implies that global crypto hedge funds have significantly reduced their market exposure and are significantly underweight relative to the market.
On-Chain Data
Despite the recent sell-off towards 60k USD in Bitcoin, coins continue to be taken off exchanges on a net basis as BTC exchange balances have recently reached a new multiyear low. Likewise, Ethereum has seen a continued drawdown in exchange balances which should provide a tailwind for the smart contract platform.
That being said, the latest sell-off saw an increase in net BTC transfers to exchanges by larger wallet sizes (>10 mn USD) which is usually a bearish signal.
This is also corroborated by positive net BTC exchange inflows from whales (entities that control at least 1,000 BTC) over the past week.
Overall net buying volumes for Bitcoin have been negative over the past week as evidenced by negative cumulative volume delta (CVD) on exchanges. The cumulative volume delta (CVD), which measures the net difference between buying and selling trade volumes, was negative with around -261 mn USD in net selling volumes over the past week.
Continuing negative US spot Bitcoin ETF fund flows were certainly a major driver of this selling volume.
In our latest report at the end of March, we wrote:
“Ongoing consolidation appears to be relatively likely in the short term despite the upcoming Bitcoin Halving in April. The reason is that the positive effects from the Halving only become visible around 100 days after the Halving according to our latest analyses.
If the market was trading lower, we should find support in Bitcoin near 55.4k USD as the short-term holder’s cost basis is around that price level. Short-term holders tended to capitulate whenever the price dipped below their cost basis which should provide a solid basis for a continuation of the bull market.”
We still expect this to be our base case although the significant decrease in Cryptoasset Sentiment Index has made a short-term stabilization very likely.
The spike in inscriptions induced network activity and fees in the Bitcoin network could also be a headwind in the short-term as active addresses have plunged to year-to-date lows recently.
This implies that high transaction fees are somewhat leading to lower usage of the Bitcoin network as users might be waiting for lower fess. Transaction fess are already becoming increasingly prohibitive for some users.
Futures, Options & Perpetuals
Last week, there was a general decline in both Bitcoin futures and perpetual open interest due to increased liquidations and a general de-risking in positioning.
Bitcoin futures open interest on CME also continued to decrease. Since the peak in open interest on the 20th of March, open interest in Bitcoin CME futures has already declined by -29k BTC.
Consistent with this development the Bitcoin futures basis also continued to decline. At the time of writing, the 3-months annualized Bitcoin futures basis rate is at around 10.0% p.a. which marks a significant decline from the highs observed at the end of March (~30.4% p.a.).
The Bitcoin perpetual funding rate also declined significantly and also went negative on Thursday last week.
In contrast, Bitcoin options’ open interest even increased slightly last week. The Put-call open interest went sideways last week. There was also no significant spike in relative trading volumes between puts and calls that you would normally expect during a sell-off like last week.
That being said, the 25-delta BTC 1-month option skew increased significantly as BTC options traders paid significantly higher volatility premia for puts than for delta-equivalent calls. Skews have normalized a bit more recently though.
Meanwhile, BTC option implied volatilities remained relatively elevated. Implied volatilities of 1-month ATM Bitcoin options are currently at around 69.7% p.a.
Bottom Line
• Cryptoassets rebound from losses sparked by geopolitical tensions amid Bitcoin Halving
• Our in-house “Cryptoasset Sentiment Indicator” has also rebounded from year-to-date lows
• Bitcoin Halving: In the past, most of the positive performance accrued after the Halving event
To read our Crypto Market Compass in full, please click the button below:

Disclaimer
Important Information
The information provided in this material is for informative purposes only and does not constitute investment advice, a recommendation or solicitation to conclude a transaction. This document (which may be in the form of a blogpost, research article, marketing brochure, press release, social media post, blog post, broadcast communication or similar instrument – we refer to this category of communications generally as a “document” for purposes of this disclaimer) is issued by ETC Issuance GmbH (the “issuer”), a limited company incorporated under the laws of Germany, having its corporate domicile in Germany. This document has been prepared in accordance with applicable laws and regulations (including those relating to financial promotions). If you are considering investing in any securities issued by ETC Group, including any securities described in this document, you should check with your broker or bank that securities issued by ETC Group are available in your jurisdiction and suitable for your investment profile.
Exchange-traded commodities/cryptocurrencies, or ETPs, are a highly volatile asset and performance is unpredictable. Past performance is not a reliable indicator of future performance. The market price of ETPs will vary and they do not offer a fixed income. The value of any investment in ETPs may be affected by exchange rate and underlying price movements. This document may contain forward-looking statements including statements regarding ETC Group’s belief or current expectations with regards to the performance of certain asset classes. Forward-looking statements are subject to certain risks, uncertainties and assumptions, and there can be no assurance that such statements will be accurate and actual results could differ materially. Therefore, you must not place undue reliance on forward-looking statements. This document does not constitute investment advice nor an offer for sale nor a solicitation of an offer to buy any product or make any investment. An investment in an ETC that is linked to cryptocurrency, such as those offered by ETC Group, is dependent on the performance of the underlying cryptocurrency, less costs, but it is not expected to match that performance precisely. ETPs involve numerous risks including, among others, general market risks relating to underlying adverse price movements and currency, liquidity, operational, legal, and regulatory risks.


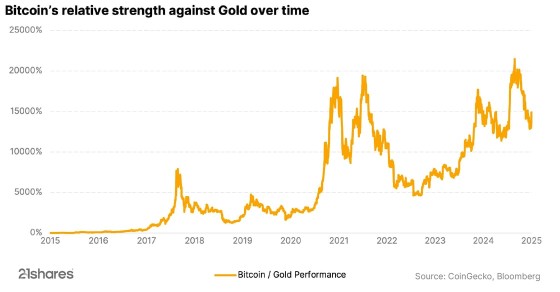
Bitcoin’s price has taken a different path from U.S. stocks over the past weeks. While major indexes such as the S&P 500 and Nasdaq have experienced declines, Bitcoin has risen to its highest levels in recent months, positioning itself as a safe haven, similar to gold. Understand how Bitcoin and gold have been synced for some time and what the correlation might look like in the future.

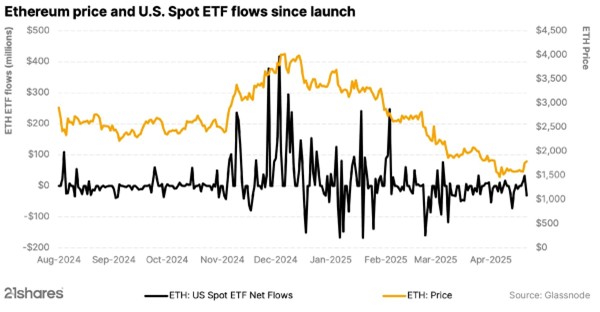
Ethereum’s big reboot: Why investors should be excited
Ethereum is making headlines due to a potential change in its core software, the Ethereum Virtual Machine (EVM), that operates across thousands of computers, enabling Ethereum to execute smart contracts and securely track transactions. However, Ethereum’s co-founder, Vitalik Buterin, has suggested replacing the EVM with a new system called RISC-V. Discover why the change is necessary and its potential impact on investors.


Thousands of altcoins, but no altcoin season: What comes next?
Over the past year, the crypto market has entered a new era. Bitcoin hit new all-time highs, outperforming other cryptocurrencies and decoupling from the stock market. Unlike previous cycles, the expected “altcoin season” did not occur, with Bitcoin remaining strong and money not flowing into other cryptocurrencies or altcoins. So, the big question is: Has altcoin season run its course?

Research Newsletter
Each week the 21Shares Research team will publish our data-driven insights into the crypto asset world through this newsletter. Please direct any comments, questions, and words of feedback to research@21shares.com
Disclaimer
The information provided does not constitute a prospectus or other offering material and does not contain or constitute an offer to sell or a solicitation of any offer to buy securities in any jurisdiction. Some of the information published herein may contain forward-looking statements. Readers are cautioned that any such forward-looking statements are not guarantees of future performance and involve risks and uncertainties and that actual results may differ materially from those in the forward-looking statements as a result of various factors. The information contained herein may not be considered as economic, legal, tax or other advice and users are cautioned to base investment decisions or other decisions solely on the content hereof.


From digital asset to safe haven: Why is Bitcoin acting like gold?

WELC ETF ger exponering mot företag inom sällanköpsvaror

Introduction to Celestia

YYYY ETF använder optioner för att ge månadsvis utdelning
Virtune lanserar Virtune Stellar ETP på Nasdaq Stockholm
Crypto Market Risks & Opportunities: Insights on Bybit Hack, Bitcoin, and Institutional Adoption

Montrose storsatsning på ETFer fortsätter – lanserar Sveriges första globala ETF med hävstång

Svenskarna har en ny favorit-ETF

MONTLEV, Sveriges första globala ETF med hävstång

Sju börshandlade fonder som investerar i försvarssektorn
-

 Nyheter4 veckor sedan
Crypto Market Risks & Opportunities: Insights on Bybit Hack, Bitcoin, and Institutional Adoption
-
 Nyheter4 veckor sedan
Montrose storsatsning på ETFer fortsätter – lanserar Sveriges första globala ETF med hävstång
-
 Nyheter4 veckor sedan
Svenskarna har en ny favorit-ETF
-
 Nyheter4 veckor sedan
MONTLEV, Sveriges första globala ETF med hävstång
-
 Nyheter3 veckor sedan
Sju börshandlade fonder som investerar i försvarssektorn
-

 Nyheter3 veckor sedan
Världens första europeiska försvars-ETF från ett europeiskt ETF-företag lanseras på Xetra och Euronext Paris
-

 Nyheter4 veckor sedan
Europeisk försvarsutgiftsboom: Viktiga investeringsmöjligheter mitt i globala förändringar
-

 Nyheter3 veckor sedan
21Shares bildar exklusivt partnerskap med House of Doge för att lansera Dogecoin ETP i Europa