
Nyheter
ETFmarknaden i Europa firar sitt 24-årsjubileum med tillgångar på två biljoner USD

ETFGI, ett ledande oberoende forsknings- och konsultföretag som täcker trender i det globala ETF-ekosystemet, rapporterar att ETFmarknaden i Europa firar sitt 24-årsjubileum med rekordtillgångar på nästan 2 biljoner US-dollar. De första europanoterade ETF:erna gjorde sin debut den 11 april 2000. Dessa två ETFer var baserade på Euro Stoxx 50– och Stoxx Europe 50-indexen, och de var noterade på Deutsche Boerse i Tyskland.
Tillgångar som investerats i ETF-branschen i Europa nådde rekordhöga 1,96 biljoner USD i slutet av mars. Under mars samlade ETF-branschen i Europa nettoinflöden på 11,02 miljarder USD, vilket ger årets nettoinflöden till 49,52 miljarder USD, enligt ETFGIs mars 2024 europeiska ETFer och ETPers industrilandskapsrapport, den månatliga rapporten som är en del av en årlig betald forskningsprenumerationstjänst. (Alla dollarvärden i USD om inget annat anges.)
Höjdpunkter
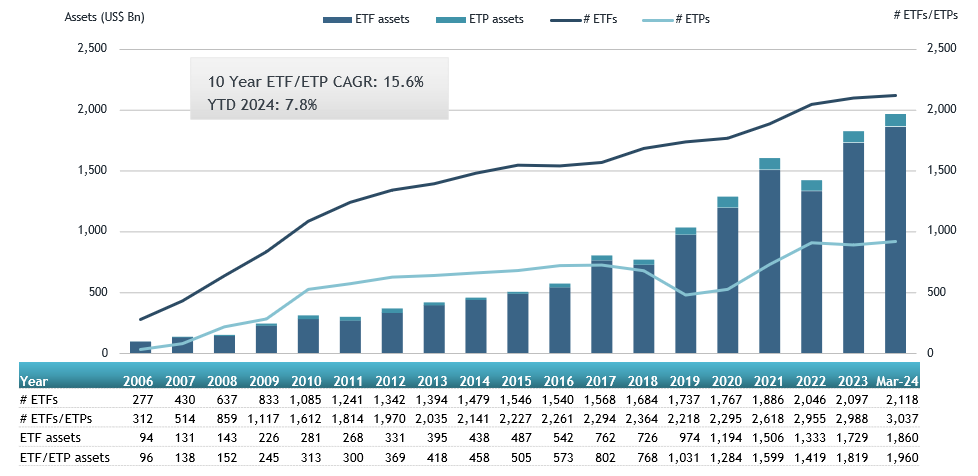
- Tillgångar som investerats på ETFmarknaden i Europa nådde ett rekord på 1,96 Tn i slutet av mars och slog det tidigare rekordet på 1,90 Tn i slutet av februari 2024.
- Tillgångarna ökade med 7,8 % YTD 2024, från 1,82 Tn USD i slutet av 2023 till 1,96 Tn USD.
- Nettoinflöden på 11,02 miljarder USD i mars 2024.
- YTD nettoinflöden på 49,52 miljarder USD är tredje högsta någonsin efter YTD nettoinflöden på 59,30 miljarder USD 2021 och YTD nettoinflöden på 49,73 miljarder USD 2022.
- Artonde månaden med på varandra följande nettoinflöden.
”S&P 500-indexet ökade med 3,22 % i mars och är upp 10,56 % YTD 2024. De utvecklade marknaderna exklusive det amerikanska indexet ökade med 3,62 % i mars och steg 5,26 % YTD 2024. Spanien (upp 10,72 %) och Italien (upp 6,34 %) såg de största ökningarna bland de utvecklade marknaderna i mars. Emerging markets-indexet ökade med 1,50 % under mars och steg 2,08 % YTD 2024. Peru (upp 10,27 %) och Columbia (upp 8,19 %) såg de största ökningarna bland tillväxtmarknaderna i mars”, enligt Deborah Fuhr, managing partner, grundare och ägare av ETFGI.
Tillgångstillväxt i ETF-branschen i slutet av mars
Källa: ETFGI
I slutet av mars hade ETFmarknaden i Europa 3 037 produkter, med 12 209 noteringar, tillgångar på $1,96 Tn, från 99 leverantörer listade på 29 börser i 24 länder.
Under mars samlade ETFer nettoinflöden till 11,02 miljarder USD. Aktie-ETFer samlade nettoinflöden på 9,81 miljarder USD under mars, vilket förde YTD nettoinflöden till 39,30 miljarder USD, högre än 19,38 miljarder USD i nettoinflöden av eget kapital YTD 2023. Ränte-ETFer rapporterade nettoinflöden på 719,00 USD YTD under 1 mars, vilket gav 25 USD nettoinflöden. miljarder, lägre än 15,49 miljarder USD i nettoinflöden YTD år 2023. Råvaru-ETFer rapporterade nettoutflöden på 75,35 miljoner USD under mars, vilket förde YTD nettoutflöden till 2,32 miljarder USD, lägre än 1,67 miljarder USD i nettoinflöden YTD 2023. på 670,27 miljoner USD under månaden, vilket samlade ett nettoinflöde för året i Europa på 2,33 miljarder USD, högre än 2,17 miljarder USD i nettoinflöden YTD 2023.
Betydande inflöden kan tillskrivas de 20 bästa ETFerna av nya nettotillgångar, som samlat in 9,63 miljarder USD under mars. iShares Core S&P 500 UCITS ETF – Acc (CSSPX SW) samlade in 918,91 miljoner USD, det största enskilda nettoinflödet.
Topp 20 ETFer efter nettoinflöden i mars 2024: Europa
| Namn | Kortnamn | Assets ($ Mn) Mar-24 | NNA ($ Mn) YTD-24 | NNA ($ Mn) Mar-24 |
| iShares Core S&P 500 UCITS ETF – Acc | CSSPX SW | 84,308.60 | 4,744.81 | 918.91 |
| UBS ETF (LU) MSCI United Kingdom UCITS ETF (GBP) A-acc – Acc | UC64 | 2,485.72 | 653.33 | 753.94 |
| Invesco MSCI USA ESG Universal Screened UCITS ETF – Acc | ESGU | 2,188.25 | 792.66 | 741.48 |
| Xtrackers II EUR Overnight Rate Swap UCITS ETF – 1C – Acc | DBXT | 7,281.96 | 2,089.43 | 596.35 |
| HSBC S&P 500 UCITS ETF | H4ZF | 6,756.08 | 661.46 | 562.23 |
| iShares MSCI EM ESG Enhanced UCITS ETF | EEDM | 5,000.88 | 886.95 | 556.22 |
| Vanguard FTSE All-World UCITS ETF | VGWL | 24,771.34 | 1,410.78 | 545.51 |
| Invesco S&P 500 UCITS ETF – Acc | P500 | 25,176.99 | 939.08 | 497.72 |
| iShares MSCI ACWI UCITS ETF – Acc | IUSQ | 12,806.01 | 1,453.06 | 469.35 |
| iShares USD Treasury Bond 0-1yr UCITS ETF | IBCC | 14,990.95 | 1,433.49 | 431.07 |
| iShares € High Yield Corp Bond UCITS ETF | EUNW | 7,694.75 | 1,427.77 | 413.53 |
| SPDR S&P 500 UCITS ETF | SPY5 | 12,491.17 | 3,418.58 | 388.74 |
| iShares Core MSCI World UCITS ETF – Acc | EUNL | 75,051.88 | 3,236.70 | 382.75 |
| Amundi Bloomberg Equal-weight Commodity ex-Agriculture UCITS ETF – Acc | LYTR | 1,668.95 | 367.30 | 378.26 |
| iShares STOXX Europe Small 200 UCITS ETF (DE) | SCXPEX | 916.86 | 401.43 | 357.42 |
| Amundi MSCI Japan UCITS ETF – Acc | LCUJ | 4,400.85 | 158.96 | 343.86 |
| UBS ETF (CH) – MSCI Switzerland (CHF) A-dis – Acc | SWICHA | 1,126.17 | 354.69 | 335.87 |
| SPDR MSCI World UCITS ETF – Acc | SPPW | 5,653.51 | 715.38 | 324.95 |
| Amundi S&P 500 Climate Net Zero Ambition PAB UCITS ETF | ZPA5 | 3,965.66 | 925.46 | 320.42 |
| JPMorgan US Research Enhanced Index Equity ESG UCITS ETF – Acc | JREU | 7,047.30 | 1,230.55 | 315.09 |

Källa ETFGI
De 10 bästa ETPerna av nya nettotillgångar samlade ihop 1,69 miljarder USD under mars. WisdomTree Physical Silver – Acc (PHAG LN) samlade in 832,90 miljoner USD, det största enskilda nettoinflödet.
Topp 10 ETPer efter nettoinflöden i mars 2024: Europa
| Namn | Kortnamn | Assets ($ Mn) Mar-24 | NNA ($ Mn) YTD-24 | NNA ($ Mn) Mar-24 |
| WisdomTree Physical Silver – Acc | VZLC | 2,057.21 | 793.35 | 832.90 |
| iShares Physical Silver ETC – Acc | SSLN | 785.65 | 254.30 | 245.97 |
| Xtrackers IE Physical Gold ETC Securities – Acc | XGDU | 3,640.08 | 231.87 | 167.72 |
| AMUNDI PHYSICAL GOLD ETC (C) – Acc | GOLD | 4,575.61 | 307.29 | 127.12 |
| Xtrackers Physical Gold ETC (EUR) – Acc | XAD5 | 2,202.38 | 92.10 | 80.28 |
| WisdomTree Copper – Acc | OD7C | 1,667.78 | 337.85 | 68.51 |
| Xtrackers Physical Gold Euro Hedged ETC – Acc | XAD1 | 1,335.65 | 5.06 | 50.49 |
| SG ETC FTSE MIB -3x Daily Short Collateralized – Acc | MIB3S | 33.07 | 88.10 | 40.49 |
| 21Shares Toncoin Staking ETP | TONN | 40.81 | 39.94 | 39.94 |
| Invesco Physical Gold ETC – EUR Hdg Acc | 8PSE | 564.18 | 59.65 | 33.11 |

Källa: ETFGI
Investerare har tenderat att investera i Equity ETFs under mars.


The second half of February turned turbulent for investors, with both traditional and crypto markets experiencing significant downturns as risk-off sentiment took hold.
Investors reacted to weakening economic indicators—including signals pointing to potentially lower US GDP this quarter—and rising geopolitical tensions in Eastern Europe and the Middle East, prompting a move away from risk assets. Traditional safe havens such as gold and US treasuries saw inflows, reinforcing the market’s sensitivity to macro uncertainty.
In addition to being impacted by these macro factors, crypto assets faced headwinds from news about the largest exchange hack in history, memecoin craziness, and a perception the US administration isn’t moving fast enough with its crypto-related initiatives. This was quite a lot of negative newsflow in a short period of time, and as a result crypto suffered, with bitcoin (BTC) hitting a three-month low last week, trading over 20% off its most recent all time high.
So, have these events effectively killed the crypto bull market?
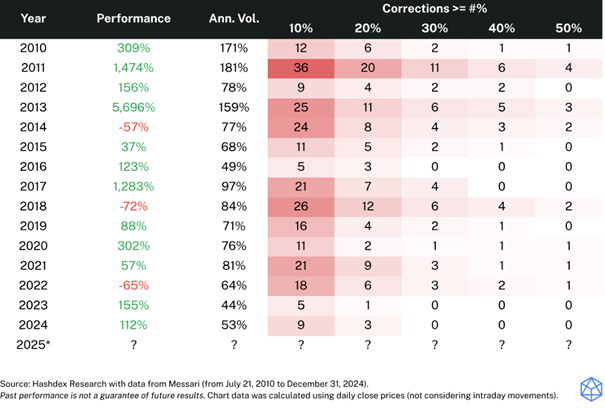
The short answer is no. We don’t see any signs recent events are dragging down the bull market and while short-term volatility can be unsettling, it also serves as a reminder that these phases of crypto cycles rarely move in a straight line. Historical bull runs have always included periods of heightened volatility and sharp corrections. The 2020–2021 rally, for example, saw multiple pullbacks of 20% or more before BTC ultimately reached new highs. The current situation is part of the natural market cycle rather than a definitive trend reversal.
BTC performance, volatility, and corrections since 2010
Let’s go a little deeper into recent events why they do not impact the long-term case for crypto.
Long-term holders are “hodling”
If you look at where bitcoin’s recent selling pressure is coming from, it’s from traders and the most very short-term holders. If we look at BTC’s Spent Volume Average Band, a metric that shows how long the coins were held that are being sold, it’s very clear the overwhelming majority of BTC sold in the last week was short-term trading activity. In fact, almost 90% of the selling activity from February 21 to February 26 was BTC held for less than a month.
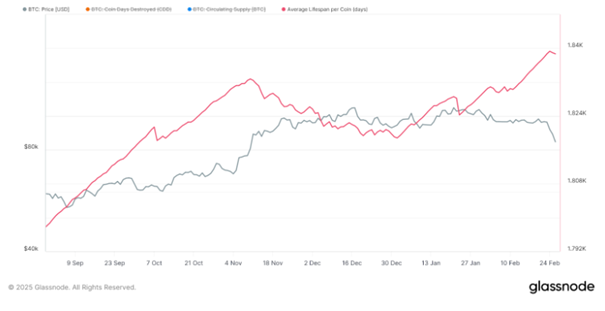
Recent BTC selling pressure is from trading activity

We can also see from looking at this data that the average holding period for BTC investors is nearly five years. In other words, long-term holders of BTC do not react to near-term events.
BTC holding period has increased over time
But what should investors make about the recent exchange hack, the ongoing memecoin frenzy, and the perception that President Trump might not deliver on his crypto promises? A few thoughts on these events and why I don’t think they will have a lasting impact on the investment case for the crypto asset class.
• Bybit hack: This exchange breach last week resulted in the loss of 401,000 ETH (approximately $1.3 billion), sending shockwaves through the crypto community. While Bybit has reassured users that losses will be covered, the attack has reignited security concerns, particularly as exchange-related hacks have declined in recent years. Hashdex was not impacted by this event given the very strict vetting criteria we have in place for all of the third parties we interact with, including custodians and exchanges. However, while the incident serves as a stark reminder of the importance of vetted custody solutions, we do not see the hack having a long-term negative impact on the fundamentals we believe are driving opportunities in the crypto asset class.
• Memecoin madness: The recent market decline can also be attributed in part to a liquidity shift driven by the memecoin craze. Tokens such as TRUMP, which saw heavy trading during the presidential inauguration, and LIBRA, which surged this month following the controversy surrounding Argentina’s President Javier Milei, have drawn significant market attention and raised concerns over who benefits from this type of activity. While memecoins often generate short-term excitement, some investors worry that capital has been diverted away from more productive sectors of the crypto economy, increasing overall market vulnerability. This is certainly a valid concern and I believe that the short-term memecoin activity helps make the case for investing in an institutional quality index like the Nasdaq Crypto Index, which has strict criteria for vetting crypto assets. There will continue to be a lot of noise in the crypto space for the foreseeable future, and we think investors are well-served by being able to track a benchmark that has a methodology built to eliminate this type of superfluous activity.
• Trump’s delays: During his campaign, President Trump expressed significant support for crypto, even proposing the US consider a bitcoin stockpile. However, there is a perception among some that his administration has not moved fast enough on this initiative and others. These developments take time—including the important work underway at the SEC’s Crypto Task Force—and we have strong conviction that the regulatory landscape for crypto will continue to dramatically improve in the US in the coming months and years.
Where do we go from here?
Bitcoin’s recent price action has pushed it below its $90,000–$110,000 trading range, and some technical indicators suggest a potential move lower if selling pressure persists. However, there are key levels that could serve as support.
Options market data from Deribit shows that the highest open interest for BTC options is at the $80,000 strike price, indicating that this level could act as a floor in the near term. Historically, such areas of high open interest tend to provide price support as traders hedge positions and market makers adjust exposure.
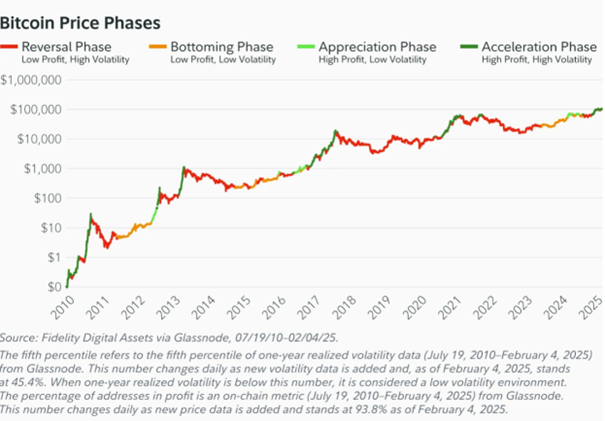
If macroeconomic conditions stabilize or there is more favorable news toward crypto from the US government, we could see BTC recover to the $90,000–$105,000 range in the coming weeks. In other words, the bull market is fully on track and bitcoin remains in line with performance in previous phases.
Regardless of what happens with near-term prices, the structural fundamentals of the crypto market remain strong, and nothing in the past week suggests a major shift in the broader bull cycle. Institutional adoption continues to progress, with increasing interest in spot bitcoin ETFs and broader integration of blockchain technology in traditional finance. The long-term trajectory remains positive, but as with any market, patience and risk management are key.
As history has shown, bull markets rarely move in a straight line, but investors with a clear, long-term strategy are best positioned to navigate this volatility and capitalize on future opportunities.
The digital asset market is evolving rapidly, with institutional investors increasingly allocating to Bitcoin and other digital assets. As adaption grows, the demand for established, transparent, and regulated investment solutions has never been higher.
Since 2018, 21Shares has been at the forefront of this transformation, offering one of the largest and most diverse ranges of crypto ETPs in Europe for both professional and retail investors. Our proven track record and commitment to innovation continues to set the benchmark in the industry.
If you’re looking to gain exposure to Bitcoin or think about a wider allocation to digital assets through regulated and accessible solutions, explore our products:
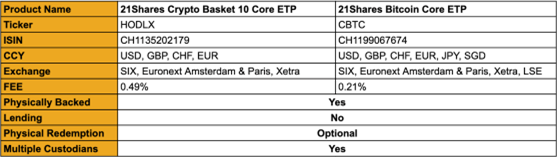
• 21Shares Bitcoin Core ETP (21BC)
Gain direct exposure to Bitcoin, the pioneering digital asset, through a regulated investment solution with a low management fee of 0.21%.
• 21Shares Crypto Basket 10 Core ETP (21HX)
Access a diversified portfolio comprising the top ten digital assets by market capitalization for balanced exposure, with a low management fee of 0.49%.
Discover our solutions today and join us in shaping the future of crypto investing.


XB31 ETF investerar i företagsobligationer med förfall 2031

Is the crypto bull market over?
Regulated Crypto Investing Starts Here

Sprott Asset Management lanserar den första ETCen för fysiskt uran i Europa

U.S. Global Investors VD lyfter fram reseboom, AIs roll och ETF-resultat

MONTDIV ETF är Sveriges första månadsutdelande ETF

Varför investera i indexfonder?

De mest eftersökta ETFerna i januari 2025

Fastställd utdelning i XACT Norden Högutdelande 2025

Montrose lanserar Sveriges första månadsutdelande ETF
-
 Nyheter5 dagar sedan
MONTDIV ETF är Sveriges första månadsutdelande ETF
-
 Nyheter2 veckor sedan
Varför investera i indexfonder?
-
 Nyheter4 veckor sedan
De mest eftersökta ETFerna i januari 2025
-
 Nyheter4 veckor sedan
Fastställd utdelning i XACT Norden Högutdelande 2025
-
 Nyheter1 vecka sedan
Montrose lanserar Sveriges första månadsutdelande ETF
-

 Nyheter4 veckor sedan
Ethereum vs Solana – The iOS vs Android of Crypto
-

 Nyheter3 veckor sedan
Börshandlade fonder för att investera i cybersäkerhet
-

 Nyheter1 vecka sedan
BlackRock lanserar aktivt förvaltad Fixed Income UCITS ETF