
Nyheter
Reductions in Supply and Debt Levels Provide Stability in 1Q
Reductions in Supply and Debt Levels Provide Stability in 1Q. The first quarter of 2016 was marked by evidence across the commodities spectrum that supply really is reacting both to low prices and low investment, and that a degree of stability may be creeping into markets. This was reflected in the solid improvement in the performance of the Global Hard Assets Fund (the “Fund”) during the quarter. In a dramatic reversal from the fourth quarter of 2015, Class A shares provided a total return for the first quarter of 11.18% (excluding sales charge). The Fund outperformed its commodity equities-based benchmark index, the Standard & Poor’s® (S&P) North American Natural Resources Sector Index (SPGINRTR), which returned 6.26% over the same period.
The Fund’s positions in the Gold, Diversified Metals & Mining, and Energy sectors were, in particular, significant contributors to positive performance. The two strongest contributing sectors were Gold (approximately 15.7% of Fund assets on average during the first quarter) and Diversified Metals & Mining (approximately 6.0% of Fund assets on average during the first quarter). Within the Energy sector, positive performance stemmed mainly from the Oil & Gas Exploration & Production (E&P) sub-industry (approximately 37.4% of Fund net assets on average during the first quarter). Within the Energy sector, the Oil & Gas Refining & Marketing sub-industry (approximately 4.0% of Fund assets on average during the first quarter) contributed negative performance, as did the Fertilizers & Agricultural Chemicals sub-industry (approximately 5.4% of Fund assets on average during the first quarter). During the quarter, the Fund continued to hold no position in Integrated Oil & Gas.
For comparative purposes, we continue to include total return figures for two additional commodity equity indices: the MSCI ACWI Commodity Producers Index (M2WDCOMP) and the Standard & Poor’s® (S&P) Global Natural Resources Index (SPGNRUN).
Fund Contribution
The top five contributing companies for the quarter came from the Diversified Metals & Mining and Gold sectors. Four of these were gold mining companies. During the quarter, as the other major metal miners finally embarked on their debt reduction programs, Glencore (4.2% of Fund net assets at period end*) benefited from the decisions it made back in 2015 to reduce its debt.
The fact that gold miners performed so well in the first quarter of the year provides, to us, strong confirmation that they came in to 2016 considerably more healthy than they have been for quite a while and deserved of a valuation re-rating.

(click to enlarge)
Barrick Gold (2.8% of Fund net assets at period end*) benefited from the restructuring it has been undertaking and its leverage to gold prices. Agnico Eagle Mines Ltd. (4.4% of Fund net assets at period end*) benefited from strong operational performance, its continued focus on cost reduction, and its engineering-related restructuring. Randgold Resources Ltd. (3.2% of Fund net assets at period end*) also benefited from strong operational performance and, not least, from the continuing strength of its balance sheet and the options with which this provided it. Goldcorp (3.3% of Fund net assets at period end*), which is now pursuing “organic” growth from opportunities available internally, rather than through acquisition, felt the benefits from the early stages of the restructuring plan put in place by its new CEO.
The five biggest individual performance detractors came from the Energy, Semiconductor Equipment (a.k.a. Solar) and the Fertilizers & Agricultural Chemicals sectors. Oil & Gas Exploration & Production company, SM Energy Co. (0.9% of Fund net assets at period end*) suffered, particularly in January, from concerns over its level of leverage. In addition to concerns about its leverage and liquidity early in the quarter, SemGroup Corp (0.9% of Fund net assets at period end*), an Oil & Gas Storage & Transportation company involved in midstream services, also faced questions about the status of some of its contracts and what might happen if any of its clients actually went bankrupt. Valero Energy Corp (3.5% of Fund net assets at period end*), an Oil & Gas Refining & Marketing company, suffered from the rebound in crude oil prices.
Semiconductor Equipment (Solar) company SunEdison (sold during the period*) faced considerable headwinds as the market’s interest in yieldcos, and their ability to access capital, continued to diminish. CF Industries Holdings (2.6% of Fund net assets at period end*) was hit by concerns around both Chinese production (which continued unabated) and the value of the Renminbi, in addition to concerns around nitrogen prices.
Market Review and Outlook
The quarter started with continuing concerns about growth in China, but also with concerns about U.S. growth. In January and through early-February, the market was more focused on financial than on economic concerns: about the Renminbi, further currency devaluations, and capital outflows from China. Although these appeared to have abated by the end of the quarter (amongst other things, the U.S. dollar had rolled over, relieving pressure not only on China’s, but also on other currencies), economic concerns still remained, albeit drawing less of a focus. Not least, data started to come through during the quarter indicating not only that Chinese copper purchases for 2015 were at a record level, but so, too, were imports of crude oil.
Both more negative interest rates and less confidence in the abilities of central banks led to gold becoming increasingly attractive during the quarter, particularly as a store of value, not least because it became cheaper to hold on a relative basis. As the price of the metal rose, gold miners, too, benefited. With many of them now having “put their houses in order”, they have been able to leverage a higher gold price and are now in a better spot than they have been at any time in the last four to five years.
In the metals and mining sector, Glencore performed especially well during the quarter. Much of this can be put down to the company’s vigorous and effective actions in addressing its level of debt. Whereas Glencore started really to address its leverage seriously during the third quarter of 2015, only at the end of the 2015, and the beginning of the 2016, did the other senior metals companies start to do the same. In the first quarter, the company continued to execute its plan to de-leverage its balance sheet, a course which it is set to pursue throughout the year, and about which we should expect further announcements in the second quarter. Glencore also benefited from a slight up-tick in metals prices during the first quarter.
During the quarter, there appeared to be no abatement in the geopolitical risks the world faced and still faces, risks that require continual monitoring. The situation in the Middle East continued to fester, despite Russia’s assertion that its job in Syria is now done. The bombings in Brussels and Lahore served only to demonstrate both the reach and ruthlessness of their respective terrorist perpetrators. Within this context, the uncertainty around elections in Germany, France and the U.S. only increased. As it did around the whole issue, and discussion, of Britain’s possible exit from the EU and the subsequent viability of the union were it actually to do so.
In the energy sector, there is clear evidence that crude oil supply is reacting to both current low prices and low investment. Certainly in the U.S., and in countries like Mexico, Brazil, Colombia, the UK (the North Sea) and China, there have been cuts in production. Demand continues to be stable and demand growth “on trend.” As we stated last quarter, although we anticipate a somewhat lackluster outlook for crude for the rest of this half, we are, however, a little more optimistic for the second half of the year.
We have been asked on occasion recently just how the current uptick in crude prices either compares or contrasts with the situation this time last year. We believe that there are a number of fundamental differences. In particular, at the start of 2015, supply was still increasing. The market was coming off a year where demand had disappointed. And while there may have been decent demand/consumption numbers, nobody really knew how solid (or real) they were. The rig count was falling, but was still at near record highs. The U.S. oil rig count may have dropped from 1,600 to 1,200 rigs in a matter of months, but it was still over 1,000 — a massive number! Recently we were at 354.
It is, therefore, not surprising that intense attention has been paid to the current status of production from U.S. oil shale. While the U.S. has accounted for the largest share of supply growth over the last six years, according to the EIA, it is likely to deliver shrinking supply over the next few years. This should come as a shock to no one as capital spending has been slashed and the number of rigs drilling for oil in the U.S. has plummeted, putting drilling activity back to a level roughly similar to the pre-shale oil era.
The intense scrutiny directed at U.S. production is understandable. However, we believe a much deeper structural story that could negatively impact global oil supply for the longer term is being somewhat overlooked. In our view, the underlying business model of the global integrated oil companies is under stress. While independent exploration and production companies reveal eye-popping capital spending cuts of nearly 50%, the integrated oil sector is also slashing spending by an unprecedented amount – nearing hundreds of billions of dollars over the 2014-2016 time period.
While capex and budgets were being cut in the first quarter of 2015, in this quarter they have been absolutely eviscerated. For example, at the beginning of 2015, capex for the integrateds was basically flat year over year. By the end of the year it was down roughly 23%-25%. And their forecast for this year is down approximately another 25%.
This is, indeed, in response to less cash available to invest due to current low oil prices, but it is also driven by poor operating results that have led the boards and executive management teams of these companies to question the likelihood of generating acceptable returns. Exploration success rates and the resultant replacement of reserves have been extremely weak in recent years. Thus, many integrated companies have begun to cancel or postpone projects past 2020.
With crude output in the U.S., Canada, and Iraq likely to be flat or declining over the next several years, where will new supply come from to meet a forecasted annual increase in demand of over one million barrels per day? In our opinion, the results of the integrated companies are an indication that most of the easy and cheap oil in the world has already been tapped and crude prices will need to rise to re-incentivize shale drilling − perhaps on a global basis.
As to what the Organization of the Petroleum Exporting Countries (OPEC) may be planning to do, it’s our opinion that there is no coordinated action between OPEC and Russia. Iran is a law unto itself. However the overhang of Iranian production is dissipating because it has already raised production to about 3.2 million barrels per day with an eventual goal of getting to four million barrels per day. Although it is probably several years out, we would expect its output gradually to approach that goal over those several years.
Equity issuance amongst E&P companies (to maintain the flexibility to drill again at some point) continued in the first quarter, raising more than $10 billion.
Toward the end of March we visited a number of prospective clients (and clients) around Europe. As an indication of how sentiment appears to have changed just this quarter, amongst the most common questions asked of us by the first group was: “Did I miss it?” The question was not had the Fund missed the rebound, but had they, the prospective clients! However, of all of them, only one prefaced the question by describing it as ridiculous. That said, it does remain important to note the difference between where we are now and where we were at the beginning of 2015. The fundamentals are quite different. Now, save for the two big wildcards of what’s going to happen with global growth and what’s going to happen with Iran, all the pieces are in place. Which leads to the question: Is it too late, or is it just the beginning?
One of the main pillars of our investment philosophy continues to be to look for long-term growth and the structural enhancement in intrinsic value in the companies in which we invest. Even in today’s extremely challenging market conditions this continues to be one of our guiding tenets. Since we remain convinced that positioning our portfolio for the future, and not just reacting to current circumstance, is of paramount importance, our focus across the sectors in which we invest remains on companies that can navigate commodity price.
By: Shawn Reynolds, Portfolio Manager
All indices listed are unmanaged indices and include the reinvestment of dividends, but do not reflect the payment of transaction costs, advisory fees or expenses that are associated with an investment in the Fund. An index’s performance is not illustrative of the Fund’s performance. Indi¬ces are not securities in which investments can be made. 1The S&P North American Natural Resources Sector Index (SPGINRTR) includes mining, energy, paper and forest products, and plantation-owning companies. 2The MSCI ACWI Commodity Producers Index (M2WDCOMP) is a free float-adjusted market capitalization index designed to reflect the performance of listed commodity producers across three industry (or sub-industry) categories as defined by the Global Industry Classification Standard: energy, metals, and agriculture. 3The S&P Global Natural Resources Index (SPGNRUN) includes 90 of the largest publicly traded companies in natural resources and commodities businesses that meet specific invest-ability requirements, offering investors diversified and investable equity exposure across three primary commodity-related sectors: agribusi¬ness, energy, and metals and mining. 4The S&P Goldman Sachs Commodity Index (SPGSCITR) is a composite index of commodity sector returns, representing an unleveraged, long-only investment in commodity futures.
Please note that the information herein represents the opinion of the portfolio manager based on the prevailing market conditions and their judgment as of the date of this document. These opinions may change at any time and from time to time. This document is not in¬tended to be a forecast of future events, a guarantee of future results or investment advice. In preparing this document, we have relied upon and assumed, without independent verification, the accuracy and completeness of all information available from public sources. Opinions and estimates may be changed without notice and involve a number of assumptions which may not prove valid. There is no guarantee that any forecasts or opinions in this material will be realized. Historical performance is not indicative of future results; cur¬rent data may differ from data quoted. Current market conditions may not continue. No part of this material may be reproduced in any form, or referred to in any other publication, without express written permission of VanEck. ©2016 VanEck.
You can lose money by investing in the Fund. Any investment in the Fund should be part of an overall investment program, not a complete program. The Fund is subject to risks associated with concentrating its investments in hard assets and the hard assets sector, including pre¬cious metals, natural resources and real estate, and can be significantly affected by events relating to these industries, including international political and economic developments, inflation, and other factors. The Fund’s portfolio securities may experience substantial price fluctuations as a result of these factors, and may move independently of the trends of industrialized companies. The Fund’s investments in foreign securi¬ties involve risks related to adverse political and economic developments unique to a country or a region, currency fluctuations or controls, and the possibility of arbitrary action by foreign governments, or political, economic or social instability. The Fund is subject to risks associated with investments in debt securities, derivatives, commodity-linked instruments, illiquid securities, asset-backed securities and CMOs. The Fund is also subject to inflation risk, market risk, non-diversification risk, leverage risk, credit risk and counterparty risk. Please see the prospectus and summary prospectus for information on these and other risk considerations.
Please call 800.826.2333 or visit vaneck.com for performance information current to the most recent month end and for a free prospectus and summary prospectus. An investor should consider the Fund’s investment objective, risks, and charges and expenses carefully before investing. The prospectus and summary prospectus contain this and other information. Please read them carefully before investing.


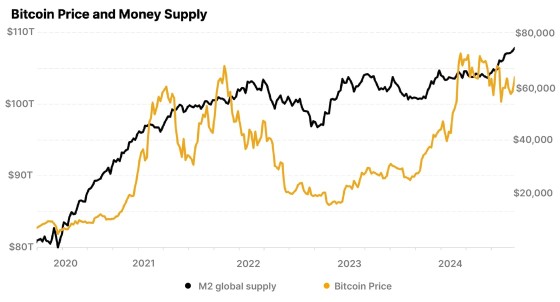
- Will liquidity continue driving Bitcoin’s price? Bitcoin’s relationship with M2 money supply.
- The evolution of Bitcoin from a fiat-alternative to an emerging store of value.
- Ethereum’s Pectra upgrade is poised to improve staking, blockchain efficiency, and scalability.
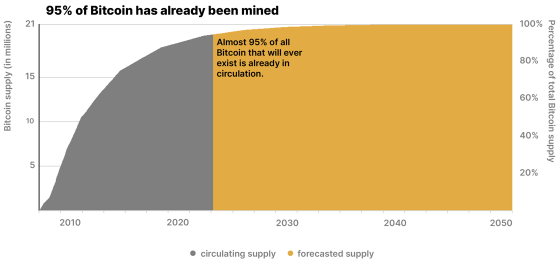
Will liquidity continue driving Bitcoin’s price?
Bitcoin has historically tracked global liquidity, with a 0.94 correlation to M2 money supply. But with inflation concerns, rate cut uncertainty, and geopolitical risks, could Bitcoin decouple? As adoption rises and strategic reserves grow, Bitcoin’s relationship with liquidity may be shifting. Here’s what you need to know.
The Full Story
The evolution of Bitcoin from fiat-alternative to emerging store of value
Originally designed as a decentralized payment system, Bitcoin has evolved into a global store of value, often called “digital gold.” By solving the double-spending problem and enabling secure, borderless transactions, Bitcoin has reshaped finance. Here’s how its role continues to evolve.
The Full Story

Pectra upgrade: improving Ethereum’s efficiency
Ethereum’s Pectra upgrade, set to launch later this year, introduces 11 key improvements enhancing staking, scalability, and user experience. From faster validator activations and cheaper Layer 2 transactions to gas fee flexibility, Pectra is highly anticipated to boost Ethereum’s efficiency. How will these upgrades shape Ethereum’s future?
The Full Story
Research Newsletter
Each week the 21Shares Research team will publish our data-driven insights into the crypto asset world through this newsletter. Please direct any comments, questions, and words of feedback to research@21shares.com
Disclaimer
The information provided does not constitute a prospectus or other offering material and does not contain or constitute an offer to sell or a solicitation of any offer to buy securities in any jurisdiction. Some of the information published herein may contain forward-looking statements. Readers are cautioned that any such forward-looking statements are not guarantees of future performance and involve risks and uncertainties and that actual results may differ materially from those in the forward-looking statements as a result of various factors. The information contained herein may not be considered as economic, legal, tax or other advice and users are cautioned to base investment decisions or other decisions solely on the content hereof.

Nyheter
WisdomTrees nya fonder ger access till Europas försvarssektor och den globala kärnkraftssektorn


Will liquidity continue driving Bitcoin’s price?

CEBI ETF amerikanska statsobligationer med förfall 2025

WisdomTrees nya fonder ger access till Europas försvarssektor och den globala kärnkraftssektorn
21Shares tillkännager avgiftssänkning för Bitcoin Ethereum Core ETP ABBA

EAAA ETF – Europas första CLO ETF

MONTDIV ETF är Sveriges första månadsutdelande ETF

Varför investera i indexfonder?

100 gånger pengarna, aktier som gör 10 000 kronor till 1 miljon

Montrose lanserar Sveriges första månadsutdelande ETF

BlackRock lanserar aktivt förvaltad Fixed Income UCITS ETF
-
 Nyheter2 veckor sedan
MONTDIV ETF är Sveriges första månadsutdelande ETF
-
 Nyheter4 veckor sedan
Varför investera i indexfonder?
-
 Nyheter1 vecka sedan
100 gånger pengarna, aktier som gör 10 000 kronor till 1 miljon
-
 Nyheter3 veckor sedan
Montrose lanserar Sveriges första månadsutdelande ETF
-
 Nyheter3 veckor sedan
BlackRock lanserar aktivt förvaltad Fixed Income UCITS ETF
-

 Nyheter2 veckor sedan
Investerarnas intresse kraftigt förändrat under februari 2025
-

 Nyheter4 veckor sedan
Sprotts Steve Schoffstall om kärnenergitrender, uranmarknaden och politiska effekter
-

 Nyheter3 veckor sedan
NATO-anpassade Future of Defense ETF når en miljard USD i AUM