
Nyheter
Rebalancing Markets Fuel Positive Sentiment for Hard Assets
3Q’16 Hard Assets Equities Strategy Review and Positioning Our hard assets equities strategy’s positions in Energy and Diversified Metals & Mining sectors were, in particular, significant contributors to positive performance. Within the Energy sector, positive performance stemmed mainly from the Oil & Gas Exploration & Production (E&P) sub-industry. The Oil & Gas Drilling sub-industry also made a useful contribution to performance during the quarter. By contrast, Oil & Gas Equipment & Services was the only energy sub-industry to detract from the strategy’s performance and its impact was relatively minimal. Other sub-industries that made positive contributions of note to performance were Copper and Coal & Consumable Fuels. During the quarter, the strategy continued to hold no position in Integrated Oil & Gas.
3Q Performance Contributors
The top performing company was major diversified mining company Glencore,1 which continued to benefit from debt reduction and overall restructuring initiatives that began in 2015. In the face of persistent skepticism from the market, Glencore has proved demonstrably that it has been able to provide a workable blueprint and subsequently execute its plan to deleverage its balance sheet and improve its cost structure. Not only has Glencore delivered (as we expected) thus far on what it said it would do, it continues to implement its debt reduction program. This has, in some instances, been in contrast with other major metal mining companies that, despite rhetoric to the contrary, have been slow to recognize the need for, or have been unsuccessful in, executing similar restructuring measures and have largely been playing ”catch up” with Glencore in the eyes of the market.
Rounding out the top 5 performing positions were E&P companies, Pioneer Natural Resources,2 Parsley Energy,3 and SM Energy.4 These companies benefited from the high quality of their assets and acreages, in particular those in the Permian Basin. The final top five contributing company for the quarter was metal mining company Teck Resources5 which benefited from strengthening zinc and coal prices.
3Q Performance Detractors
Over the past three years, global demand for coking coal has been relatively solid at an annual level of around 990 million tonnes (Mt). China is one of the most important consumers in terms of setting prices, since it accounts for approximately 60%, or 590Mt, of global coking coal demand. It is followed by Japan at 69Mt, India at 49Mt, and South Korea at 40Mt. Demand from the U.S. is for approximately 21Mt per annum.
In a reversal from the second quarter when gold was the strongest performing sub-industry, in the third quarter, gold was the largest detractor from Fund performance. Gold mining companies Barrick Gold,6 Goldcorp,7 and Randgold Resources8 all suffered from a consolidation in the gold price during the period, and by quarter end we had reduced our exposure to each. The two other poor performers during the quarter were E&P companies Hess,9 which had to contend with a dry hole in Guyana, and Gulfport Energy.10
Positive Market Sentiment and Demand for Commodities in 3Q
Despite the continuing uncertainties in the market surrounding the U.S. presidential elections, and in the face of moderating global GDP growth, sentiment was on the positive side and demand for commodities remained remarkably resilient. As in the second quarter of the year, the most significant macroeconomic factor influencing the hard assets strategy was the extraordinary monetary accommodation extended by central banks around the world, which continues to add support for economic growth and demand for commodities.
Gold Consolidated After 2Q Rally
After an explosive first half of the year, the gold market experienced significant consolidation during the third quarter and gold mining companies suffered. On a positive note, gold mining firms overall have been bolstered by restructuring and strategic improvements and appear well positioned to withstand a short-term decline in the gold price.
Global Demand for Crude Oil Remained Strong
Global demand for crude oil and, in particular, gasoline increased once again during the quarter. U.S. gasoline demand remains at record highs and the country is now consuming approximately 10 million barrels a day. The country’s gasoline demand continues to exceed the unrefined crude oil demand of every country in the world except China.
Supply disruptions with the potential to impact future production continued during the quarter including the lingering effects of attacks instigated by militant groups in Nigeria, an uncertain and confusing political situation in Libya, and a deteriorating economic and social environment in Venezuela, where production had fallen some 6% from approximately 2.35 million barrels a day (bbl/d) at the beginning of the year to approximately 2.2 million bbl/d by the end of the quarter. On a positive note, oil sands production in Canada was no longer affected by the wild fires that impeded second quarter production.
U.S. Oil Rig Count Rebounded Slightly
In the U.S., the rig count continued to rebound slightly and increase at a modest pace from previous trough levels. However, we continue to note and emphasize that any rebound remains very much incremental when compared with the nearly 1,300 rigs in the U.S. that were taken out of commission between 2014 and 2016.
Zinc and Coking Coal Excelled for Base/Industrial Metals
In the base metals space, zinc experienced further rebalancing of supply and demand. Fundamentals continued to tighten with a reduction in overall supply accompanied by solid demand (Read Zinc’s Year to Remember: A Supply-Side Story for details). Nickel markets erased losses from early in the quarter following the results of environmental mine audits in the Philippines in which three quarters of mines fell short, with 20 mines facing suspension, and an announcement by Indonesia that the ban on exports was being reconsidered. At the company level, restructuring continues. Balance sheet strengthening appears to be the primary objective with reducing operating costs a secondary focus. Additionally, we are just now starting to hear chatter from some companies about re-engaging growth projects.
By the end of the quarter, the prices of metallurgical coal (an essential steel-making raw material used to produce coke which, in turn, is used in the production of steel) had climbed more than 100% since the beginning of the year. The overwhelming driver behind this price recovery has been supply. In addition to both lower seaborne and domestic supply, global inventories are also at multi-year lows.
Deal Activity Dominated the Agriculture Sector
In the agriculture sector, the quarter was marked by two major deals and the potential for further consolidation in the potash market amid oversupply. U.S. agriculture giant, Monsanto, agreed to be bought by German giant Bayer11 while Canada’s Agrium12 and PotashCorp13 of Saskatchewan agreed to merge. In grains, an ideal growing season in the U.S. lead to close to record production in both corn and soybean.
Positive Outlook for Remainder of the Year
In the fourth quarter, we see the macro drivers continuing to be central bank policy and the ramifications of the forthcoming presidential election in the U.S. Broadly speaking, commodity demand has proven to be remarkably resilient. Despite concerns about global growth there is still firm demand and healthy consumption. On the supply side, we continue to see the effects from the lack of investment and capital expenditure reductions over the past several years.
OPEC Production Decision Puts Focus on Saudi Arabia and Iran
At the very end of the quarter, OPEC (Organization of the Petroleum Exporting Countries) came to an agreement to cap production. This move appears to us to indicate that Saudi Arabia and other OPEC members have reached their threshold of pain, which appears to be roughly in the $40 to $45 price-per-barrel range. Anything below that would probably only serve to consolidate and accelerate any decisions they might make as a group which indicates that, surprisingly, there may actually be a price floor.
Mainstream interpretation seems to be that the OPEC announcement is a reaction to $40 oil. Maybe it is, but we believe it could also be the excuse that Saudi Arabia has needed to allow it to force through some serious, and absolutely essential, economic restructuring. It now has the low price of oil to blame publicly.
Saudi Arabia is Worried About Oil Price Spike in Next 18 to 24 Months
We believe that the move by Saudi Arabia is a longer-term one and that, in particular, it demonstrates the country is also worried about a spike in oil prices in the next 18 to 24 months. Any such spike may: a) help Iran the most (something Saudi Arabia is not too keen on doing); b) eventually cause the price to plummet back down; and c) accelerate alternative energy use. Evidence of this can be seen in the press release issued by OPEC following its September meeting, in which it said that its objective was ”to stabilize the oil market and avoid the adverse impacts in the short- and medium-term.”
We also see this move as a way for Saudi Arabia to indicate to Iran that it is happy for the country to try and ramp up production from 3.6 million to 4 million barrels a day (something Iran is struggling to do as shown in Chart A) over the next four to five years. The Saudis are fully aware that this is extremely unlikely to happen any time soon as Iran has only hit the 4 million barrels per day figure three times since 1978.
Iranian Crude Oil Production
Monthly in Barrels: 12/31/79 to 9/30/16

(Click to enlarge) Source: Bloomberg. Data as of September 30, 2016.
While the focus is squarely on Saudi Arabia and Iran, among other OPEC nations, despite the political uncertainty in Libya mentioned earlier, there do appear to be some moves toward establishing some sort of unified government and we have seen the beginning of some flows of oil in the country.
We continue to point out that it is easy to fall into the trap of thinking that a simple increase in the current U.S. onshore oil rig count of approximately 400 rigs can restore the supply balance. But people forget that the U.S. rig count at its high numbered close to 1,700 in 2014 and that it has declined more than 75%, or 1,300 rigs, since then. It will take a considerable increase in the current rig count to bring back any growth in production.
In addition, people continue to miss the fact that conventional exploration has been abysmal (discoveries in 2015 were the lowest since 1947 as shown in Chart B), a point that was also hinted at in OPEC’s press release when it was stated that the ”Conference … noted that world oil demand remains robust, while the prospects of future supplies are being negatively impacted by deep cuts in investments and massive layoffs.”
Conventional Oil Discoveries Are in Decline
Yearly in Barrels: 1947 to 2016

(Click to enlarge) Source: Wood Mackenzie; Bloomberg. Data as of August 31, 2016.
U.S. Shale Oil Production Will Need Time to Ramp Back Up
As usual, during the quarter we made a number of trips outside the U.S. and met with many prospective and existing clients. During our visits we noted a recurrent theme of strong skepticism around the rebalancing of commodity markets and, in particular, oil. We believe that much of this has been fueled by headlines that trumpet Saudi and Russian oil production reaching all-time highs, and talk of the strength of the rebound in the oil rig count in the U.S.
People seem to truly believe that shale oil is a spigot that can just be turned on and off at will, and there continues to be a misplaced belief that higher oil prices will reinvigorate shale drilling to the point where it starts to raise production and ”unbalance” the fundamentals. We do not believe this to be the case and, in our view, any increase in U.S. production must be preceded by a dramatic increase in the rig count which will require significantly higher crude prices.
POST DISCLOSURE
1 Glencore represented 4.05% of Fund net assets as of 9/30/16.
2 Pioneer Natural Resources represented 3.98% of Fund net assets as of 9/30/16.
3 Parsley Energy represented 3.92% of Fund net assets as of 9/30/16.
4 SM Energy represented 2.42% of Fund net assets as of 9/30/16.
5 Teck Resources represented 3.20% of Fund net assets as of 9/30/16.
6 Barrick Gold represented 1.48% of Fund net assets as of 9/30/16.
7 Goldcorp represented 2.29% of Fund net assets as of 9/30/16.
8 Randgold Resources represented 2.25% of Fund net assets as of 9/30/16.
9 Hess represented 2.04% of Fund net assets as of 9/30/16.
10 Gulfport Energy represented 2.05% of Fund net assets as of 9/30/16.
11 Bayer represented 0.00% of Fund net assets as of 9/30/16.
12 Agrium represented 1.84% of Fund net assets as of 9/30/16.
13 PotashCorp represented 0.00% of Fund net assets as of 9/30/16.

by Shawn Reynolds, Portfolio Manager
Reynolds has more than 30 years of experience covering the energy sector. Before his career in finance, Reynolds worked as an exploration geologist and earned degrees in geology and engineering.


Like Bitcoin, Dogecoin uses a proof-of-work (PoW) consensus mechanism but runs on its own blockchain, originally forked from Litecoin. It uses the Scrypt hashing algorithm, which is less resource-intensive than Bitcoin’s SHA-256, making mining more accessible to everyday users with consumer-grade hardware. Due to merged mining with Litecoin, Dogecoin benefits from shared infrastructure, with hashpower recently reaching all-time highs of 2.7 petahashes (quadrillion hashes) per second, making the network increasingly difficult to attack.
Dogecoin’s design is built for speed and utility, has no maximum supply, and confirms blocks every minute (10x faster than Bitcoin). Moreover, it maintains ultra-low transaction fees, which is ideal for tipping, microtransactions, and everyday use.
More than a meme
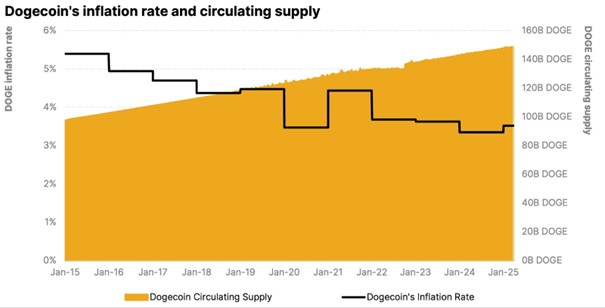
Although its supply is technically unlimited, Dogecoin’s issuance model is clear and predictable. Approximately 10,000 DOGE are mined every minute, adding up to around 5.25 billion new tokens each year. As the supply base expands, this fixed issuance creates a natural disinflationary trend that has cut nearly in half over the past decade while ensuring network security through consistent miner rewards.
Dogecoin’s technology fosters an aligned ecosystem between users and miners. With sustainable economic incentives, it acts as a kind of “retail Bitcoin”, built not just for hoarding but for real-world use, too.
While Dogecoin began as a lighthearted experiment, its evolution has proven it to be far more than a meme. Thanks to its speed, low fees, and strong community backing, Dogecoin has grown into a functional digital currency with a range of real-world use cases. From payments and merchant adoption to infrastructure development and charitable giving, Dogecoin continues to demonstrate its staying power as a practical and accessible tool in the broader crypto ecosystem.
Dogecoin as a payment tool
Dogecoin has transformed into a widely accepted digital currency, embraced by major brands like Tesla, AMC, Newegg, and the Dallas Mavericks. With fast transaction speeds and low fees, even amid surging transaction volumes, it has become a practical option for everyday payments. Crypto payment processors like BitPay have further expanded its reach, enabling thousands of merchants worldwide to accept DOGE. Most recently, The Open House Group, a prominent Tokyo Stock Exchange-listed real estate firm, added Dogecoin to its supported list, making it one of the few digital assets accepted for property transactions.
Enhancing Dogecoin’s payment infrastructure
Initiatives like Dogebox and GigaWallet are simplifying DOGE integration for businesses, while its scaling solution, Laika, is making meaningful progress in improving transaction speed and reducing costs.
Meanwhile, RadioDoge is working to expand access by enabling offline transactions in remote regions through low-cost radio and Starlink technology, advancing global crypto inclusion. A rumored integration with Elon Musk’s X platform could extend Dogecoin’s utility across digital tipping and commerce. These efforts collectively reinforce Dogecoin’s growing relevance in real-world payments and its potential as a frictionless, decentralized transaction layer.
Do Only Good Every Day
As we’ve seen, community drives memecoins, and Dogecoin’s community shines the brightest. This global network not only thrives on memes but also channels that energy into social good. From funding clean water in Kenya to sending Jamaica’s Bobsled Team to the Olympics and raising over $1 million for Ukraine relief, DOGE’s community transforms internet culture into real-world impact. Low fees and fast transactions make it a favorite for grassroots giving, showing a coin born as a joke can leave a lasting legacy. Dogecoin is more than a digital asset—it’s a movement powered by a community that believes in doing good every day.
Research Newsletter
Each week the 21Shares Research team will publish our data-driven insights into the crypto asset world through this newsletter. Please direct any comments, questions, and words of feedback to research@21shares.com
Disclaimer
The information provided does not constitute a prospectus or other offering material and does not contain or constitute an offer to sell or a solicitation of any offer to buy securities in any jurisdiction. Some of the information published herein may contain forward-looking statements. Readers are cautioned that any such forward-looking statements are not guarantees of future performance and involve risks and uncertainties and that actual results may differ materially from those in the forward-looking statements as a result of various factors. The information contained herein may not be considered as economic, legal, tax or other advice and users are cautioned to base investment decisions or other decisions solely on the content hereof.


Börshandlade fonder för den som vill investera i skogen

EDOG ETF med fokus på telemedicin och digital hälsa
The Dogecoin story: The emerging “intrinsic value”

JCLU ETF är en högkvalitativ aktiv europeisk CLO-ETF

SAVR erbjuder nu handel i mer än 700 polska aktier
Crypto Market Risks & Opportunities: Insights on Bybit Hack, Bitcoin, and Institutional Adoption

Montrose storsatsning på ETFer fortsätter – lanserar Sveriges första globala ETF med hävstång

Svenskarna har en ny favorit-ETF

MONTLEV, Sveriges första globala ETF med hävstång

Sju börshandlade fonder som investerar i försvarssektorn
-

 Nyheter4 veckor sedan
Crypto Market Risks & Opportunities: Insights on Bybit Hack, Bitcoin, and Institutional Adoption
-
 Nyheter3 veckor sedan
Montrose storsatsning på ETFer fortsätter – lanserar Sveriges första globala ETF med hävstång
-
 Nyheter4 veckor sedan
Svenskarna har en ny favorit-ETF
-
 Nyheter3 veckor sedan
MONTLEV, Sveriges första globala ETF med hävstång
-
 Nyheter3 veckor sedan
Sju börshandlade fonder som investerar i försvarssektorn
-

 Nyheter3 veckor sedan
Världens första europeiska försvars-ETF från ett europeiskt ETF-företag lanseras på Xetra och Euronext Paris
-

 Nyheter3 veckor sedan
Europeisk försvarsutgiftsboom: Viktiga investeringsmöjligheter mitt i globala förändringar
-

 Nyheter3 veckor sedan
21Shares bildar exklusivt partnerskap med House of Doge för att lansera Dogecoin ETP i Europa