
Nyheter
Primer: Bitcoin, An Emerging Store of Value Asset
This research primer acts as a guide for investors to understand Bitcoin fundamentally. You will learn how the technology works, discover the current and future state of Bitcoin, the different ways to value the asset, and finally assess the various associated risks.
Bitcoin is an emerging store of value asset often called the world’s first “digital gold” and may provide a viable hedge against global economic instability. Over the last three years, Bitcoin surged by over 120%, making it one of the best-performing assets over the last decade. Currently, Bitcoin’s total market capitalization sits at over $540 billion. The rest of this report will also show that there is still a potential upside for Bitcoin and its technology in the foreseeable future. The first table (below) shows some of the current key metrics for Bitcoin, including its price, circulating supply (the number of BTC currently in existence), and market capitalization. The second table demonstrates where Bitcoin sits in the asset superclass amongst equities, commodities, real estate, and other asset classes.
Table 1: Bitcoin Key Metrics
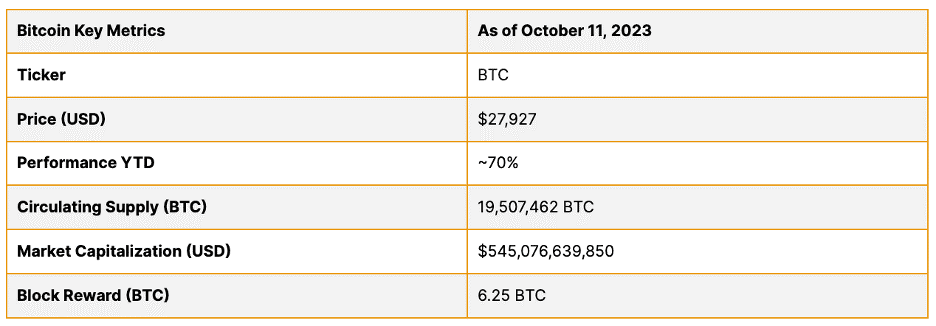
Source: CoinGecko
Figure 1: Asset Superclasses

Source: 21Shares
How Bitcoin Works
So you may be wondering: how exactly does Bitcoin work? The key innovation of Bitcoin is that it allows for peer-to-peer and decentralized transactions on the internet. This is facilitated by two inventions: the ledger or its blockchain acting as the asset’s balance sheet and its security and verification mechanism called Proof of Work mining.
The Bitcoin Blockchain
A blockchain is a data structure — in the same way an Excel sheet is a data structure — which holds a growing list of records, called blocks, which are linked to each other through the use of cryptography. Within a blockchain, each block is ordered in a sequence, and each contains encoded information about its predecessor (a hash), the date and time at which it was created, and data about the transactions included in it. Every transaction that has settled on the Bitcoin network is contained within a particular block of transactions.
Blockchains are helpful for storing sensitive data for which one needs strong assurance, such as security, safety, and integrity. Typically, blockchains are stored on a network of users across the internet who each keep a version of the Bitcoin blockchain. Once data has been recorded onto a blockchain, the block cannot be altered retroactively without changing all subsequent blocks – this is only possible if the majority of the network agrees.
Proof of Work Mining
Proof of Work (PoW) mining is the process that allows new transactions and blocks to be added to the Bitcoin blockchain. It is also the method through which new Bitcoin enters the money supply. Proof of Work is similar in abstract to the process of gold mining. Stakeholders (called “miners”) use specialized supercomputers to process an algorithm that creates a piece of data called a proof of work. A proof of work is, by definition, difficult to solve and requires extensive computing power, capital investment, and energy to find. Once a miner finds a solution, it is very easy for others in the Bitcoin network to verify. The Bitcoin network is designed so miners only solve a proof of work on average every 10 minutes and are rewarded for their efforts through newly-issued Bitcoin, currently at an amount of 6.25 BTC per block or approximately $218,750. Bitcoin’s monetary policy has a limit of 21 million BTC. To reach this amount, every 4 years the new emission of Bitcoin happening each 10 minutes programmatically decreases by half, called the Halving. The use of mining makes it extremely hard for Bitcoin’s transactions to be manipulated, as a malicious actor would have to expend a large sum of capital and energy to do so. The diagram below (Fig. 2) shows an illustration of a blockchain where the black blocks represent the path of the blockchain that all miners and nodes in the Bitcoin network agree on. If miners or nodes disagree on a specific blockchain, it is discarded — as demonstrated by the yellow blocks.
Figure 2: A simplified illustration of a blockchain
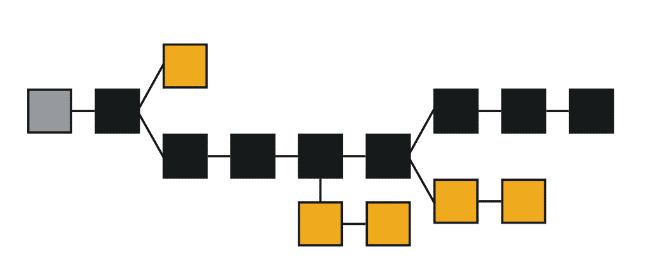
Source: 21Shares
The State of Bitcoin
Since its launch on January 3, 2009, Bitcoin has grown into an asset with a market capitalization of over $540 billion and created an entire asset class, cryptoassets, with a cumulative market capitalization of over $1 trillion. We believe Bitcoin represents a paradigm shift in finance by being the peer-to-peer, decentralized asset class and history’s first digital gold. This claim is justified given that Bitcoin has a fixed and programmatic maximum supply of 21 million ending in 2140— making it an incredibly scarce asset. In recent years, Bitcoin has matured as an investment product and become increasingly institutionalized. The chart below shows how Bitcoin’s supply follows a predictable and trackable schedule as it reaches the 21 million limit. As mentioned, the current block reward amounts to 6.25 BTC, which will be reduced by 50% during Bitcoin’s upcoming halving, which will most likely take place at the end of Q1 or beginning of Q2 2024.
Aside from the adoption side, Bitcoin also has a thriving technological and developer community that will continue to expand the technical tools to interact with the Bitcoin network — making it easier, for example, to self-custody one’s assets, transact at a low cost, or understand Bitcoin’s blockchain data.
Figure 3: Bitcoin projected supply and monetary inflation
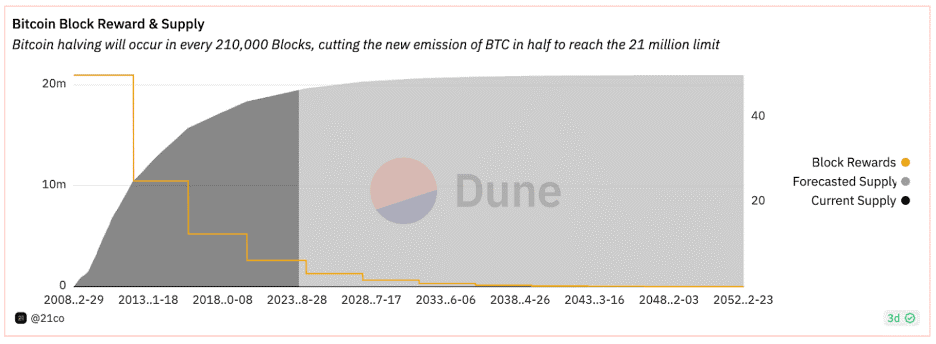
Source: 21.co (Parent company of 21Shares)
The Future of Bitcoin – Bitcoin as a tech investment
Part of the appeal of Bitcoin is its yet unrealized potential, whether it be technical developments that enable a deeper range of types of transactions and ways to improve transaction speeds or innovation in the blockchain infrastructure. Several interesting product developments within Bitcoin include the emergence of several promising scaling solutions (Layer 2s)): The Lightning Network — a protocol that exists on top of Bitcoin as a potential way to improve scalability; Rootstock and Stacks — smart contract platforms built on Bitcoin allowing more complex transactions; and Ordinals Inscriptions — similar to NFTs, a way to inscribe digital content on the Bitcoin blockchain.
In addition, Bitcoin is gearing up to rival Ethereum as a settlement platform for stablecoins and real-world assets, thanks to the Lightning Lab’s taproot upgrade. This enables developers to create and oversee a wider array of assets on Bitcoin, with over 2,000 tokens already minted on the testnet, demonstrating the demand for assets issued on the network while helping BTC to serve as a medium of exchange. Additionally, experimental initiatives such as Bitcoin VM and Bitcoin Spiderchains are in the works, aiming to expand on Bitcoin’s capabilities by offering scaling solutions that don’t require modifying the Bitcoin base code itself. Their impact, however, remains uncertain, given their early developmental stages.
In addition, Bitcoin has played a crucial role in the formation of a range of other cryptoassets — known as “forks” — which either have been inspired by Bitcoin’s technical infrastructure (see Fig. 4) or have borrowed heavily from the software that makes Bitcoin work. This allows for innovation from Bitcoin to spread to the rest of the industry and is a key factor behind the cryptoasset industry’s high level of innovation.
Figure 4: History of Bitcoin forks
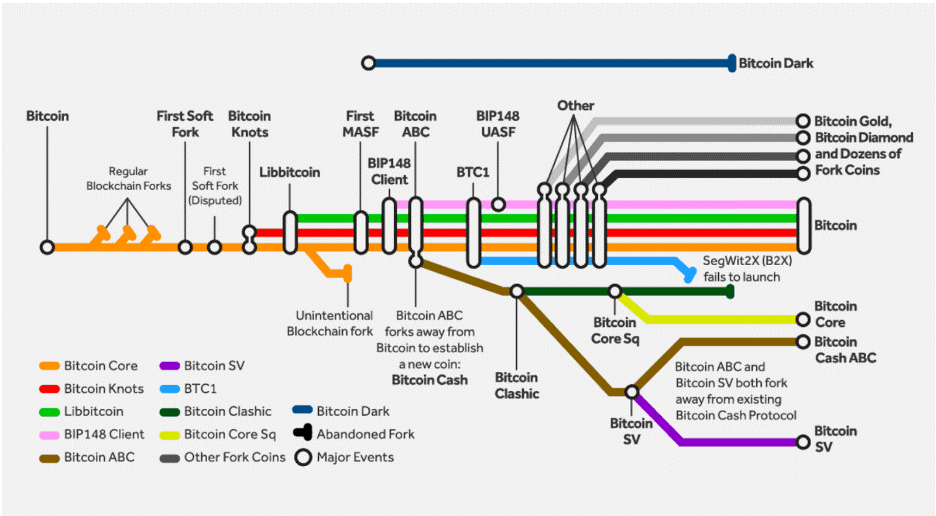
Source: Bitcoin Magazine
Valuing Bitcoin
Figure 5: Asset Superclasses
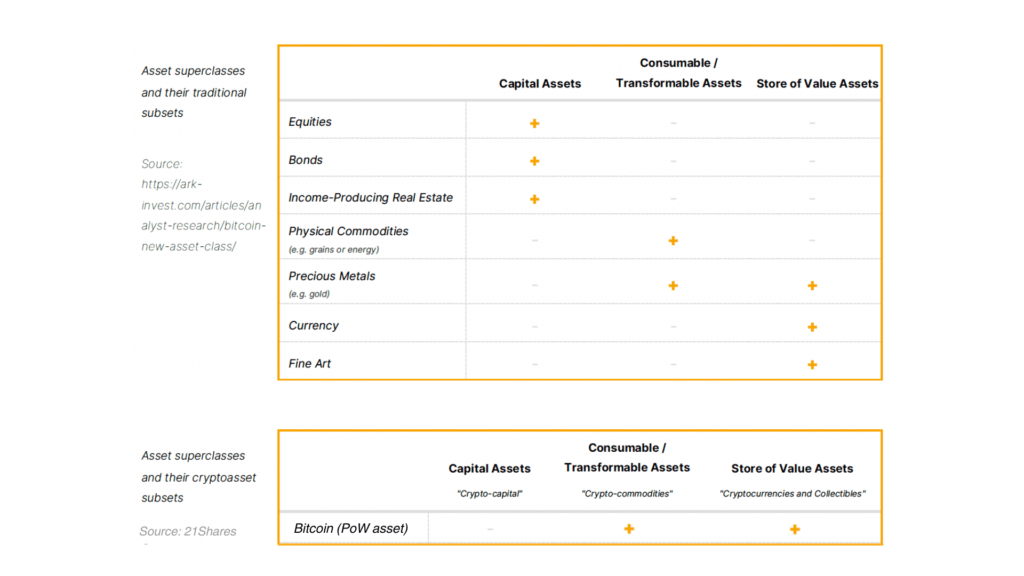
Source: 21Shares
As mentioned previously, Bitcoin relies on a computationally and energy-intensive lottery called mining to verify, settle transactions, and secure the network. The native asset of a PoW network like Bitcoin is not one of the inputs of production but the mere output of it. Hence, we refer to PoW cryptoassets as ”crypto-commodities.” In addition, due to its programmed scarcity, Bitcoin has consolidated as an emerging store-of-value asset. Thus, similar to gold, Bitcoin is both a consumable and store-of-value asset in the asset superclass classification.
Market Sizing
Bitcoin’s primary value proposition comes from its ability to act as a Store of Value. Therefore, the most accurate way to understand Bitcoin’s potential value in the long term is by doing a market sizing analysis. Thus, we can utilize a simple market sizing approach to estimate a target price. The methodology involves establishing a Total Addressable Market (TAM) and a percent share the asset in question could take — Market Penetration. For instance, an investor could price Bitcoin by setting a proportion it could capture of the market value of gold, the seminal store-of-value asset.
As of September 30, the price of BTC is $26,970, with an implied circulating market cap of ~$526 billion. On the other hand, the market cap of gold sits at around $12.12 trillion. Thus, we can use the market sizing methodology described above to estimate the hypothetical price of BTC if it were to capture a given percent share of gold’s market cap. For instance, Figure 4 shows that if BTC were to capture 10%, it would be priced at $59,908. In the most optimistic scenario contemplated, if BTC penetrates 30% of gold’s market cap, the price of one BTC would be $179,724.
Figure 6: BTC market sizing analysis
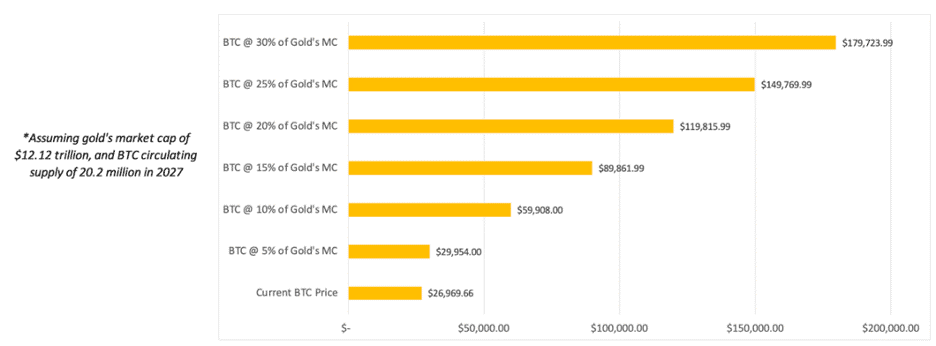
Source: 21Shares, Data as of September 30, 2023
Cost of Production (Bitcoin’s intrinsic value)
When it comes to crypto-commodities, the marginal cost of production is vital as it sets the price floor at which producers (miners) are willing to sell. From the outset, it is crucial to emphasize that we are not suggesting that the price of BTC should be determined by its marginal cost of production. To do so would be to adopt a labor theory of value, which is ostensibly false. Instead, the marginal cost of production is a tool that can help investors estimate a lower bound price level for BTC and other crypto-commodities.
In 2019, Charles Edwards proposed a methodology to estimate the global average US dollar cost of producing one BTC. The first component of the method is the Cambridge Bitcoin Electricity Consumption Index (CBECI), which provides an up-to-date estimate of the Bitcoin network’s daily electricity load. Edwards estimates the cost of production per BTC by:
- Calculating the number of BTC Mined Per Day (based on miner rewards)
- Calculating the daily electricity cost to mine one BTC (Daily Electrical Cost)
- Estimating the global average “Elec-to-Total Cost Ratio” = (Bitcoin Electrical Cost) / (Daily Cost of running a Bitcoin Mining Business)
An investor can then compute Bitcoin Production Cost as (Daily Electrical Cost) / (Elec-to-Total Cost Ratio). Finally, the Bitcoin Production Cost is compared to the “Bitcoin Miner Price,” which attempts to capture the revenue one BTC provides to miners. Bitcoin Miner Price is calculated as follows: BTC Price + (Daily Transaction Fees) / (Daily BTC mined). When the BTC price is below the total cost of mining one BTC, it signals that Bitcoin miners may be struggling and potentially taking short-term losses.
Figure 7: Bitcoin mining cost of production
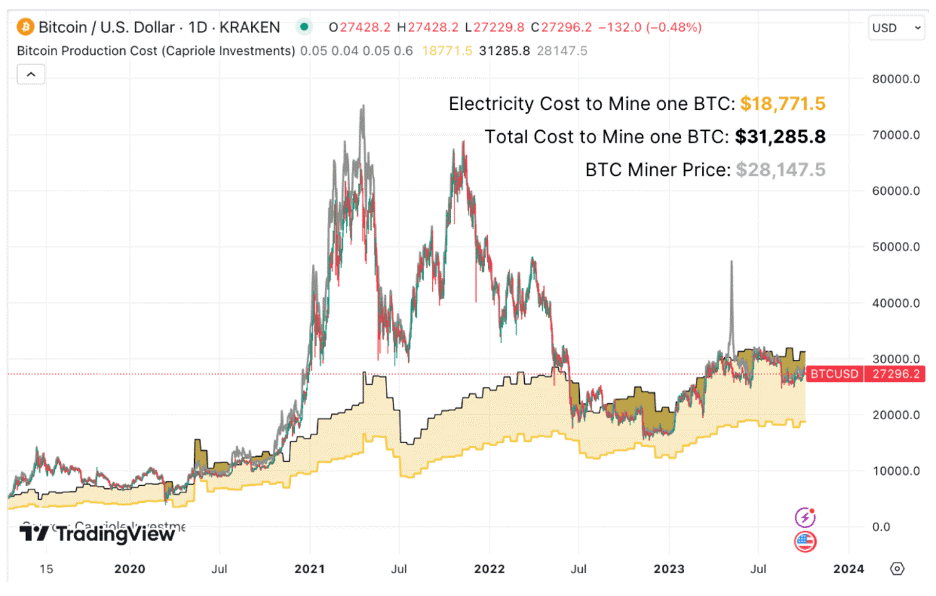
Source: 21Shares, data as of September 30, 2023.
As of September 30, 2023, the estimated global average electricity cost to mine one BTC is $18,771.5, while the estimated global average total cost to mine one BTC is $31,285.8. To reiterate, investors shouldn’t interpret this range as the fundamental value of Bitcoin, which is subjective, but rather as an estimate of its price floor based on miner profitability and subsequent behavior patterns.
If you’re interested in delving deeper into the world of Bitcoin within a portfolio context and exploring optimal portfolio allocation strategies, we invite you to explore the latest iteration of our comprehensive Portfolio Allocation Primer: Link
Risks
Economic Risk
Bitcoin halvings and reduced block rewards can be considered a double-edged sword. While it usually creates a supply shock leading to new all-time highs post-halving, it also is one of the most significant risks to Bitcoin’s long-term success. Bitcoin miners generate revenue through transaction fees and newly-issued Bitcoin (i.e., the block reward). However, as this block reward decreases over time, miners will be compensated only via transaction fees eventually. Some research shows potential issues with a regime in which block rewards for miners are continually halved. For example, the amount miners receive in transaction fees alone may not be enough, or variability in transaction fees could lead to perverse incentives for miners, such as an increased probability of attempts to reverse transactions through “51% attacks.” Both scenarios could harm Bitcoin’s economic security. However, new innovations emerging on top of Bitcoin, as discussed in this paper, could potentially create sustainable incentives for miners and ensure the longevity of the network’s security. In conclusion, Bitcoin’s block reward halving is a long-term threat to the network’s security, although there are several viable ways to solve the problem going forward.
Environmental Risk
Proof of Work mining is an extremely energy-intensive process that can require miners to be willing to pay up to the current price of Bitcoin in marginal costs to mine a single Bitcoin. The University of Cambridge Centre for Alternative Finance estimates that Bitcoin currently consumes 55.33 Terawatt Hours of energy per year and will only increase as the network continues to grow. We agree that the energy consumption of the Bitcoin network is likely to continue to increase as the mining industry continues to professionalize and as the popularity of the Bitcoin network increases. It is unknown precisely what the energy mix of Bitcoin mining is. Still, one can assume that at least some amount of Bitcoin mining is powered by non-renewable energy sources — meaning that Bitcoin mining may contribute to exacerbating current issues associated with the climate crisis. While it is difficult to verify such numbers, there is no doubt that a large amount of Bitcoin mining is powered by renewable energy. Despite this fact, the mainstream perception is that Bitcoin mining is an unnecessarily energy-intensive process. As policy action around the climate crisis intensifies, there remains the possibility that there could be a regulatory crackdown on Bitcoin predicated on a pro-climate agenda. Researchers in the industry can mitigate the risks of such a scenario by making a concerted effort to prove that Bitcoin mining relies heavily on renewable energy and find ways to reduce its reliance on fossil fuels. Moreover, miners must exercise strategic discernment when selecting their operational bases, considering factors such as operational expenses (including electricity and rent) and geographical vulnerability to environmental hazards like hurricanes and power outages.
Geopolitical Risk
Different countries have adopted various stances toward Bitcoin and cryptoassets. Some have embraced them, while others have imposed strict regulations or outright bans. The best example would be China’s ban on crypto mining in 2021. Even though miners migrated abroad, this regulatory uncertainty can create challenges for individuals and businesses involved in the Bitcoin ecosystem, leading to legal and compliance risks. Additionally, Bitcoin’s global nature makes it sensitive to geopolitical tensions and conflicts. Governments may view Bitcoin as a way to circumvent economic sanctions or capital controls, leading to further regulatory crackdowns and attempts to control its use.
Technology Risk
Bitcoin, like any technology, is not immune to vulnerabilities. For example, as technological progress marches forward, there’s a growing concern about the potential risks posed by quantum computing. Quantum computers, if developed sufficiently, could pose a fundamental threat to Bitcoin’s cryptographic security. This risk requires ongoing research and the development of quantum-resistant cryptographic algorithms. Moreover, as any computer code they are susceptible to potential bugs.
A prime illustration of this is CVE-2018-17144, a code vulnerability that was discovered in 2018, that had the potential to permit an attacker to double-spend bitcoins. Although this bug was never exploited on the Bitcoin mainnet, and a substantial majority of full nodes promptly upgraded to Bitcoin Core versions unaffected by it, it underscores the importance of acknowledging and addressing such risks. Furthermore, in October 2023, the Bitcoin Lightning Network encountered a novel vulnerability, which could potentially empower an attacker to steal funds from Lightning Network channels by exploiting Hash Time Lock Contracts. These contracts serve as a crucial foundation facilitating payment exchanges between counterparties without necessitating trust. Subsequently, a series of interim patches has been introduced to rectify this issue.
To mitigate these technological risks, the Bitcoin community relies on continuous development, peer review of code changes, and a commitment to maintaining the network’s decentralization and security. Participants in the Bitcoin ecosystem, including miners, developers, and users, must stay informed and adapt to evolving technological challenges to ensure the network’s robustness and resilience.
Disclaimer
All content provided by 21Shares is intended for informational and educational purposes only and should not be considered investment advice or a recommendation to buy, sell, or hold any particular security.
Investments associated with crypto assets, such as cryptocurrencies and crypto tokens, involve risk. These assets are considered highly speculative due to their limited history and new technological nature. Future regulatory actions may impact the usability and tradability of crypto assets. The price of crypto assets can be influenced by a small number of holders and may decline in popularity or acceptance, affecting their value.
For full disclosures, please visit our Disclaimers and Terms & Conditions pages.


The investment environment in 2025 has been marked by increased uncertainty, including evolving trade dynamics involving the U.S. and rising geopolitical risks, which have weighed on overall market sentiment. Notably, though, gold has shone, surging past the symbolic $3,100 per ounce mark for the first time in history.
Gold has recently gained attention as investors seek potential hedges against rising inflation, currency fluctuations, and broader market volatility. Historical data suggests that both gold and gold mining equities have sometimes outperformed during periods of market stress, though such outcomes are not guaranteed and may vary depending on broader macroeconomic dynamics. The chart below displays historical episodes where gold and gold mining equities experienced relative strength during market corrections. However, such past performance should not be interpreted as a reliable indicator of future results.
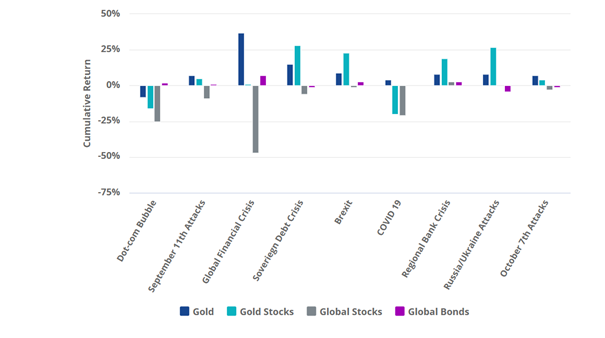
Source: VanEck, World Gold Council.
The early months of 2025 have seen a resurgence in gold mining stock interest, with the VanEck Gold Miners ETF (GDX) receiving significant capital inflows. These flows reflect changing investor sentiment but should not be viewed as a guarantee of future returns.
Improved management
While gold mining stocks are a play on the gold price, they are much more than that. In the past, gold mining companies indulged in wanton value destruction. During gold’s last bull market that ended in 2011, mining companies borrowed heavily to fund new developments and extract gold from low quality mines. After the gold price dropped, they were forced to announce write-downs.
But since then, they have learned to keep costs under control. Indeed, for more than 10 years gold mining companies’ costs have grown by far less than a gold price that’s at least doubled. Despite the sharp rise in gold prices, especially in post 2020, miners have lagged significantly, likely reflecting ongoing capital and operating challenges noted between 2011 and 2015. This divergence may suggest a potential value opportunity if mining equities eventually re-rate closer to gold’s performance. Nevertheless, this is an assumption and may not turn out to be true, as structural issues or market dynamics could continue to weigh on miners’ valuations.
Gold Miner Premium/Discount to Gold
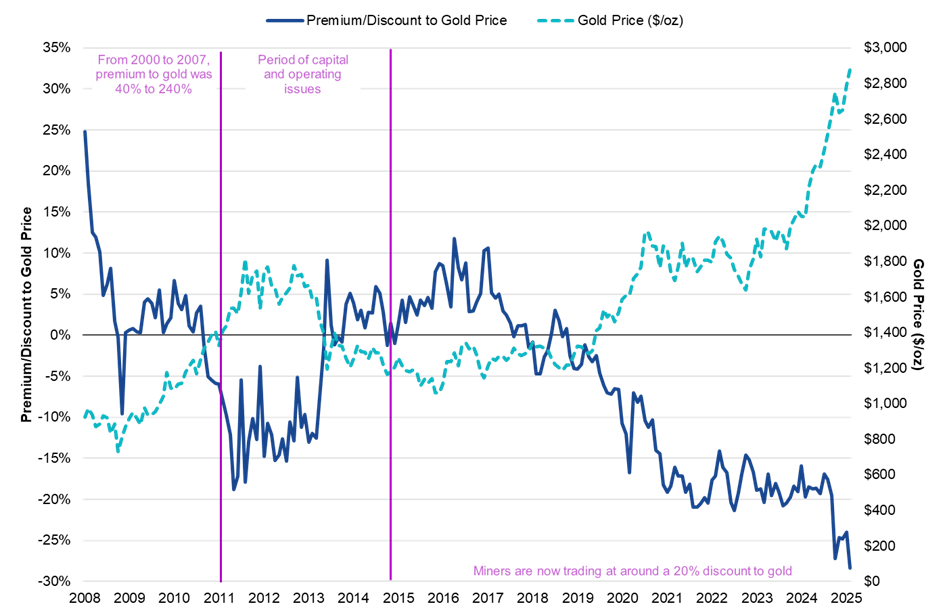
Source: Scotiabank. Data as February 2025.
Gold miners are expanding their profit margins, generating cash and embarking on share buy backs. What’s more, many have strong balance sheets. Yet still they trade at valuations below historical averages. Valuation metrics such as price-to-free cash flow (P/FCF) and price-to-earnings (P/E) ratios remain below the 12-month moving average.
Valuations are Still Below Long-Term Averages
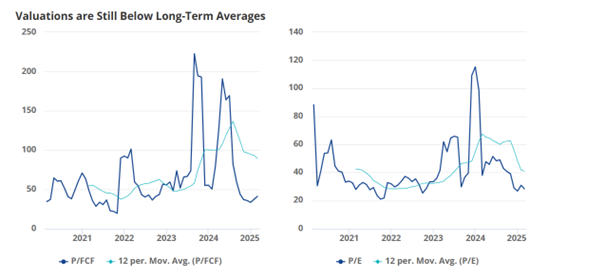
Source: Morningstar data.
Gold miners differentiate from gold because they are operating businesses influenced by company-specific factors such as management decisions, production efficiency, regulatory environments, and geopolitical risks. While gold is a passive asset driven by macroeconomic trends, miners add an additional layer of exposure to operational performance and cost structures.
A supportive macro backdrop
The performance of gold mining stocks is naturally influenced by the trajectory of gold prices. From a macroeconomic standpoint, factors such as inflation concerns and central bank policies continue to shape a cautiously optimistic outlook for gold, although the asset remains subject to volatility. Central banks continue to be net buyers, with 2023 marking a record year in terms of official sector demand. This trend has extended into 2024 and early 2025, underscoring institutional confidence in gold as a long-term store of value.
At the same time, the unfolding trade war is contributing to a more volatile global environment. These developments could support the case for gold and, by extension, gold mining equities. Moreover, recent efforts to improve transparency around global gold reserves, including audits of holdings in Fort Knox and London, have added credibility to the market, potentially reducing the perceived risk premium for miners.
Valuable portfolio diversification
From an investor’s perspective, gold mining stocks can be a useful diversifier in a broader equity portfolio, especially at a time of uncertainty for equity markets. Historically, gold mining stocks have exhibited a high sensitivity to changes in the price of gold, sometimes outperforming the metal itself during prolonged bull markets. However, they also tend to underperform during downturns, reflecting their leveraged exposure to gold price movements. Past performance is not indicative of future results. The table below shows the low correlation of the two VanEck gold miners UCITS ETFs with the MSCI World Index of global stock prices. This low correlation suggests that gold mining ETFs may perform differently than global equities, potentially helping to reduce overall portfolio volatility during periods of market stress. That said, they also carry equity-like risks, and investors should assess their portfolio objectives and risk tolerance accordingly.
Low Price Correlations with Stocks
| Investment | MSCI World | Gold Price | VanEck Junior Gold Miners ETF | VanEck Gold Miners ETF |
| MSCI World | 1.00 | |||
| Gold Price | 0.10 | 1.00 | ||
| VanEck Junior Gold Miners ETF | 0.38 | 0.76 | 1.00 | |
| VanEck Gold Miners ETF | 0.31 | 0.81 | 0.96 | 1.00 |
Source: Morningstar data.
A better way to play the rally?
When the VanEck Gold Miners UCITS ETF was introduced in 2015, it aimed to provide investors with a way to gain diversified exposure to gold mining equities. Early performance was tempered by concerns related to past capital discipline within the sector. Recent inflows into ETF may reflect renewed investor interest, although sentiment toward mining equities can remain sensitive to market and operational developments.
As gold glitters at a time of market volatility, there are good reasons to think gold miners may be a better way to play the rally. It should however be noted that while gold prices and mining companies are closely linked, investing in miners introduces additional layers of risk and complexity and investors should consider all the risk factors before investing.
IMPORTANT INFORMATION
This is marketing communication. Please refer to the prospectus of the UCITS and to the KID/KIID before making any final investment decisions. These documents are available in English and the KIDs/KIIDs in local languages and can be obtained free of charge at www.vaneck.com, from VanEck Asset Management B.V. (the “Management Company”) or, where applicable, from the relevant appointed facility agent for your country.
For investors in Switzerland: VanEck Switzerland AG, with registered office in Genferstrasse 21, 8002 Zurich, Switzerland, has been appointed as distributor of VanEck´s products in Switzerland by the Management Company. A copy of the latest prospectus, the Articles, the Key Information Document, the annual report and semi-annual report can be found on our website www.vaneck.com or can be obtained free of charge from the representative in Switzerland: Zeidler Regulatory Services (Switzerland) AG, Neudtadtgasse 1a, 8400 Winterthur, Switzerland. Swiss paying agent: Helvetische Bank AG, Seefeldstrasse 215, CH-8008 Zürich.
For investors in the UK: This is a marketing communication targeted to FCA regulated financial intermediaries. Retail clients should not rely on any of the information provided and should seek assistance from an IFA for all investment guidance and advice. VanEck Securities UK Limited (FRN: 1002854) is an Appointed Representative of Sturgeon Ventures LLP (FRN: 452811), which is authorised and regulated by the Financial Conduct Authority (FCA) in the UK, to distribute VanEck´s products to FCA regulated firms such as Independent Financial Advisors (IFAs) and Wealth Managers.
This information originates from VanEck (Europe) GmbH, which is authorized as an EEA investment firm under MiFID under the Markets in Financial Instruments Directive (“MiFiD). VanEck (Europe) GmbH has its registered address at Kreuznacher Str. 30, 60486 Frankfurt, Germany, and has been appointed as distributor of VanEck products in Europe by the Management Company. The Management Company is incorporated under Dutch law and registered with the Dutch Authority for the Financial Markets (AFM).
”The MSCI information may only be used for your internal use, may not be reproduced or redisseminated in any form and may not be used as a basis for or a component of any financial instruments or products or indices. None of the MSCI information is intended to constitute investment advice or a recommendation to make (or refrain from making) any kind of investment decision and may not be relied on as such. Historical data and analysis should not be taken as an indication or guarantee of any future performance analysis, forecast or prediction. The MSCI information is provided on an “as is” basis and the user of this information assumes the entire risk for any use made of this information. MSCI, each of its affiliates and each other person involved in or related to compiling, computing or creating any MSCI information (collectively, the “MSCI Parties”), expressly disclaims all warranties (including, without limitation, any warranties of originality, accuracy, completeness, timeliness, noninfringement, merchantability and fitness for a particular purpose) with respect to this information. Without limiting any of the foregoing, in no event shall any MSCI Party have any liability for any direct, indirect, special, incidental, punitive, consequential (including, without limitation, lost profits) or any other damages. It is not possible to invest directly in an index.”
This material is only intended for general and preliminary information and shall not be construed as investment, legal or tax advice. VanEck (Europe) GmbH and its associated and affiliated companies (together “VanEck”) assume no liability with regards to any investment, divestment or retention decision on the basis of this information. The views and opinions expressed are those of the author(s) but not necessarily those of VanEck. Opinions are current as of the publication date and are subject to change with market conditions. Information provided by third party sources is believed to be reliable and have not been independently verified for accuracy or completeness and cannot be guaranteed.
VanEck Gold Miners UCITS ETF (the ”ETF”) is a sub-fund of VanEck UCITS ETFs plc, an open-ended variable capital umbrella investment company with limited liability between sub-funds. The ETF is registered with the Central Bank of Ireland, passively managed and tracks an equity index. Investing in the ETF should be interpreted as acquiring shares of the ETF and not the underlying assets.
VanEck Junior Gold Miners UCITS ETF (the ”ETF”) is a sub-fund of VanEck UCITS ETFs plc, an open-ended variable capital umbrella investment company with limited liability between sub-funds. The ETF is registered with the Central Bank of Ireland, passively managed and tracks an equity index. Investing in the ETF should be interpreted as acquiring shares of the ETF and not the underlying assets.
Investing is subject to risk, including the possible loss of principal. Investors must buy and sell units of the UCITS on the secondary market via a an intermediary (e.g. a broker) and cannot usually be sold directly back to the UCITS. Brokerage fees may incur. The buying price may exceed, or the selling price may be lower than the current net asset value. The indicative net asset value (iNAV) of the UCITS is available on Bloomberg. The Management Company may terminate the marketing of the UCITS in one or more jurisdictions. The summary of the investor rights is available in English at: complaints-procedure.pdf (vaneck.com). For any unfamiliar technical terms, please refer to ETF Glossary | VanEck.
No part of this material may be reproduced in any form, or referred to in any other publication, without express written permission of VanEck.
© VanEck (Europe) GmbH ©VanEck Switzerland AG © VanEck Securities UK Limited


8RMY ETF köper bara aktier i europeiska försvarsföretag

Are Gold Mining Equities Regaining Attention Amid Rising Gold Prices?

Fem spanska fonder som har ökat med +12% under 2025

ASRP ETF ett spel på medtech företag världen över

Europafokuserade ETPer ser större andel av flödena under första kvartalet
Crypto Market Risks & Opportunities: Insights on Bybit Hack, Bitcoin, and Institutional Adoption

Montrose storsatsning på ETFer fortsätter – lanserar Sveriges första globala ETF med hävstång

Svenskarna har en ny favorit-ETF

MONTLEV, Sveriges första globala ETF med hävstång

Sju börshandlade fonder som investerar i försvarssektorn
-

 Nyheter4 veckor sedan
Crypto Market Risks & Opportunities: Insights on Bybit Hack, Bitcoin, and Institutional Adoption
-
 Nyheter3 veckor sedan
Montrose storsatsning på ETFer fortsätter – lanserar Sveriges första globala ETF med hävstång
-
 Nyheter4 veckor sedan
Svenskarna har en ny favorit-ETF
-
 Nyheter3 veckor sedan
MONTLEV, Sveriges första globala ETF med hävstång
-
 Nyheter3 veckor sedan
Sju börshandlade fonder som investerar i försvarssektorn
-

 Nyheter3 veckor sedan
Världens första europeiska försvars-ETF från ett europeiskt ETF-företag lanseras på Xetra och Euronext Paris
-

 Nyheter3 veckor sedan
Europeisk försvarsutgiftsboom: Viktiga investeringsmöjligheter mitt i globala förändringar
-

 Nyheter2 veckor sedan
21Shares bildar exklusivt partnerskap med House of Doge för att lansera Dogecoin ETP i Europa