
Nyheter
ETFmarknaden i Europa firar sitt 24-årsjubileum med tillgångar på två biljoner USD

ETFGI, ett ledande oberoende forsknings- och konsultföretag som täcker trender i det globala ETF-ekosystemet, rapporterar att ETFmarknaden i Europa firar sitt 24-årsjubileum med rekordtillgångar på nästan 2 biljoner US-dollar. De första europanoterade ETF:erna gjorde sin debut den 11 april 2000. Dessa två ETFer var baserade på Euro Stoxx 50– och Stoxx Europe 50-indexen, och de var noterade på Deutsche Boerse i Tyskland.
Tillgångar som investerats i ETF-branschen i Europa nådde rekordhöga 1,96 biljoner USD i slutet av mars. Under mars samlade ETF-branschen i Europa nettoinflöden på 11,02 miljarder USD, vilket ger årets nettoinflöden till 49,52 miljarder USD, enligt ETFGIs mars 2024 europeiska ETFer och ETPers industrilandskapsrapport, den månatliga rapporten som är en del av en årlig betald forskningsprenumerationstjänst. (Alla dollarvärden i USD om inget annat anges.)
Höjdpunkter
- Tillgångar som investerats på ETFmarknaden i Europa nådde ett rekord på 1,96 Tn i slutet av mars och slog det tidigare rekordet på 1,90 Tn i slutet av februari 2024.
- Tillgångarna ökade med 7,8 % YTD 2024, från 1,82 Tn USD i slutet av 2023 till 1,96 Tn USD.
- Nettoinflöden på 11,02 miljarder USD i mars 2024.
- YTD nettoinflöden på 49,52 miljarder USD är tredje högsta någonsin efter YTD nettoinflöden på 59,30 miljarder USD 2021 och YTD nettoinflöden på 49,73 miljarder USD 2022.
- Artonde månaden med på varandra följande nettoinflöden.
”S&P 500-indexet ökade med 3,22 % i mars och är upp 10,56 % YTD 2024. De utvecklade marknaderna exklusive det amerikanska indexet ökade med 3,62 % i mars och steg 5,26 % YTD 2024. Spanien (upp 10,72 %) och Italien (upp 6,34 %) såg de största ökningarna bland de utvecklade marknaderna i mars. Emerging markets-indexet ökade med 1,50 % under mars och steg 2,08 % YTD 2024. Peru (upp 10,27 %) och Columbia (upp 8,19 %) såg de största ökningarna bland tillväxtmarknaderna i mars”, enligt Deborah Fuhr, managing partner, grundare och ägare av ETFGI.
Tillgångstillväxt i ETF-branschen i slutet av mars
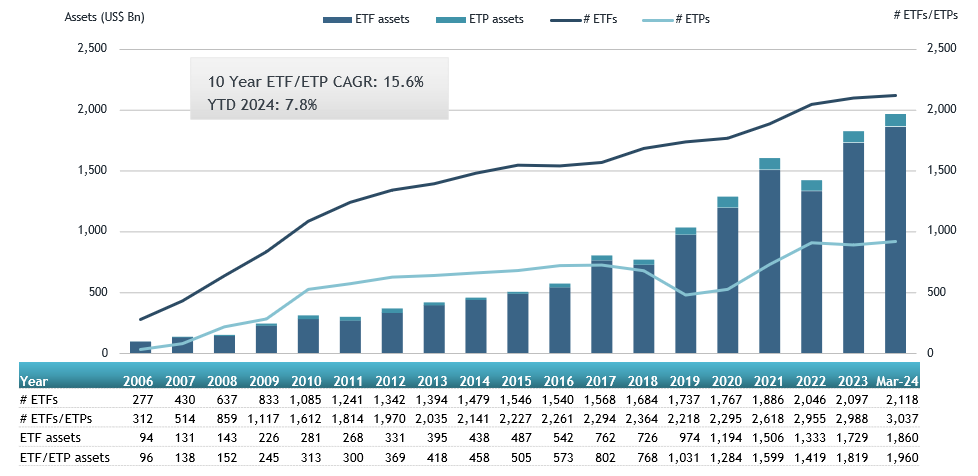
Källa: ETFGI
I slutet av mars hade ETFmarknaden i Europa 3 037 produkter, med 12 209 noteringar, tillgångar på $1,96 Tn, från 99 leverantörer listade på 29 börser i 24 länder.
Under mars samlade ETFer nettoinflöden till 11,02 miljarder USD. Aktie-ETFer samlade nettoinflöden på 9,81 miljarder USD under mars, vilket förde YTD nettoinflöden till 39,30 miljarder USD, högre än 19,38 miljarder USD i nettoinflöden av eget kapital YTD 2023. Ränte-ETFer rapporterade nettoinflöden på 719,00 USD YTD under 1 mars, vilket gav 25 USD nettoinflöden. miljarder, lägre än 15,49 miljarder USD i nettoinflöden YTD år 2023. Råvaru-ETFer rapporterade nettoutflöden på 75,35 miljoner USD under mars, vilket förde YTD nettoutflöden till 2,32 miljarder USD, lägre än 1,67 miljarder USD i nettoinflöden YTD 2023. på 670,27 miljoner USD under månaden, vilket samlade ett nettoinflöde för året i Europa på 2,33 miljarder USD, högre än 2,17 miljarder USD i nettoinflöden YTD 2023.
Betydande inflöden kan tillskrivas de 20 bästa ETFerna av nya nettotillgångar, som samlat in 9,63 miljarder USD under mars. iShares Core S&P 500 UCITS ETF – Acc (CSSPX SW) samlade in 918,91 miljoner USD, det största enskilda nettoinflödet.
Topp 20 ETFer efter nettoinflöden i mars 2024: Europa
| Namn | Kortnamn | Assets ($ Mn) Mar-24 | NNA ($ Mn) YTD-24 | NNA ($ Mn) Mar-24 |
| iShares Core S&P 500 UCITS ETF – Acc | CSSPX SW | 84,308.60 | 4,744.81 | 918.91 |
| UBS ETF (LU) MSCI United Kingdom UCITS ETF (GBP) A-acc – Acc | UC64 | 2,485.72 | 653.33 | 753.94 |
| Invesco MSCI USA ESG Universal Screened UCITS ETF – Acc | ESGU | 2,188.25 | 792.66 | 741.48 |
| Xtrackers II EUR Overnight Rate Swap UCITS ETF – 1C – Acc | DBXT | 7,281.96 | 2,089.43 | 596.35 |
| HSBC S&P 500 UCITS ETF | H4ZF | 6,756.08 | 661.46 | 562.23 |
| iShares MSCI EM ESG Enhanced UCITS ETF | EEDM | 5,000.88 | 886.95 | 556.22 |
| Vanguard FTSE All-World UCITS ETF | VGWL | 24,771.34 | 1,410.78 | 545.51 |
| Invesco S&P 500 UCITS ETF – Acc | P500 | 25,176.99 | 939.08 | 497.72 |
| iShares MSCI ACWI UCITS ETF – Acc | IUSQ | 12,806.01 | 1,453.06 | 469.35 |
| iShares USD Treasury Bond 0-1yr UCITS ETF | IBCC | 14,990.95 | 1,433.49 | 431.07 |
| iShares € High Yield Corp Bond UCITS ETF | EUNW | 7,694.75 | 1,427.77 | 413.53 |
| SPDR S&P 500 UCITS ETF | SPY5 | 12,491.17 | 3,418.58 | 388.74 |
| iShares Core MSCI World UCITS ETF – Acc | EUNL | 75,051.88 | 3,236.70 | 382.75 |
| Amundi Bloomberg Equal-weight Commodity ex-Agriculture UCITS ETF – Acc | LYTR | 1,668.95 | 367.30 | 378.26 |
| iShares STOXX Europe Small 200 UCITS ETF (DE) | SCXPEX | 916.86 | 401.43 | 357.42 |
| Amundi MSCI Japan UCITS ETF – Acc | LCUJ | 4,400.85 | 158.96 | 343.86 |
| UBS ETF (CH) – MSCI Switzerland (CHF) A-dis – Acc | SWICHA | 1,126.17 | 354.69 | 335.87 |
| SPDR MSCI World UCITS ETF – Acc | SPPW | 5,653.51 | 715.38 | 324.95 |
| Amundi S&P 500 Climate Net Zero Ambition PAB UCITS ETF | ZPA5 | 3,965.66 | 925.46 | 320.42 |
| JPMorgan US Research Enhanced Index Equity ESG UCITS ETF – Acc | JREU | 7,047.30 | 1,230.55 | 315.09 |

Källa ETFGI
De 10 bästa ETPerna av nya nettotillgångar samlade ihop 1,69 miljarder USD under mars. WisdomTree Physical Silver – Acc (PHAG LN) samlade in 832,90 miljoner USD, det största enskilda nettoinflödet.
Topp 10 ETPer efter nettoinflöden i mars 2024: Europa
| Namn | Kortnamn | Assets ($ Mn) Mar-24 | NNA ($ Mn) YTD-24 | NNA ($ Mn) Mar-24 |
| WisdomTree Physical Silver – Acc | VZLC | 2,057.21 | 793.35 | 832.90 |
| iShares Physical Silver ETC – Acc | SSLN | 785.65 | 254.30 | 245.97 |
| Xtrackers IE Physical Gold ETC Securities – Acc | XGDU | 3,640.08 | 231.87 | 167.72 |
| AMUNDI PHYSICAL GOLD ETC (C) – Acc | GOLD | 4,575.61 | 307.29 | 127.12 |
| Xtrackers Physical Gold ETC (EUR) – Acc | XAD5 | 2,202.38 | 92.10 | 80.28 |
| WisdomTree Copper – Acc | OD7C | 1,667.78 | 337.85 | 68.51 |
| Xtrackers Physical Gold Euro Hedged ETC – Acc | XAD1 | 1,335.65 | 5.06 | 50.49 |
| SG ETC FTSE MIB -3x Daily Short Collateralized – Acc | MIB3S | 33.07 | 88.10 | 40.49 |
| 21Shares Toncoin Staking ETP | TONN | 40.81 | 39.94 | 39.94 |
| Invesco Physical Gold ETC – EUR Hdg Acc | 8PSE | 564.18 | 59.65 | 33.11 |

Källa: ETFGI
Investerare har tenderat att investera i Equity ETFs under mars.


As we move through the middle of a fiscal reckoning in the U.S., investors face a shifting macro environment shaped by spending cuts, tariffs and recessionary pressures. In his latest quarterly outlook, Jan van Eck discusses where we are in the cycle, what markets may still be underestimating, and where he’s seeing both risk and opportunity.
• Fiscal reckoning is here: The U.S. is enacting spending cuts and tariffs that may reduce the deficit by 3% of GDP—roughly $1 trillion—leading to recessionary pressure.
• Gold and bitcoin remain in bull markets: They continue to benefit from de-dollarization, stimulated by defense uncertainty in Europe and tariff unpredictability.
• Tech valuations have reset: Semiconductors and growth stocks look more attractive after a major repricing since last summer. Nvidia is now trading around 20x forward earnings.
• India and international equities are gaining momentum: As the U.S. economy slows, global stimulus efforts are accelerating elsewhere, and India remains a top conviction idea.
A Fiscal Turning Point: How We Cut $1T
We’re now in the midst of what I’ve been calling a fiscal reckoning. Following years of stimulus and deficit spending, the U.S. is transitioning from a “two feet on the gas” economy to a more austere fiscal policy. Last year, the deficit stood at 6.4% of GDP. My base case is that this shrinks by 3% of GDP, or about $1 trillion, through a combination of spending cuts, tax increases and tariffs. Some assumptions and estimates that help us get there:
• 2 million job losses (400,000 federal workers, 1.6 million contractors): $125 billion
• Waste, fraud, and abuse savings: $100 billion
• Tariff revenue increases: $250 billion (conservative compared to estimates of $600–800 billion)
• Policy rollbacks like ending the Inflation Reduction Act ($65B), reversing Medicaid expansion ($200B), cutting 10% of Pentagon spending ($80B), and modest corporate tax hikes ($55B)
The implications are recessionary, with a potential rise in unemployment to 4.5–5% and pressure on corporate earnings. We’ll start seeing this reflected in forward guidance coming out in the Q2 earnings season, and this lower growth will lower inflation. This gives the Fed room to cut rates, and my expectation is for cuts of up to 200 basis points in 2025.
How to Invest:
• Stay invested, but diversified—this is a process, not a moment.
• While a slowdown will likely hit in the second half of 2025, buying should probably start in Q2.
Gold and Bitcoin: Long-Term Bull Markets, Short-Term Caution
Both gold and bitcoin continue to perform well in this environment. Gold has moved above $3,000 and has been the best-performing major asset over the past year. Bitcoin is hovering around $80,000, despite a 10-15% pullback YTD.
Gold and Bitcoin Shine as Top Performers
1-Year Return of Various Asset Classes
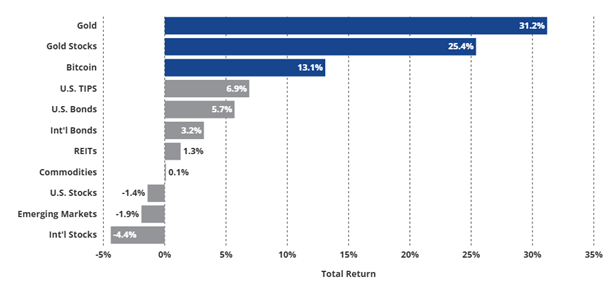
Source: VanEck, FactSet. Data as of April 7, 2025. “Gold Stocks” represented by NYSE Arca Gold Miners Index. “U.S. Stocks” represented by the S&P 500 Index. “REITs” represented by FTSE NAREIT All REITs Index. “EM Stocks” represented by MSCI Emerging Markets Index. “International Stocks” represented by MSCI AC World ex USA Index. “U.S. TIPS” represented by Bloomberg U.S. TIPS (1-3 Year) Index. “U.S. Bonds” represented by Bloomberg U.S. Aggregate Bond Index. “International Bonds” represented by Bloomberg Global Aggregate ex US Index. “Commodities” represented by Bloomberg Commodity Index. Past performance is not indicative of future results. It is not possible to directly invest in an index. Index descriptions included at the end of this presentation. Digital assets are subject to significant risk and are not suitable for all investors. It is possible to lose your entire principal investment. Not intended as an offer or recommendation to buy or sell any assets referenced herein.
Gold continues to benefit from de-dollarization. Central bank accumulation, defense uncertainty in Europe and tariff policy volatility are driving demand for an alternative to the U.S. dollar. That said, I wouldn’t add too much to gold at these levels. It’s above its 200-day moving average, so while I remain long-term bullish, I wouldn’t be surprised to see a bit of correction.
Bitcoin also remains a high-conviction holding in my view, despite its increased correlation with the Nasdaq in the post-COVID era. That makes the diversification case trickier, though not invalid. What’s notable is that bitcoin now outperforms the Nasdaq over nearly every time period, despite recent volatility.
How to Invest:
• Hold gold, but be ready for a pullback.
• Maintain long-term exposure to bitcoin; adoption continues to grow for store of value and diversification.
Semiconductors Attractively Valued After a Hard Reset
Last summer, we warned that growth stocks—especially in tech—were extremely overvalued, and I called for reduced exposure. That view played out. Since then, growth has underperformed, and the market has begun to normalize.
Nvidia’s forward P/E has dropped to around 20x, and after about a 30% correction, it now looks far more reasonable relative to its earnings trajectory.
NVIDIA Valuations Now Reasonable
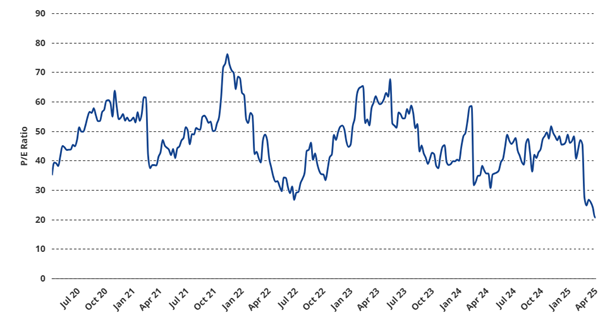
Source: Bloomberg. Data as of April 4, 2025. The price-to-earnings ratio compares a company’s share price with its earnings per share and is used to determine the relative value of a company’s shares in side-by-side comparisons. Any projections, forecasts and other forward-looking statements are not indicative of actual results, are for illustrative purposes only, are valid as of the date of this communication, and are subject to change without notice. Please see important disclosures and definitions at the end of the presentation.
How to Invest:
• Revisit semiconductors, which offer attractive value.
• Seek exposure to AI Phase 2 infrastructure plays, including utilities and energy assets.
India: A Structural Growth Story with Stronger Momentum
The global growth baton is being passed. As the U.S. tightens, Europe is adding fiscal stimulus and China is also stimulating. I believe India remains the most compelling, long-term macro growth story. Following a market correction in late 2024, I believe it’s a good time to increase exposure.
India recently outperformed the S&P 500, and while valuations are high, the P/E-to-growth ratio remains attractive. The Indian economy is not dependent on U.S. exports, and in fact, imports more than it exports. Its growth trajectory is powered by a rising middle class, a strong equity culture and its serving as a technology and services base for global corporations.
How to Invest:
• Increase exposure to India. Its macro story remains intact following its Q4 2024 correction.
• We favor exposure to growth sectors and digital innovation.
Key Takeaways
• Fiscal reckoning and recession risk: Stay diversified as markets adjust to a $1 trillion spending cut. Avoid concentrated U.S. equity bets and prepare for continued volatility.
• Cautiously bullish gold and bitcoin: Maintain long-term positions in gold and bitcoin. Both remain key hedges amid fiscal instability and shifting global currency dynamics.
• Semiconductors valuations normalize: Reengage selectively with growth and semiconductor stocks as prices reset. Consider energy and infrastructure as phase-two AI beneficiaries.
• India attractive following correction: Increase exposure to India as a core, long-term allocation. The country’s growth is domestically driven and less tied to U.S. economic cycles.
To receive more Investment Outlook insights, sign up in our subscription center.
Article authored by Jan van Eck
DISCLOSURES
Please note that VanEck may offer investment products that invest in the asset class(es) or industries included in this blog.
This is not an offer to buy or sell, or a recommendation to buy or sell any of the securities, financial instruments or digital assets mentioned herein. The information presented does not involve the rendering of personalized investment, financial, legal, tax advice, or any call to action. Certain statements contained herein may constitute projections, forecasts and other forward-looking statements, which do not reflect actual results, are for illustrative purposes only, are valid as of the date of this communication, and are subject to change without notice. Actual future performance of any assets or industries mentioned are unknown. Information provided by third party sources are believed to be reliable and have not been independently verified for accuracy or completeness and cannot be guaranteed. VanEck does not guarantee the accuracy of third party data. The information herein represents the opinion of the author(s), but not necessarily those of VanEck or its other employees.
NYSE Arca Gold Miners Index is intended to track the overall performance of companies involved in the gold mining industry. S&P 500 Index is widely regarded as the best single gauge of large-cap U.S. equities. The index is a float-adjusted, market-cap-weighted index of 500 leading U.S. companies from across all market sectors including information technology, telecommunications services, utilities, energy, materials, industrials, real estate, financials, health care, consumer discretionary and consumer staples. FTSE NAREIT All Equity REITs Index is a free-float adjusted, market capitalization-weighted index of U.S. Equity REITs. Constituents of the Index include all tax-qualified REITs with more than 50 percent of total assets in qualifying real estate assets other than mortgages secured by real property. MSCI Emerging Markets Index tracks large and mid cap representation across emerging markets countries. The MSCI Emerging Markets Investable Market Index (IMI) captures large, mid and small cap representation across Emerging Markets countries. The index covers approximately 99% of the free float-adjusted market capitalization in each country. MSCI AC World ex USA Index covers a large portion of the global equity opportunity set outside of the United States. It includes large and mid-cap stocks from 22 developed market countries and 24 emerging market countries. Bloomberg U.S. TIPS (1-3 Year) Index measures the performance of the U.S. treasury inflation-linked bond market of obligations with maturities of 1-3 years. Bloomberg Barclays U.S. Aggregate Bond TR Index is a broad-based benchmark that measures the investment grade, U.S. dollar-denominated, fixed-rate taxable bond market. Bloomberg Global Aggregate ex USD Index measures the performance of global investment grade fixed-rate debt markets that excludes U.S. dollar-denominated securities. Bloomberg U.S. Aggregate Bond Index is a broad-based benchmark that measures the investment grade, U.S. dollar-denominated, fixed-rate taxable bond market. Bloomberg Commodity Index is a broadly diversified index that tracks the commodity markets through commodity futures contracts and is made up of exchange-traded futures on physical commodities, which are weighted to account for economic significance and market liquidity.
Investments in small and mid-cap stocks may be more volatile than those of larger ones, and they are also often less liquid than those of larger companies because there is a limited market for small and mid-cap securities.
Emerging Market securities are subject to greater risks than U.S. domestic investments. These additional risks may include exchange rate fluctuations and exchange controls; less publicly available information; more volatile or less liquid securities markets; and the possibility of arbitrary action by foreign governments, or political, economic or social instability.
Global resource investments are subject to risks associated with real estate, precious metals, natural resources and commodities and events related to these industries,foreign investments, illiquidity, credit, interest rate fluctuations, inflation, leverage, and non-diversification.
Gold investments are subject to the risks associated with concentrating its assets in the gold industry, which can be significantly affected by international economic, monetary and political developments. Investments in gold may decline in value due to developments specific to the gold industry. Foreign gold security investments involve risks related to adverse political and economic developments unique to a country or a region, currency fluctuations or controls, and the possibility of arbitrary action by foreign governments, or political, economic or social instability. Gold investments are subject to risks associated with investments in U.S. and non-U.S. issuers, commodities and commodity-linked derivatives, commodities and commodity-linked derivatives tax, gold-mining industry, derivatives, emerging market securities, foreign currency transactions, foreign securities, other investment companies, management, market, non-diversification, operational, regulatory, small- and medium-capitalization companies and subsidiary risks.
Investments in digital assets and Web3 companies are highly speculative and involve a high degree of risk. These risks include, but are not limited to: the technology is new and many of its uses may be untested; intense competition; slow adoption rates and the potential for product obsolescence; volatility and limited liquidity, including but not limited to, inability to liquidate aposition; loss or destruction of key(s) to access accounts or the blockchain; reliance on digital wallets; reliance on unregulated markets and exchanges; reliance on the internet; cybersecurity risks; and the lack of regulation and the potential for new laws and regulation that may be difficult to predict. Moreover, the extent to which Web3 companies or digital assets utilize blockchain technology may vary, and it is possible that even widespread adoption of blockchain technology may not result in a material increase in the value of such companies or digital assets.
Digital asset prices are highly volatile, and the value of digital assets, and the companies that invest in them, can rise or fall dramatically and quickly. If their value goes down, there’s no guarantee that it will rise again. As a result, there is a significant risk of loss of your entire principal investment.
Digital assets are not generally backed or supported by any government or central bank and are not covered by FDIC or SIPC insurance. Accounts at digital asset custodians and exchanges are not protected by SPIC and are not FDIC insured. Furthermore, markets and exchanges for digital assets are not regulated with the same controls or customer protections available in traditional equity, option, futures, or foreign exchange investing.
Digital assets include, but are not limited to, cryptocurrencies, tokens, NFTs, assets stored or created using blockchain technology, and other Web3 products.
Web3 Companies include but are not limited to, companies that involve the development, innovation, and/or utilization of blockchain, digital assets, or crypto technologies.
All investing is subject to risk, including the possible loss of the money you invest. As with any investment strategy, there is no guarantee that investment objectives will be met and investors may lose money. Diversification does not ensure a profit or protect against a loss in a declining market. Past performance is no guarantee of future results.
© 2024 Van Eck Associates Corporation


NXTE ETP spårar priset på kryptovalutan Ethereum

Q2 2025 Outlook: In the Middle of the 3% Reckoning

DWLD ETF köper aktier från utvecklade länder världen över

Bitwise fortfarande optimistisk om Bitcoin trots tullturbulens

STOR ETF för exponering mot hydrogen

Fonder som ger exponering mot försvarsindustrin
Crypto Market Risks & Opportunities: Insights on Bybit Hack, Bitcoin, and Institutional Adoption

Warren Buffetts råd om vad man ska göra när börsen kraschar

Svenskarna har en ny favorit-ETF

De bästa börshandlade fonderna för tyska utdelningsaktier
-
 Nyheter3 veckor sedan
Fonder som ger exponering mot försvarsindustrin
-

 Nyheter2 veckor sedan
Crypto Market Risks & Opportunities: Insights on Bybit Hack, Bitcoin, and Institutional Adoption
-
 Nyheter3 veckor sedan
Warren Buffetts råd om vad man ska göra när börsen kraschar
-
 Nyheter2 veckor sedan
Svenskarna har en ny favorit-ETF
-
 Nyheter4 veckor sedan
De bästa börshandlade fonderna för tyska utdelningsaktier
-

 Nyheter1 vecka sedan
Montrose storsatsning på ETFer fortsätter – lanserar Sveriges första globala ETF med hävstång
-

 Nyheter3 veckor sedan
HANetf lanserar Europa-fokuserad försvars-ETF
-

 Nyheter1 vecka sedan
MONTLEV, Sveriges första globala ETF med hävstång