
Nyheter
Oil: Backwardation to the future
Oil futures curves have been in backwardation – when the closer futures contract can be sold for a higher price than it costs to buy a futures contract with a further expiry date, resulting in a profit for the investor – for most of the past year, driven by perceived tightness in short-term supply1. This has provided investors with ‘roll yield’ on top of the gains made from spot price movements in oil.
While we believe that the oil market is balanced at present, there is supply tightness in specific areas – especially in heavier crudes – and this could be enough to ensure that the oil futures curve remains mostly in backwardation going forward. Here’s a closer look at current oil market supply and demand dynamics.
Oil curve backwardation
Recent curve backwardation has largely been engineered by the Organisation of Petroleum Exporting Countries (OPEC). Since January 2017, the oil cartel has restricted the supply of oil by assigning its members and partners a quota for the amount of oil that they produce. Although the cartel has historically had a poor history of complying with quotas, this time it has done exceptionally well. Part of the reason for this, is that up until June 2018, each country was allocated an individual quota (rather than a group-wide limit) and this helped to restrict oil supply.
Another reason OPEC has done well in complying with quotas is because of unintended production disruptions. Recently, Venezuela has experienced an economic implosion, and this has impacted oil production significantly. Supply disruptions in Libya and Nigeria have also contributed to OPEC supply volatility.
Can backwardation last?
In June 2018, OPEC abandoned individual country quotas, so the level of quota compliance that we have seen over the past year may not last if the organisation reverts to its old ways. This could explain why the very front of the Brent futures curve went back into contango – when it costs more to buy the new futures contract than the amount received from selling the old futures contract – in July and August. Indeed, Saudi Arabia – the largest OPEC nation – has clearly expanded production since the end of the country-quota system, as have other countries.
After going back to an all-backwardated curve, the short end of the curve is now back in contango, a move underpinned by fears of over supply from increasing rig count in the US, as well as delays in the full implementation of sanctions on Iran. Despite those recent developments, we do not expect them to significantly impact long term supply. While the front end of the curve will remain prone to shifts, we do not see it to durably get back to a mostly contangoed curves.
Figure 1: Year-on-year difference in OPEC oil production

Source: Bloomberg, WisdomTree, data available as of close 05 October 2018.
Historical performance is not an indication of future performance and any investments may go down in value.
Tightness concentrated in heavy crudes
In relation to supply disruption, supply of the ‘heavier’ crudes is most at risk, in our view. Venezuela, Iran and Canada produce ‘heavy’ (low API gravity), ‘sour’ (high sulphur) crudes and these countries experienced the bulk of supply disruption this year.
Most of the world’s growth in crude oil supply is currently from US tight oil, which is ‘light’ (high API gravity) and ‘sweet’ (low sulphur). So, even though global oil supply is close to balance at the headline level, growth in oil production is uneven, with declines in supply of heavy crudes, and gains in supply of light crudes2.
Moreover, while US tight oil is seeing supply growth, there are limitations to this growth. Infrastructure needs to grow in lock-step with growth in oil production, and infrastructure limitations could slow the pace at which US shale can help satisfy global oil needs.
Demand remains strong for now
Looking at forecasts from the International Energy Agency (IEA), demand for oil looks set to remain healthy, with the IEA expecting oil demand to grow by 1.4 mb/d in 2018, and 1.5 mb/d in 2019 (following 1.5 mb/d growth in 2017). Over the medium term, the dearth of capital investment in oil production is likely to lead to tightness if demand continues to remain robust.
Oil futures likely to remain in backwardation
While we believe that the market is in balance at present, there is supply tightness in specific areas and this could be enough to ensure that the futures curve remains mostly in backwardation.
We don’t believe that a new wave of supply is forthcoming as a lack of investment in oil exploration and production should keep supply contained, and it may only take another supply shock to Libya or to Canada to cast doubts on supply. We also think that demand will remain robust, assuming today’s bullish demand expectations are not unfounded.
Source
1 For a full description of backwardation, contango, roll yields, spot return, total return, excess return and collateral yield please see Costs and Performance Tab on our ETPedia page.
2 Energy Information Administration, WisdomTree, data available as of 04 October 2019.
This material is prepared by WisdomTree and its affiliates and is not intended to be relied upon as a forecast, research or investment advice, and is not a recommendation, offer or solicitation to buy or sell any securities or to adopt any investment strategy. The opinions expressed are as of the date of production and may change as subsequent conditions vary. The information and opinions contained in this material are derived from proprietary and non-proprietary sources. As such, no warranty of accuracy or reliability is given and no responsibility arising in any other way for errors and omissions (including responsibility to any person by reason of negligence) is accepted by WisdomTree, nor any affiliate, nor any of their officers, employees or agents. Reliance upon information in this material is at the sole discretion of the reader. Past performance is not a reliable indicator of future performance.


Nyheter
Mar.25 crypto update, Research commentary on market turmoil, CIO Notes and ETP performance attribution

A – Research commentaries from last week developments
- Markets reacted to Trump tariffs – Bitcoin stands
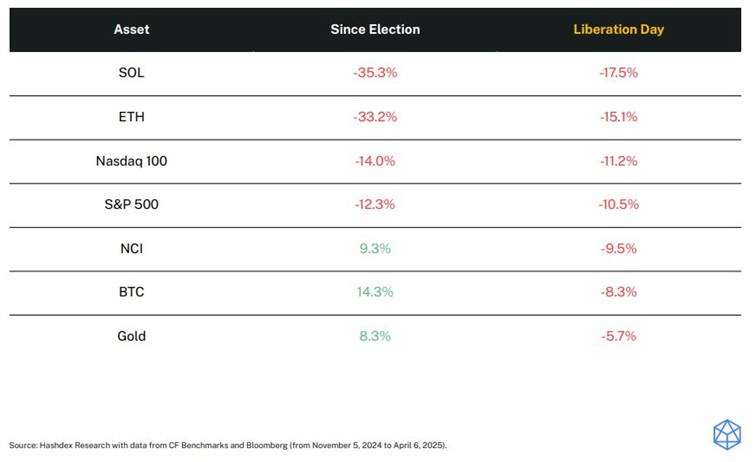
Global markets fell sharply after President Trump’s new 25% tariffs on Chinese imports. Stocks led the decline – the Nasdaq 100 is now down -14% since the election, and the S&P 500 -12.3%. Crypto reacted too, but not uniformly:
• Altcoins such as SOL and ETH were hit hardest (down over 30% since November)
• Bitcoin and the Nasdaq Crypto Index (NCI) showed resilience, gaining +14.3% and +9.3%, respectively since Election
This kind of selloff tends to erase diversification — everything moves together. But it’s essential to take a longer view:
• Since Trump’s election, only three assets have consistently outperformed: Bitcoin, NCI, and gold.
• Last week, only gold outpaced BTC, confirming the role of digital assets as a strategic long-term allocation — even in volatile regimes.
- Regulatory tailwinds are building
The next phase of crypto decoupling could come from policy. In the US, the signals are turning positive:
• The STABLE Act advanced in Congress, with Trump urging swift approval
• A tokenized fund paid $4.17M in dividends last month, proving blockchain’s real-world income potential
• The SEC has launched a review of past crypto guidance — a move toward clearer rules and broader institutional comfort
Bottom line: In a week where most assets fell, crypto stood out. That’s not a coincidence — it’s a signal.
B – CIO Monthly Notes – Crypto’s Political Tailwinds Are Blowing Hard
• Following a week in Washington, our CIO outlines how crypto is gaining bipartisan traction in DC.
• Key takeaway: regulatory clarity is coming faster than expected, and institutions are taking note.
C – March 2025 ETP performance overview
As of 31/03/25 – Source: Hashdex and Bloomberg. Performances in USD.
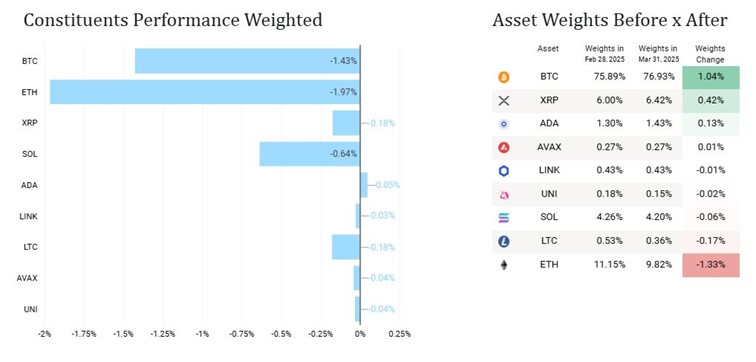
Hashdex Nasdaq Crypto Index ETP (HASH / HDX1) : March: -4.5% | YTD: -19%
Key drivers in March: Bitcoin and Ethereum
March Performance Attribution:
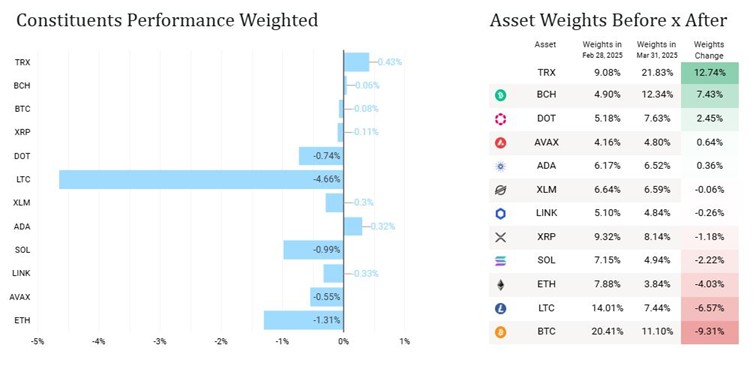
Hashdex Crypto Momentum Factor ETP (HAMO / HDXM): March: -8.5% | YTD: -22%
Key drivers in March: Litecoin, Ethereum and Solana
March Performance Attribution:
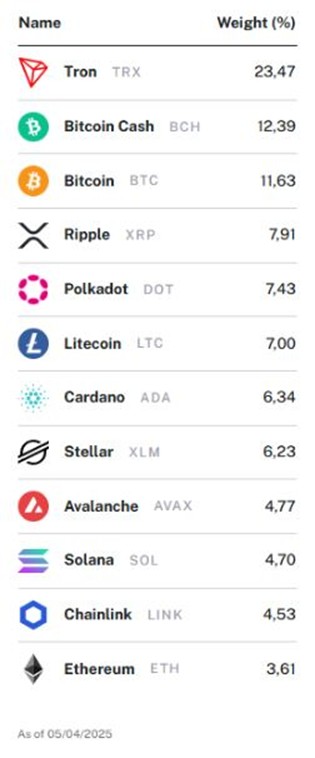
Hashdex Multi-Crypto Index ETPs
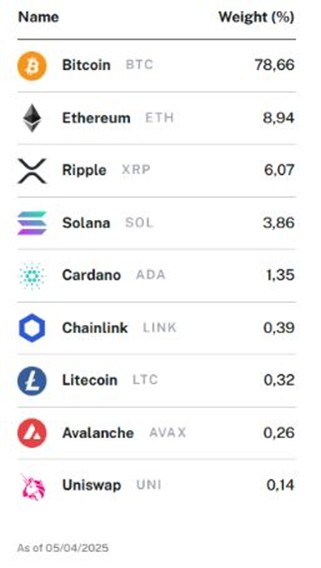
Hashdex Nasdaq Crypto Index ETP (HASH)
• Broad exposure to BTC, ETH, and major altcoins (SOL, XRP, ADA, etc)
• Quarterly rebalancing – evolutive, market cap-based allocation with no caps (weights and number of constituents)
• Largest crypto index ETP in Europe (+$300m AUM)
• ISIN: CH1184151731 | Tickers: HASH (SIX, Euronext) / HDX1 (Xetra)
• Tradable in USD, EUR, CHF, GBP
• Factsheet / Product page / Index Methodology
Hashdex Crypto Momentum Factor ETP (HAMO/HDXM )
• Momentum-based strategy with monthly rebalancing
• Designed to capture trends across large-cap crypto assets
• ISIN: CH1218734544 | Tickers: HAMO (SIX, Euronext) / HDXM (Xetra)
• Tradable in USD, EUR, CHF, GBP
• Factsheet / Product page / Index Methodology


WEBN ETF en billig globalfond från Amundi

Mar.25 crypto update, Research commentary on market turmoil, CIO Notes and ETP performance attribution

NXTB ETP spårar värdet på kryptovalutan Bitcoin

Nya ETF- och ETP-noteringar på Xetra den 8 april 2025

21Shares bildar exklusivt partnerskap med House of Doge för att lansera Dogecoin ETP i Europa

Fonder som ger exponering mot försvarsindustrin

Warren Buffetts råd om vad man ska göra när börsen kraschar

De bästa börshandlade fonderna för tyska utdelningsaktier
Crypto Market Risks & Opportunities: Insights on Bybit Hack, Bitcoin, and Institutional Adoption

Svenskarna har en ny favorit-ETF
-
 Nyheter3 veckor sedan
Fonder som ger exponering mot försvarsindustrin
-
 Nyheter2 veckor sedan
Warren Buffetts råd om vad man ska göra när börsen kraschar
-
 Nyheter4 veckor sedan
De bästa börshandlade fonderna för tyska utdelningsaktier
-

 Nyheter2 veckor sedan
Crypto Market Risks & Opportunities: Insights on Bybit Hack, Bitcoin, and Institutional Adoption
-
 Nyheter1 vecka sedan
Svenskarna har en ny favorit-ETF
-
 Nyheter7 dagar sedan
Montrose storsatsning på ETFer fortsätter – lanserar Sveriges första globala ETF med hävstång
-

 Nyheter3 veckor sedan
HANetf lanserar Europa-fokuserad försvars-ETF
-

 Nyheter3 veckor sedan
En av de mest nedladdade finansapparna i Sverige