
Nyheter
New Year, Same Old Risks?
As we step into what many hail as one of crypto’s most promising years, it’s essential to keep a balanced perspective on the potential challenges that lie ahead:
• Macro Backdrop: volatile inflation and geopolitical tensions and how it could impact the global market.
• The “MicroStrategy Trade” and its associated leveraged Bitcoin strategy and its impact on the market.
• The risk of presidential promises if they are to be unfulfilled.
• The centralization of liquid staking and restaking and its risk on the Ethereum economy.
• MICA’s impact on the European stablecoin market.
Before we get into the risks above, let’s take a quick look at how the market fared during the holiday season. Bitcoin led the charge with a 5.92% gain, while Ethereum lagged slightly, slipping by 0.61%. Solana faced a tougher time, enduring an 8.29% decline amid the seasonal lull. Despite these mixed performances, the overall crypto market saw a 5.21% increase, signaling that momentum in the industry remains strong as we move into the new year.
Figure 1: Bitcoin, Ethereum, Solana Performance During Holiday Season
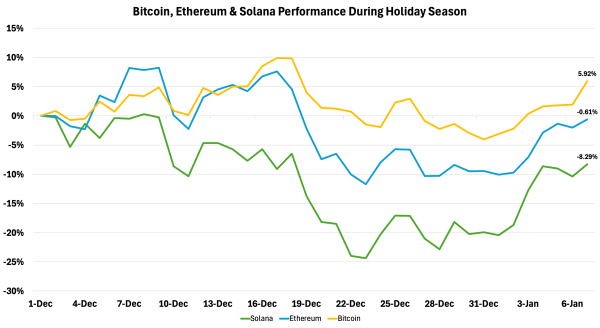
Source: 21Shares, Coingecko
As shown in Figure 1, the broader crypto market experienced a downturn in momentum during the holiday season, with trading volumes dropping significantly as investors took time off. This slowdown was compounded by unexpected hawkish comments from the Federal Reserve Chair at the latest FOMC meeting. Contrary to market expectations of four rate cuts in 2025, the Fed signaled only two potential cuts, introducing a note of caution. This stance triggered a sharp rise in the 10-year Treasury yield, which surged to 4.62%, its highest level in six months. Remarkably, this yield now exceeds the Fed’s current rate of 4.25%, as illustrated below, a striking inversion that underscores how concerned the market is about the long-term outlook.
Figure 2: 10-year Treasury Yield vs FED’s Funds Rate
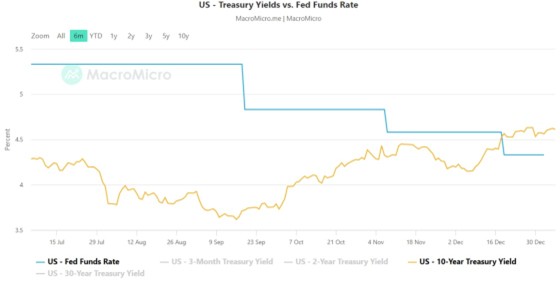
Source: MacroMicro
This unusual dynamic reflects renewed fears that restrictive monetary policy will persist longer than anticipated as investors demand higher returns for holding longer-term debt in an uncertain environment. Elevated bond yields further erode the appeal of riskier assets like cryptoassets, pulling capital toward safer, more predictable returns. The spike in the 10-year Treasury yield has thus become a major driver behind the recent downturn.
In light of these insights, let’s delve into the pivotal elements that may pose challenges for the market as we step into the new year.
Macro Backdrop
The global economy faces uncertainty as central banks grapple with interest rate decisions amid potential slowdowns. In the U.S., the incoming administration’s policies present a mixed economic outlook. Trump’s proposed tariffs may cause short-term inflation but offer long-term benefits, while expedited drilling permits could increase oil supply and potentially lower energy costs.
Concerns about U.S. inflation took center stage at the latest FOMC meeting, where Jerome Powell signaled a more hawkish outlook for 2025. This shift in expectations quickly dampened market sentiment and is a key factor behind the recent downturn for BTC, ETH, and other risk assets. BTC erased almost a month of price gains following the FOMC meeting, retracing $14K from $108K to $92K.
The European Union also faces a critical juncture in 2025, with political instability in Germany and France weakening the bloc’s core, thereby creating a leadership vacuum. The weakened Franco-German axis undermines the EU’s ability to respond cohesively to economic and geopolitical challenges and could result in inconsistent and conflicting crypto policies across the region. Alternatively, Japan’s central bank is poised for more rate hikes in 2025, with Governor Kazuo Ueda indicating readiness to tighten policy if economic conditions warrant. This move could impact global carry trades, reminiscent of the August 2024 market reaction.
Another metric to be mindful is Bitcoin’s historical correlation with M2. Despite recent interest rate cuts, M2 has been declining since October, potentially negatively impacting Bitcoin. This decline may be due to banks adjusting balance sheets – such as by reducing lending, which decreases deposits—or turning to alternative funding methods not included in M2, like repo markets or money market funds. The lag between rate cuts and their impact on broader money supply measures adds to this complexity. As Bitcoin’s adoption grows, 2025 will be crucial in determining whether its price becomes less dependent on global liquidity or maintains its strong correlation with M2. If the correlation persists, continued M2 decline could negatively affect Bitcoin throughout the year.
Figure 3: Bitcoin vs M2 Money Supply Growth
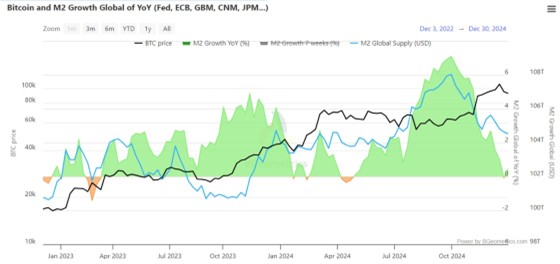
Source: Bgeometrics
Geopolitical tensions remain another key risk factor for crypto in 2025. While Trump’s Administration is expected to adopt a less aggressive military stance, the U.S.’s strong alignment with Israel raises concerns about potential escalation in the Middle East, particularly regarding Iran. Such conflicts could undermine investor confidence in high-risk assets like crypto. Meanwhile, the situation in Ukraine appears more containable, with both Zelensky and Putin signaling a willingness to negotiate. However, failure to achieve meaningful progress could still pose a significant threat to global markets, including crypto, despite the generally favorable outlook for the industry under the Trump Administration.
MicroStrategy has positioned itself as a proxy for Bitcoin exposure, holding a significant portion of its treasury in BTC. Their large Bitcoin holdings, which currently sit at 447,470 BTC or $45B, attract investors seeking beta to Bitcoin. For reference, MicroStrategy currently has a market cap of around $88B, almost 2x its Bitcoin holdings. With an average purchase price of approximately $62K, over $7B of outstanding debt used to purchase Bitcoin, a NAV premium of 1.91x, and holding roughly 2.5% of all Bitcoin circulating, a forced liquidation from MicroStrategy could send the crypto market tumbling. Before we go into how this could happen, let’s first describe how we got here.
How the MicroStrategy Flywheel Works: The MicroStrategy Bitcoin Flywheel operates as a self-reinforcing cycle centered around Bitcoin accumulation. Initially, the company allocated existing cash reserves to purchase Bitcoin, positioning it as a key corporate strategy that generated significant market attention. To fund further acquisitions, MicroStrategy raises capital through debt issuance (e.g., convertible or senior secured notes) or equity offerings (MSTR stock), often on favorable terms due to market enthusiasm for its Bitcoin-focused approach. As BTC’s price appreciates, the value of its holdings increases, strengthening its balance sheet and allowing the company to raise additional funds to purchase more BTC. This reinvestment process perpetuates the cycle, as depicted below.
Figure 4: Approximate # of BTC held by MicroStrategy at the End of Each Quarter
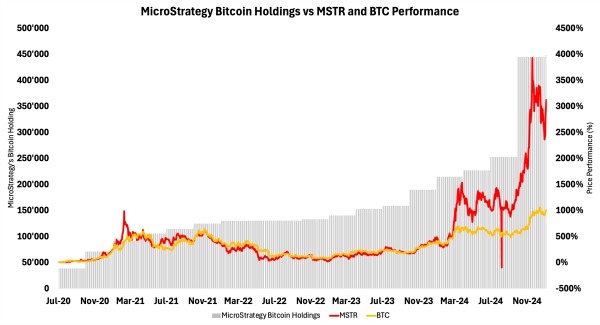
Source: 21Shares, Yahoo Finance, Investopedia
What is the current size of their Bitcoin holdings, and how does it compare to their debt levels?
Liquidation Risk: Estimating MicroStrategy’s liquidation risk is complex, but a rough calculation suggests a potential liquidation price of $16.5K/BTC. This is derived by dividing the company’s total debt outstanding by its total Bitcoin holdings, which would require an 85% drawdown in Bitcoin’s value to levels last seen during the FTX collapse in late 2022. However, this estimate is far from definitive since MicroStrategy’s debt is unsecured. Creditors, therefore, lack the authority to force the company to sell its Bitcoin holdings to repay the debt. That said, if MicroStrategy’s stock price were to decline significantly, it could trigger a scenario where debt holders exercise their rights to convert their debt into equity. This forced conversion might pressure the company to take drastic measures to meet its financial obligations, potentially including selling its Bitcoin.
• If MicroStrategy did decide to repay the entirety of its debt, it would only need to liquidate around 15% of its total Bitcoin holdings at current prices. While any sale of Bitcoin by MicroStrategy would undoubtedly make headlines and cause a temporary market dip, the actual amount of BTC they would need to sell adds up to $6.8B and would have a relatively limited effect on the broader market, and the market would likely recover after a few weeks, as we saw with the selling pressure from the German government, Mt.Gox, and Genesis during the summer of 2024.
Price Risk: When Bitcoin undergoes significant drawdowns, MicroStrategy, effectively acting as a leveraged Bitcoin proxy, often sees its stock decline faster. This amplified volatility is driven by its large Bitcoin holdings and the market’s view of MSTR as a high-beta play on Bitcoin, currently trading at around 2x its BTC NAV. A sharp decline in MSTR’s stock can trigger broader sell-offs in the company’s bonds and equities as investors worry about its ability to service debt tied to Bitcoin-backed loans or convertible bonds. Notably, one tranche of convertible debt is tied to MSTR’s price, with a margin call threshold of roughly $140–$180. If breached, this could force MicroStrategy to liquidate Bitcoin at depressed prices to maintain liquidity, further pressuring Bitcoin prices and fueling a self-reinforcing cycle of fear and selling. This feedback loop underscores the systemic risk of MicroStrategy’s leveraged Bitcoin strategy during periods of severe market stress.
Outstanding Debt Risk: Much of MicroStrategy’s outstanding debt is long-term and carries relatively low interest rates. However, the key risk lies in the potential inability to cover rising interest payments if market conditions worsen. Fortunately, the company produces sufficient revenue from its business intelligence software segment to service this debt, with approximately $500M in revenue for 2023, with similar projections for 2024. Nevertheless, the previously mentioned price and liquidation risks would still directly impact its ability to manage these interest obligations effectively.
Figure 5: MicroStrategy Bond Maturity Table, Coupon Total as a Weighted Average
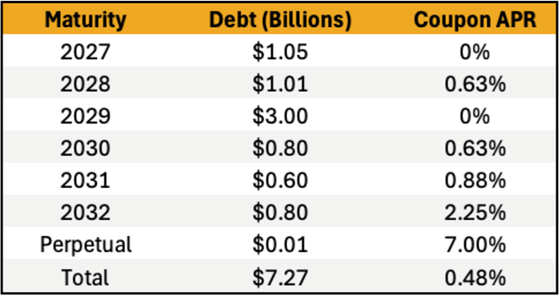
Source: 21Shares, Real Investment Advice
Option and Relative Performance Trade Risk: In equity markets, as option expiration dates approach, an asset’s price often gravitates toward its ”max pain” level—the price where the most options expire worthless, minimizing payouts for options writers. For the 17JAN25 contracts, this level is $195, while for the 24JAN25 and 31JAN25 contracts, it is $345. If these contracts expire worthless, it could amplify market consequences due to unhedging activity by market participants. This phenomenon ties into the relative-value pair trade between MicroStrategy and Bitcoin. MSTR might currently be perceived as overpriced relative to the NAV of its Bitcoin holdings. A relative-value trade, such as shorting MSTR and longing BTC, aims to profit from the eventual alignment of MSTR’s stock price with its Bitcoin NAV. However, this trade carries significant risk in bullish markets where momentum often overshadows fundamentals. If options linked to MSTR or BTC expire worthless, this could trigger a liquidation or reallocation of positions by investors, driving price instability. A significant dip in MSTR’s price could have a reflexive impact on BTC, creating a feedback loop.
Presidential Promises Unfulfilled
The 2024 election cycle brought optimism for clearer crypto regulation, with promises of support for innovation. Some of these are mentioned in our previous edition and include:
• Bitcoin as a Strategic Reserve Asset
• Favorable regulatory treatment for Decentralized Finance
• Jurisdictional clarity between the SEC and the CFTC via FIT21
• Closer integration between TradFi and crypto by rescinding SAB121
• Favorable tax treatments for U.S.-based crypto companies
• A more crypto-friendly regulatory environment
The realization of any of these initiatives will ensure that crypto maintains its momentum throughout the year. However, delays or opposition in implementing some of these pro-crypto policies could create extended uncertainty, hindering market confidence and institutional participation while dampening enthusiasm.
Liquid Staking and Restaking Centralization
As a recap, Liquid Staking allows users to stake their ETH while maintaining liquidity by receiving tokenized representations of their staked ETH (e.g., stETH from Lido). These tokens can be used in DeFi, enabling users to earn additional yields while their ETH remains staked for network security. On that note, Lido, the largest liquid staking protocol, currently controls approximately 50% of Ethereum’s Total Value Locked (TVL), making it a dominant player in the network’s ecosystem.
The caveat is that Lido’s dominance in Ethereum staking—controlling over 28% of validators—presents a significant centralization risk to the network’s security and the principle of decentralization. While initiatives like community staking modules, permissionless validator sets, and a staking router leveraging Distributed Validator Technology aim to further diversify the validator set and mitigate these risks, Lido remains a single protocol. This concentration of power creates a potential single point of failure, where an exploit or external pressure on Lido could critically undermine Ethereum’s security.
Figure 6: Breakdown of Ethereum’s Staking Dominance Across Different Providers
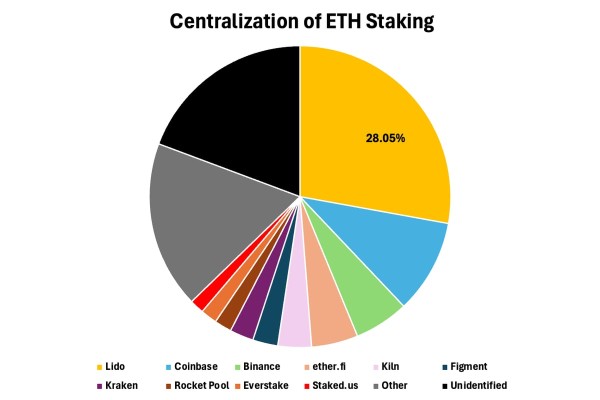
Source: 21Shares, Dune Analytics
On the other hand, Restaking enables the security provided by staked ETH to be lent out to secure other protocols, amplifying the economic rewards derived from staking. The sector, which is led by services like EigenLayer, already manages approximately $15B in TVL, representing a substantial share of Ethereum’s staking economy, with over 10% already being restaked.
Restaking applies Ethereum’s security to other projects but also heightens systemic risk: a failure in any downstream protocol could compromise Ethereum’s core security. Moreover, restaking now extends beyond Ethereum—Babylon Finance, for instance, leverages a similar mechanism to secure networks with Bitcoin’s capital, with more than $6B in TVL. Thus, it’s not an embryonic sector anymore.
This cross-protocol risk could lead to instability in the broader ecosystem if not carefully managed. Namely, Ethereum’s founder, Vitalik Buterin, laid out three hypothetical scenarios which could prove harmful to Ethereum’s security:
• Overloading ETH security: Too many applications relying on the crypto-economic security of Ethereum could overburden the network and render it incapable of effectively reaching decisions, and potentially result in hard forks.
• Creating perverse motivations: Users could be tempted to secure the most profitable network, although it may not be the most secure. This can ultimately undermine ETH’s security.
• Introducing novel avenues for exploitation: Validators could be bribed from malicious actors to vote for a particular dishonest block on an external network.
MiCA’s Impact on the European Stablecoin Market
The MiCA Regulation came into full effect on December 30, 2024, ushering in a comprehensive framework for crypto oversight in the EU. Among its key provisions, MiCA mandates that stablecoin issuers secure licenses and adhere to strict reserve, transparency, and usage requirements. Non-compliant stablecoins, such as Tether’s USDT, faced delistings from major EU exchanges, raising concerns over potential liquidity risks as stablecoins are a proxy for investable capital. However, it’s worth noting that close to 87% of crypto’s trading volume exists outside of Europe, as shown in Figure 7, so the impact is rather limited.
Figure 7: Crypto’s Trading Volume on Exchanges by Region
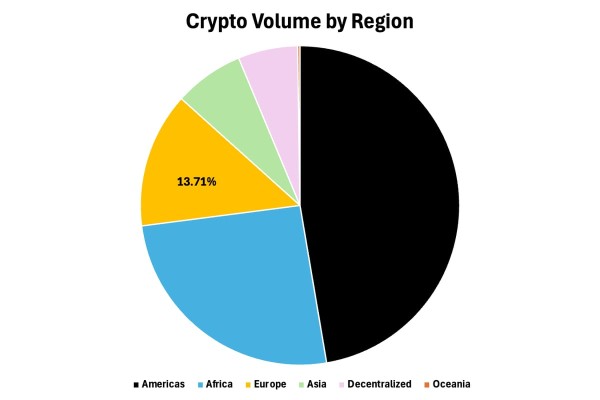
Source: 21Shares, Messari
To that point, Tether’s circulating supply temporarily declined from its peak of $143B to $141.2B following these regulatory changes, as shown in Figure 8 below. However, the impact was largely contained, with USDT’s supply rebounding by $500M since the turn of the year. In fact, USDT supply has actually grown around 16% since early October, despite knowledge of MiCA’s formal implementation. Arbitrage opportunities briefly emerged when USDT dipped to $0.9954 on December 30, but its dollar peg held firm, demonstrating market resilience.
Figure 8: USDT Stablecoin Supply
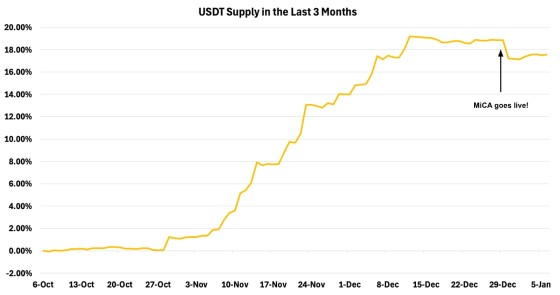
Source: 21Shares, Artemis
While MiCA’s strict standards introduce challenges, they provide much-needed clarity for stablecoin issuance and service providers in the EU. By establishing a consistent regulatory environment, MiCA is poised to enhance stability and trust in the region’s crypto markets, paving the way for sustainable growth.
All in all, while the outlook for the new year seems overwhelmingly positive, the crypto market may face multiple headwinds this year that could stall its momentum.
Research Newsletter
Each week the 21Shares Research team will publish our data-driven insights into the crypto asset world through this newsletter. Please direct any comments, questions, and words of feedback to research@21shares.com
Disclaimer
The information provided does not constitute a prospectus or other offering material and does not contain or constitute an offer to sell or a solicitation of any offer to buy securities in any jurisdiction. Some of the information published herein may contain forward-looking statements. Readers are cautioned that any such forward-looking statements are not guarantees of future performance and involve risks and uncertainties and that actual results may differ materially from those in the forward-looking statements as a result of various factors. The information contained herein may not be considered as economic, legal, tax or other advice and users are cautioned to base investment decisions or other decisions solely on the content hereof.


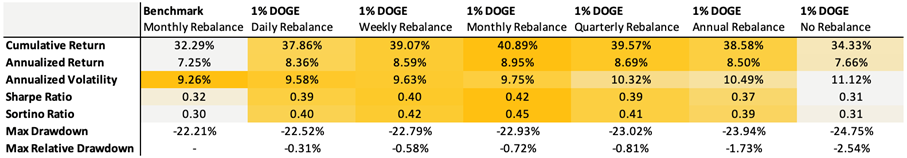
Dogecoin has outperformed other major cryptoassets over the past decade, while also exhibiting a low correlation to crypto and traditional assets. This creates a compelling argument for a portfolio allocation. We tested a Bitcoin-enhanced growth portfolio, which is a traditional 60/40 infused with 3% Bitcoin, and we introduced a modest 1% DOGE allocation. Since most prospective investors likely already hold Bitcoin, this offers a lens into how the two assets can complement each other.
Despite the small portfolio allocation, every approach delivered stronger returns. The benchmark returned 7.25% annually, while DOGE-enhanced portfolios reached as high as 8.95%. Sharpe ratios improved in almost all tests, indicating better risk-adjusted returns. Volatility did slightly tick up, but drawdowns remained largely contained. Even with no rebalancing, the max drawdown only deepened by a few percentage points, underscoring that even a 1% DOGE allocation adds meaningful punch without destabilizing the broader portfolio.
Rebalancing remains essential to capturing upside effectively. Without it, returns can plateau while risk quietly compounds. Monthly or weekly rebalancing offered the best balance, maximizing returns while keeping volatility and drawdowns in check, especially during periods of broader market stress, as we’ve recently seen. Given Dogecoin’s momentum-driven nature, a more strategic approach linked to broader crypto market cycles may offer even greater optimization beyond routine rebalancing.
With the right structure, a 1% allocation to Dogecoin isn’t reckless—it’s rewarding.
Bear Case
Despite strong fundamentals and a rich cultural legacy, Dogecoin’s recent rally, fueled by post-election memecoin mania, may have front-run its true cycle potential. As attention shifts to newer narratives, DOGE risks being seen as ’yesterday’s play,’ potentially underperforming even in a rising market. Still, that wouldn’t signal a flaw in its model, just a pause in a fast-rotating cycle.
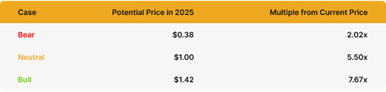
Assuming a continued 10% compounded annual growth rate (CAGR) from its 2021 peak of $0.73, DOGE would be projected to land around $0.38 by 2025—still more than 2x from today’s levels but modest relative to past cycles. More notably, this would mark the first time Dogecoin fails to reach a new all-time high in a full market cycle.
Neutral Case
Dogecoin may not dominate headlines like it did at its peak, but it still holds cultural relevance and widespread recognition. In a scenario where the total crypto market cap peaks at $5 trillion this cycle and DOGE maintains a solid, albeit slightly reduced, market share of 3% instead of its previous 4%, this would result in a market capitalization of approximately $150 billion for DOGE.
At that valuation, DOGE would trade near $1 per coin, a ~5.5x gain from current levels around $0.185. This neutral case assumes Dogecoin retains its stature as the leading memecoin, despite increased competition, with stable adoption and renewed retail interest, but without the same euphoria of the last cycle.
Bull Case
If we take DOGE’s bottom price of $0.007 just before the last bull run began and fast-forward two years to the bottom of the current cycle at $0.0585, that move reflects a CAGR of 189%. If DOGE were to mirror this explosive growth, DOGE would reach approximately $1.42.
In this scenario, Dogecoin benefits from renewed memecoin mania, increasing real-world adoption, and stronger interest fueled by regulatory clarity and potential integration with major platforms like Elon Musk’s X. A full return of retail enthusiasm and broad cultural momentum could reestablish DOGE as the breakout asset of the cycle, potentially even doubling its all-time high.
Research Newsletter
Each week the 21Shares Research team will publish our data-driven insights into the crypto asset world through this newsletter. Please direct any comments, questions, and words of feedback to research@21shares.com
Disclaimer
The information provided does not constitute a prospectus or other offering material and does not contain or constitute an offer to sell or a solicitation of any offer to buy securities in any jurisdiction. Some of the information published herein may contain forward-looking statements. Readers are cautioned that any such forward-looking statements are not guarantees of future performance and involve risks and uncertainties and that actual results may differ materially from those in the forward-looking statements as a result of various factors. The information contained herein may not be considered as economic, legal, tax or other advice and users are cautioned to base investment decisions or other decisions solely on the content hereof.


SPFT ETF är en global satsning på teknikföretag

Dogecoin in a portfolio: A small 1% allocation has a loud bark!

VBTC ETN spårar priset på kryptovalutan Bitcoin

iShares och Franklin Templeton listar nya ETFer på Xetra

BE28 ETF företagsobligationer med förfall 2028 och inget annat

Fonder som ger exponering mot försvarsindustrin
Crypto Market Risks & Opportunities: Insights on Bybit Hack, Bitcoin, and Institutional Adoption

Warren Buffetts råd om vad man ska göra när börsen kraschar

Montrose storsatsning på ETFer fortsätter – lanserar Sveriges första globala ETF med hävstång

Svenskarna har en ny favorit-ETF
-
 Nyheter4 veckor sedan
Fonder som ger exponering mot försvarsindustrin
-

 Nyheter3 veckor sedan
Crypto Market Risks & Opportunities: Insights on Bybit Hack, Bitcoin, and Institutional Adoption
-
 Nyheter3 veckor sedan
Warren Buffetts råd om vad man ska göra när börsen kraschar
-
 Nyheter2 veckor sedan
Montrose storsatsning på ETFer fortsätter – lanserar Sveriges första globala ETF med hävstång
-
 Nyheter3 veckor sedan
Svenskarna har en ny favorit-ETF
-

 Nyheter4 veckor sedan
HANetf lanserar Europa-fokuserad försvars-ETF
-

 Nyheter2 veckor sedan
MONTLEV, Sveriges första globala ETF med hävstång
-

 Nyheter3 veckor sedan
Fastställd utdelning i MONTDIV mars 2025