Morningstar Wide Moat Focus Index Index Construction (Part 1/2). Long-term outperformance defines the track record of Morningstar’s success in identifying quality moat companies that are also trading at attractive valuations.
The Morningstar® Wide Moat Focus IndexTM has outperformed the broader U.S. market since its inception in 2007. What is behind the index concept that has achieved such a track record?
This is part one of a two-part series that examines the Morningstar® Wide Moat Focus IndexTM
The Quality and Value of Stocks
Moat Investing is a popular investment strategy based on analysing the quality and value of stocks. Central to the strategy are companies with sustainable competitive advantages – so called Economic Moats. Identifying promising moat companies takes extensive, continuous research and complex financial knowledge. Independent investment research company Morningstar has developed an index that combines their extensive moat analysis and fair value research. The Morningstar Wide Moat Focus Index (MWMFTR or “U.S. Moat Index”) consists of stocks that received a Wide Moat Rating by Morningstar and are trading below fair value – in other words, stocks that are positioned to deliver long-term above-average returns. Serving as underlying for an exchange-traded fund, the index offers an attractive, simple way to invest in quality U.S. companies.
Identifying Wide Economic Moats
The index universe of the MWMFTR is based on the stock universe of the Morningstar US Market Index, which consists of around 1.500 U.S. stocks. From this pool, which equals 97 percent of the total US equity market capitalization, Morningstar determines all companies with a wide Economic Moat: Companies with competitive advantages that are likely to be maintained for 20 years or more. Approximately 140 companies receive a corresponding Morningstar® Economic Moat Rating of Wide. Stocks are screened for five sources of moat. Often, a company possesses more than one source of moat. The most common ones among U.S. companies are: Intangible Assets (74 percent of U.S. stocks with a wide Morningstar® Economic Moat Rating), Cost Advantages (49 percent) and Switching Costs (35 percent). Network effects (18 percent) and an Efficient Scale (11 percent) are less common (Data as of: 30.04.2017 )
Ranking by Valuation
In the second step, Morningstar ranks these 140 identified wide moat companies on the U.S. equity market by valuation. Only attractively rated stocks are considered as potential index components for the U.S. Moat Index. Therefore, Morningstar’s analysts determine a fair value estimate of each company identified as Wide Moat. The focus of the analysis is on evaluating the future potential profitability and assessing the certainty of future cash flows. The estimated fair price is used to represent the intrinsic value of the stock and is directly compared to its market price. The determined fair value estimate might differ sharply from the current market price of a stock, particularly short-term. Over time, this difference tends to even out, turning undervalued stocks into an attractive investment long-term. Stocks whose market price is above the fair value tend to have little prospects of further price gains.
As a result, the index portfolio contains a minimum of 40 up to 80 stocks with a Morningstar Economic Moat Rating of wide. These components are split up into two equally-weighted sub-portfolios, which are both reconstituted and rebalanced semi-annually on alternating quarters. Weights will vary with market prices until the next reconstitution date.
Important Disclosures
This commentary is not intended as a recommendation to buy or to sell any of the named securities. Holdings will vary for the MOAT ETF and their corresponding Indices.
Amundi S&P Global Financials ESG UCITSETF DR EUR (D) (WEL8 ETF) med ISIN IE000ENYES77, försöker följa S&P Developed Ex-Korea LargeMidCap Sustainability Enhanced Financials-index. S&P Developed Ex-Korea LargeMidCap Sustainability Enhanced Financials-index spårar stora och medelstora företag från finanssektorn. Aktierna som ingår filtreras enligt ESG-kriterier (miljö, social och bolagsstyrning).
Den börshandlade fondens TER (total cost ratio) uppgår till 0,18 % p.a. Amundi S&P Global Financials ESG UCITSETF DR EUR (D) är den billigaste ETF som följer S&P Developed Ex-Korea LargeMidCap Sustainability Enhanced Financials index. ETFen replikerar det underliggande indexets prestanda genom fullständig replikering (köper alla indexbeståndsdelar). Utdelningarna i ETFen delas ut till investerarna (Årligen).
Amundi S&P Global Financials ESG UCITSETF DR EUR (D) är en mycket liten ETF med tillgångar på 2 miljoner euro under förvaltning. ETFen lanserades den 20 september 2022 och har sin hemvist i Irland.
Investeringsmål
AMUNDI S&P GLOBAL FINANCIALS ESG UCITSETF DR – EUR (D) försöker replikera, så nära som möjligt, resultatet av S&P Developed Ex-Korea LargeMidCap Sustainability Enhanced Financials Index (Netto Total return index). Denna ETF har exponering mot stora och medelstora företag i utvecklade länder. Den innehåller uteslutningskriterier för tobak, kontroversiella vapen, civila och militära handeldvapen, termiskt kol, olja och gas (inkl. Arctic Oil & Gas), oljesand, skiffergas. Den är också utformad för att välja ut och omvikta företag för att tillsammans förbättra hållbarhet och ESG-profiler, uppfylla miljömål och minska koldioxidavtrycket.
Det betyder att det går att handla andelar i denna ETF genom de flesta svenska banker och Internetmäklare, till exempel DEGIRO, Nordnet, Aktieinvest och Avanza.
President Trump announced a highly aggressive tariff package—one with broad macroeconomic implications—and global markets reacted sharply. In this environment of heightened volatility, we urge investors to maintain perspective, just as they should when prices are volatile to the upside (e.g., last year’s post-election rally).
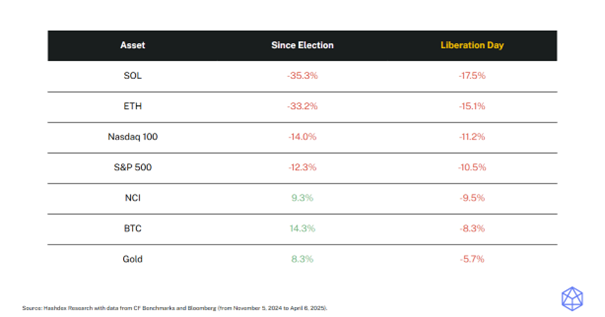
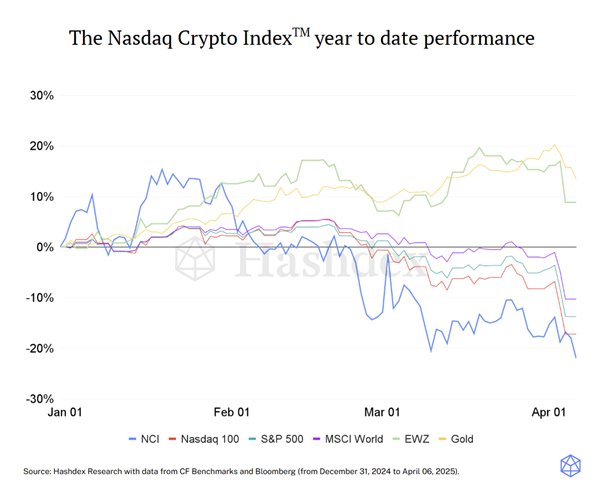
Notably, since the election, bitcoin and the Nasdaq Crypto Index have outperformed gold, the S&P 500, and Nasdaq 100. Even in the wake of the tariffs, only gold has outpaced bitcoin and the NCI—highlighting the relative strength of digital assets amid global market declines.
Market Highlights
Stablecoin legislation advances in US
The House Financial Services Committee voted to advance a monumental bill to regulate stablecoins, the STABLE Act, following the Senate Banking Committee approval of similar legislation earlier this year.
President Trump has said he wants stablecoin legislation approved by Congress before its August recess, reinforcing the new administration’s focus on establishing clear crypto regulation.
Tokenized fund sets dividend benchmark
BlackRock’s BUIDL paid an estimated $4.17 million in monthly dividends during March.
This highlights the potential of crypto to create attractive investment instruments, such as tokenized funds, which stood out this month paying massive dividends and setting a new benchmark for the class.
SEC chair orders review of crypto guidance
Acting SEC Chair Mark T. Uyeda ordered a review of past staff guidance on crypto, including risk warnings and interpretations of the Howey test.
This move, like others before, signals a broader shift toward a more open regulatory approach, potentially strengthening the presence of bitcoin and other digital assets in the US in the near future.
Market Metrics
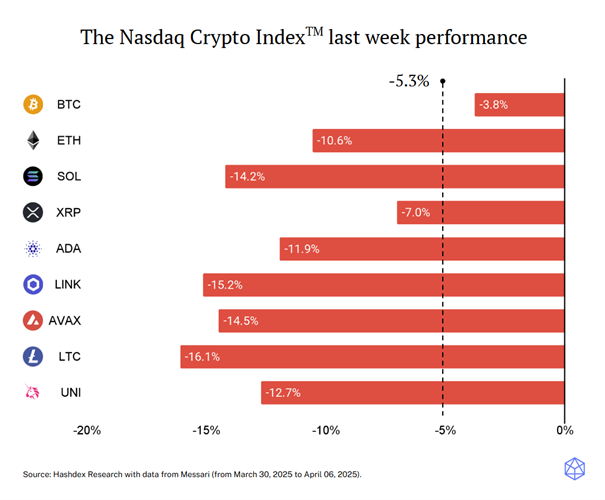
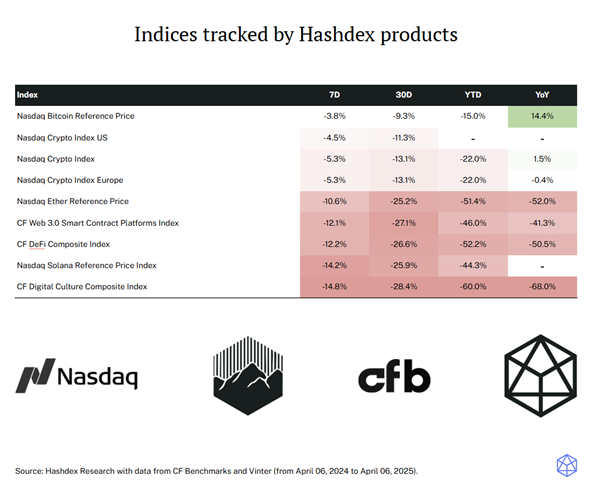
The NCITM constituents had another negative week, with only XRP (-7.0%) and BTC (-3.8%) avoiding double-digit losses. The overall NCITM decline of -5.2% was cushioned by BTC’s relative resilience, as it performed better as a store-of-value asset. However, the drop still reflects a broader risk-off sentiment across all markets, driven by Trump’s tariff policies and growing macroeconomic uncertainties that are prompting investors to reassess their positions.
This week, the NCITM fell -5.3%, narrowing the gap with traditional indices such as the Nasdaq 100 (-9.8%) and S&P 500 (-9.1%) which experienced sharper losses following Trump’s tariff announcements. BTC (-3.8%) performed similarly to gold (-3.3%), though gold remains the top-performing asset class year-to-date. The week reinforced the risk-off sentiment, with investors broadly retreating from risk assets. Still, it also highlighted crypto’s growing relevance, as the most volatile asset class managed to outperform traditional markets in a stressed environment.
JP Morgan Global Emerging Markets Research Enhanced Index Equity SRI Paris Aligned Active Strategy investerar i företag från tillväxtmarknader. ETF strävar efter att generera en högre avkastning än MSCI Emerging MarketsSRI EU PAB Overlay ESG Custom-index. Aktierna som ingår filtreras enligt ESG-kriterier (miljö, social och bolagsstyrning). Dessutom beaktas EUs direktiv om klimatskydd.
Den börshandlade fondens TER (total cost ratio) uppgår till 0,30 % p.a. Utdelningarna i ETF:n ackumuleras och återinvesteras.
JPMorgan Global Emerging Markets Research Enhanced Index Equity SRI Paris Aligned Active UCITSETF USD (acc) är en mycket liten ETF med tillgångar på 2 miljoner euro under förvaltning. Denna ETF lanserades den 5 mars 2025 och har sin hemvist i Irland.
Investeringsmål
Delfondens mål är att uppnå en långsiktig avkastning som överstiger MSCI Emerging MarketsSRI EU PAB Overlay ESG Custom Index* (”riktmärket”) genom att aktivt investera i huvudsak i en portfölj av tillväxtmarknadsföretag, samtidigt som målen i Parisavtalet är i linje.
Det betyder att det går att handla andelar i denna ETF genom de flesta svenska banker och Internetmäklare, till exempel Nordnet, SAVR, DEGIRO och Avanza.