Följ oss
the_ad_group(12516);

Nyheter

Macro backdrop favours Australian equities but headwinds linger

Publicerad

den

ETF Securities Equity Research Macro backdrop favours Australian equities but headwinds linger Revival in commodity price

ETF Securities Equity Research Macro backdrop favours Australian equities but headwinds linger

Highlights

  • Revival in commodity prices has improved the macro outlook for Australia’s export driven economy.
  • Positive inflation expectations globally spurred by the repricing of US inflation and rising oil prices will lead to a recovery in wage growth in Australia, helping boost consumption.
  • The Fed model acts as a contrarian indicator for Australian equities and highlights further upside for stocks.
  • The contribution of a minority of companies in the energy and mining sector have caused the dividend payout ratio to appear unrealistically higher.

Commodity upswing benefits macro outlook

Rising commodity prices in 2016, in particular iron ore (+80%) and coal (+300%), have pushed Australia’s trade balance into surplus for the first time since 2014. The improved terms of trade (export prices relative to import prices) will support domestic demand. However since the rise in exports was due to a rise in prices rather than volumes, it is unlikely to translate into higher real Q4 GDP growth. We view the contraction of Q3 2016 GDP as temporary and expect to see a pickup in housing, Liquid Natural Gas (LNG) supply, small business profits and retail sales to restore Q4 2016 GDP growth.

Click to enlarge

The base effects of higher fuel prices will drive headline CPI inflation higher, currently at 1.3%, towards the Reserve Bank of Australia’s (RBA) 2-3% target by Q1 2017. Furthermore, the re-pricing of US inflation subsequent to Trumps presidential victory and his pro-growth policies has raised inflation expectations globally.

Click to enlarge

This should alleviate some of the downside risks posed by prior weak inflation expectations and generate a recovery in wages. We are now starting to see a gradual rise in real wage growth since the latter half of 2015. Total household debt is excessive at 186% of income on average, its highest level since 1977. For this reason, a revival in wage growth is the key to underpin consumption, known to account for 56% of economic activity.

Stability in China is pivotal for trade

The Chinese economy picked up pace during 2016 owing to increased infrastructure spending and a buoyant property market. Chinese strength is best evident in Australia in the strong demand and pricing of bulk industrial commodities, bearing in mind they are by far its biggest trading partner worth 30% of exports. However, Donald Trump’s presidency raises the potential for a rise in US-China trade friction and attempts to threaten the outlook for Australian exports. On the positive side, demand for tourism and education services in Australia might get a boost, as an alternative to the US should these frictions materialise.

Rebalancing economy

There are signs that other sectors of the economy are moving out from the shadow of the resources sector. We expect to see the benefits of accommodative monetary conditions and the weaker Australian dollar to bolster the competitiveness of non-resource exports across tourism, education and services.

Click to enlarge

Fed model acts as a contrarian indicator

The combination of an improved macro outlook supported by higher material prices and the global reflation theme have helped swing Australian corporate earnings growth forecasts for 2017 back to positive territory after stagnating for 2 years. However a careful look at valuations suggest Australian equities are not cheap. The cyclically adjusted price to earnings (CAPE) ratio for the MSCI Australia Index at 18.3x is at the benchmark’s long-term median CAPE at 18x. The chart below depicts the Fed model (based on the ratio of forward equity earnings yield and 10-year government bond yields) as a contrarian indicator for Australian equities. As the ratio trends downwards (suggesting bonds favoured over equities), Australian equities tend to outperform. Currently the ratio at 1.36 has been steadily declining and is reverting to its long-term median of 1.31 signifying further upside for Australian equities.

Higher yields drive momentum

Dividend yields have been the main driver of short and medium term returns of the Australian equity market. Australian companies’ dividends are high by international standards, yielding 5.6% on average. Domestic investors and pension funds rely heavily on the Australian equity markets as a source of income as they benefit from franked dividends, an agreement in Australia eliminating the double taxation of dividends.

More importantly, data from the Australian Bureau of Statistics (ABS) reveals that the percentage of the population that is in retirement i.e. aged 65 years and above grew by 37% since 2006. ABS has projected that this segment will rise 21% by 2023. Given this structural demographic shift among the investor base, we expect the demand for high yielding equities to persist as the aging population seek to generate more stable income.

Dividend payments are sustainable

In 2016, the dividend payout ratio (that measures the proportion of a company’s earnings paid to investors as dividends) attained its highest level at 190% in more than a decade. Implying that Australian companies were paying more than they earned. This raised concerns on the sustainability of ongoing dividend payments. However, we found a minority of companies in the energy and mining sectors skewed the ratio higher. On stripping out their contribution to the overall ratio, we got a more realistic value of 78%, which did not have a material impact on the dividend yield of the index.

In addition, on analysing the combination of dividends paid and share buybacks as a percentage of free cash flow, we noted buybacks were a small portion of the total amount, rendering dividend payments not as stretched.

Click to enlarge

In fact, the rise of the dividend payout ratio was an outcome of the reduced profitability of mining and energy firms as opposed to an increase in dividend payments. This helped reinstate our view that the durability of future dividend payments remains intact.

Important Information

General

This communication has been issued and approved for the purpose of section 21 of the Financial Services and Markets Act 2000 by ETF Securities (UK) Limited (“ETFS UK”) which is authorised and regulated by the United Kingdom Financial Conduct Authority (the “FCA”).

The information contained in this communication is for your general information only and is neither an offer for sale nor a solicitation of an offer to buy securities. This communication should not be used as the basis for any investment decision. Historical performance is not an indication of future performance and any investments may go down in value.

Fortsätt läsa
Annons
Klicka för att kommentera

Skriv en kommentar

Din e-postadress kommer inte publiceras. Obligatoriska fält är märkta *

Nyheter

Trump’s Liberation Day: The impact of tariffs on the crypto market

Publicerad

den

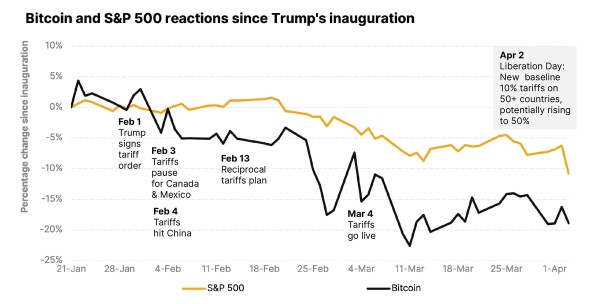
Crypto trades around the clock and often responds quickly to market uncertainty. Bitcoin usually drops first during the market turbulence because it’s risky and easy to trade, just like tech stocks. Here’s how Trump’s tariffs are playing into that.

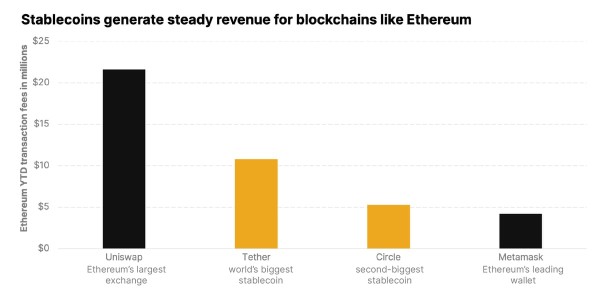
Stablecoins: The real powerhouse of crypto

Stablecoins are digital currencies tied to assets like the U.S. dollar, making them stable in price and easy to send worldwide instantly. They drive the crypto economy, moving billions, powering financial applications, and reshaping payments. From remittances to billion-dollar treasuries, explore how leading stablecoins like USDT and USDC are making it happen.

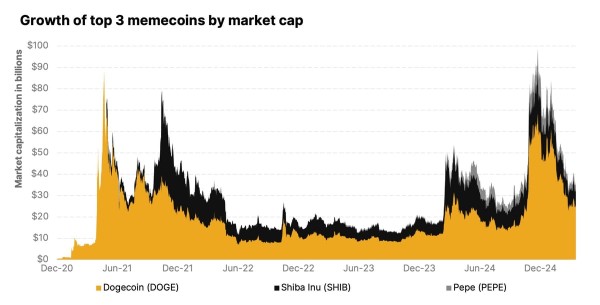
Why the memecoin mania isn’t a joke

A memecoin is a cryptocurrency inspired by internet memes or viral trends. Unlike traditional cryptocurrencies focused on utility (like Bitcoin or Ethereum), memecoins thrive on community engagement, humor, and speculative momentum. With low barriers to entry, they’re easy to create and trade, making them a go-to starting point for crypto newcomers.

Research Newsletter

Each week the 21Shares Research team will publish our data-driven insights into the crypto asset world through this newsletter. Please direct any comments, questions, and words of feedback to research@21shares.com

Disclaimer

The information provided does not constitute a prospectus or other offering material and does not contain or constitute an offer to sell or a solicitation of any offer to buy securities in any jurisdiction. Some of the information published herein may contain forward-looking statements. Readers are cautioned that any such forward-looking statements are not guarantees of future performance and involve risks and uncertainties and that actual results may differ materially from those in the forward-looking statements as a result of various factors. The information contained herein may not be considered as economic, legal, tax or other advice and users are cautioned to base investment decisions or other decisions solely on the content hereof.

Fortsätt läsa

Nyheter

WEBN ETF en billig globalfond från Amundi

Publicerad

den

Amundi Prime All Country World UCITS ETF Acc (WEBN ETF) med ISIN IE0003XJA0J9, strävar efter att spåra Solactive GBS Global Markets Large & Mid Cap-index. Solactive GBS Global Markets Large & Mid Cap-index spårar stora och medelstora aktier från utvecklade och tillväxtmarknader över hela världen.

Amundi Prime All Country World UCITS ETF Acc (WEBN ETF) med ISIN IE0003XJA0J9, strävar efter att spåra Solactive GBS Global Markets Large & Mid Cap-index. Solactive GBS Global Markets Large & Mid Cap-index spårar stora och medelstora aktier från utvecklade och tillväxtmarknader över hela världen.

Den börshandlade fondens TER (total cost ratio) uppgår till 0,07 % p.a. Amundi Prime All Country World UCITS ETF Acc är den billigaste ETF som följer Solactive GBS Global Markets Large & Mid Cap-index. ETFen replikerar det underliggande indexets prestanda genom fullständig replikering (köper alla indexbeståndsdelar). Utdelningarna ackumuleras och återinvesteras.

Denna ETF lanserades den 5 juni 2024 och har sin hemvist i Irland.

Investeringsmål

Amundi Prime All Country World UCITS ETF Acc strävar efter att så nära som möjligt replikera resultatet för Solactive GBS Global Markets Large & Mid Cap Index (””Index”) oavsett om trenden är stigande eller fallande. Delfondens mål är att uppnå en tracking error-nivå för delfonden och dess index som normalt inte överstiger 1 %.

Handla WEBN ETF

Amundi Prime All Country World UCITS ETF Acc (WEBN ETF) är en europeisk börshandlad fond. Denna fond handlas på flera olika börser, till exempel Deutsche Boerse Xetra.

Det betyder att det går att handla andelar i denna ETF genom de flesta svenska banker och Internetmäklare, till exempel DEGIRONordnet, Aktieinvest och Avanza.

Börsnoteringar

BörsValutaKortnamn
XETRAEURWEBN

Största innehav

Denna fond använder fysisk replikering för att spåra indexets prestanda.

NamnValutaVikt %Sektor
MICROSOFT CORPUSD4.62 %Informationsteknologi
APPLE INCUSD4.47 %Informationsteknologi
NVIDIA CORPUSD3.99 %Informationsteknologi
AMAZON.COM INCUSD2.47 %Sällanköpsvaror
META PLATFORMS INC-CLASS AUSD1.54 %Kommunikationstjänster
ALPHABET INC CL AUSD1.51 %Kommunikationstjänster
ALPHABET INC CL CUSD1.26 %Kommunikationstjänster
ELI LILLY & COUSD1.05 %Health Care
BROADCOM INCUSD1.04 %Informationsteknologi
TAIWAN SEMICONDUCTOR MANUFACTWD0.97 %Informationsteknologi

Innehav kan komma att förändras

Fortsätt läsa

Nyheter

Mar.25 crypto update, Research commentary on market turmoil, CIO Notes and ETP performance attribution

Publicerad

den

Mar.25 crypto update, Research commentary on market turmoil, CIO Notes and ETP performance attribution

A – Research commentaries from last week developments

  1. Markets reacted to Trump tariffs – Bitcoin stands

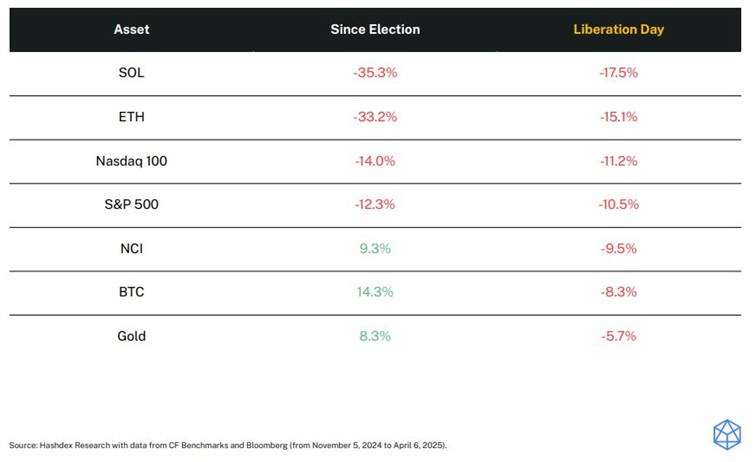
Global markets fell sharply after President Trump’s new 25% tariffs on Chinese imports. Stocks led the decline – the Nasdaq 100 is now down -14% since the election, and the S&P 500 -12.3%. Crypto reacted too, but not uniformly:

Altcoins such as SOL and ETH were hit hardest (down over 30% since November)

• Bitcoin and the Nasdaq Crypto Index (NCI) showed resilience, gaining +14.3% and +9.3%, respectively since Election

This kind of selloff tends to erase diversification — everything moves together. But it’s essential to take a longer view:

• Since Trump’s election, only three assets have consistently outperformed: Bitcoin, NCI, and gold.

• Last week, only gold outpaced BTC, confirming the role of digital assets as a strategic long-term allocation — even in volatile regimes.

  1. Regulatory tailwinds are building

The next phase of crypto decoupling could come from policy. In the US, the signals are turning positive:

• The STABLE Act advanced in Congress, with Trump urging swift approval

• A tokenized fund paid $4.17M in dividends last month, proving blockchain’s real-world income potential

• The SEC has launched a review of past crypto guidance — a move toward clearer rules and broader institutional comfort

Bottom line: In a week where most assets fell, crypto stood out. That’s not a coincidence — it’s a signal.

B – CIO Monthly Notes – Crypto’s Political Tailwinds Are Blowing Hard

• Following a week in Washington, our CIO outlines how crypto is gaining bipartisan traction in DC.

• Key takeaway: regulatory clarity is coming faster than expected, and institutions are taking note.

C – March 2025 ETP performance overview

As of 31/03/25 – Source: Hashdex and Bloomberg. Performances in USD.

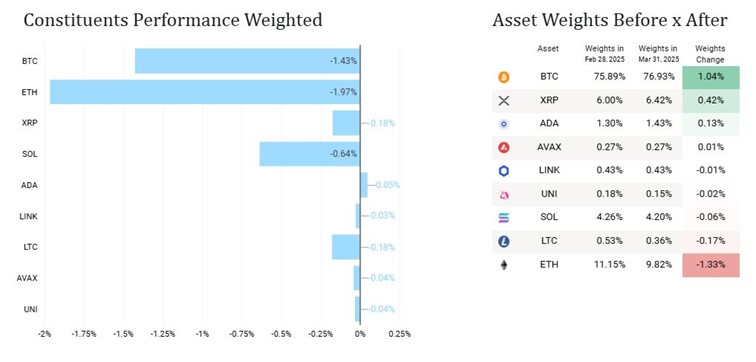
Hashdex Nasdaq Crypto Index ETP (HASH / HDX1) : March: -4.5% | YTD: -19%

Key drivers in March: Bitcoin and Ethereum

March Performance Attribution:

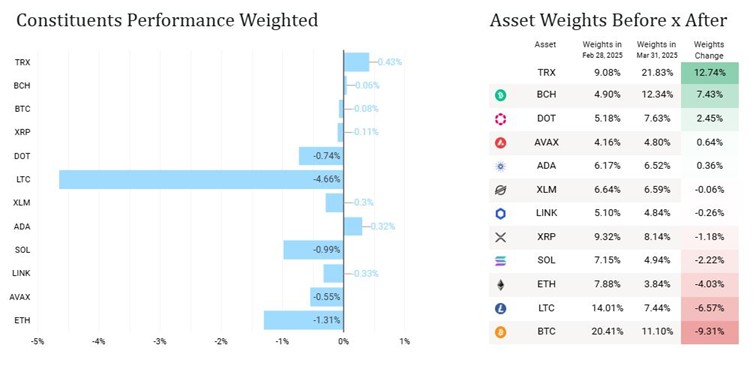
Hashdex Crypto Momentum Factor ETP (HAMO / HDXM): March: -8.5% | YTD: -22%

Key drivers in March: Litecoin, Ethereum and Solana

March Performance Attribution:

Hashdex Multi-Crypto Index ETPs

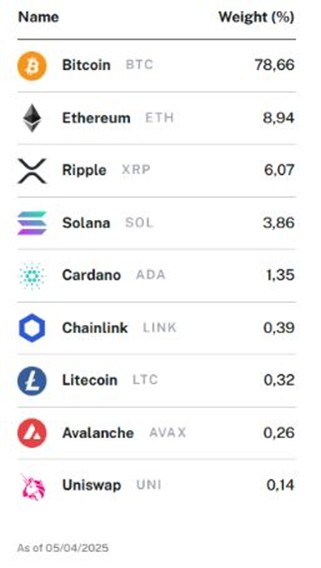
Hashdex Nasdaq Crypto Index ETP (HASH)

• Broad exposure to BTC, ETH, and major altcoins (SOL, XRP, ADA, etc)

• Quarterly rebalancing – evolutive, market cap-based allocation with no caps (weights and number of constituents)

• Largest crypto index ETP in Europe (+$300m AUM)

• ISIN: CH1184151731 | Tickers: HASH (SIX, Euronext) / HDX1 (Xetra)

• Tradable in USD, EUR, CHF, GBP
• Factsheet / Product page / Index Methodology

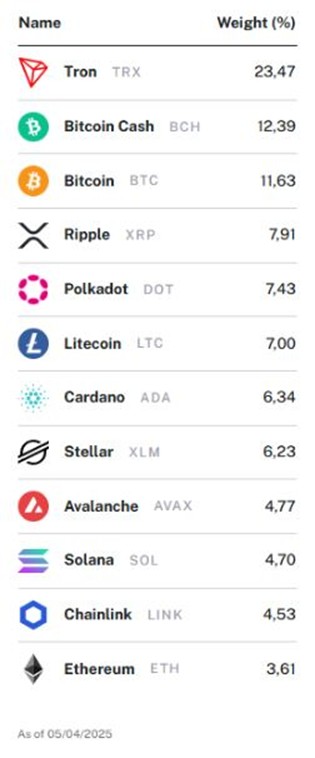
Hashdex Crypto Momentum Factor ETP (HAMO/HDXM )

• Momentum-based strategy with monthly rebalancing

• Designed to capture trends across large-cap crypto assets

• ISIN: CH1218734544 | Tickers: HAMO (SIX, Euronext) / HDXM (Xetra)

• Tradable in USD, EUR, CHF, GBP

• Factsheet / Product page / Index Methodology

Fortsätt läsa

Populära