
Nyheter
Is Solana Following Ethereum’s Footsteps?
• Mixed Inflationary Signals vs. Bitcoin’s Correction
• Ethereum’s Dencun Upgrade and its Impact on Layer 2s
• Solana Nearly Surpassing ATH Across Multiple 2021 Metrics
Mixed Inflationary Signals vs. Bitcoin’s Correction
The U.S. economy continues to send mixed signals after a period of stability in the first two months of the year. As indicated by the PPI, wholesale inflation has surged to almost double expectations at around 0.6% versus the projected 0.3%, signaling increased price pressures. However, U.S. jobs data revealed unexpected resilience in the labor market, with 209K job losses instead of the anticipated 218K. Conversely, monthly wage growth slowed to 0.1% in February, the lowest in two years. Thus, although wage inflation appears to be tapering off, job growth is outpacing expectations, adding further nuances to the Fed’s mission of taming inflation while avoiding a recession. Further, stubborn inflation suggests that the current high-interest rate regime will persist longer. This underscores the need to monitor changes closely, as tighter monetary policies dampen risk appetite in financial markets while lower rates increase the allure of asset classes such as crypto.
The latest macro data is also relevant in light of BTC’s growing correlation with the S&P 500 since the ETF launch, as it allows institutional investors to treat Bitcoin akin to a tech stock, thereby amplifying its susceptibility to macroeconomic uncertainty. This factor could explain the temporary pause in BTC’s momentum after reaching an ATH amidst the recent mixed data. Nevertheless, it’s important to remember that corrections and sideways movements are healthy for Bitcoin’s market structure as they help to build a sustainable growth trajectory. On the brighter side, we expect a further influx of institutional capital into BTC, especially as Registered Investment Advisors begin accelerating the ETF approval process after their typical due diligence period. For instance, Cetera, a wealth management platform with $160B in AuM, is amongst the first to approve four ETFs for their clients, signaling broader acceptance of crypto in traditional portfolios.
Figure 1: BTC’s Correlation with S&P500
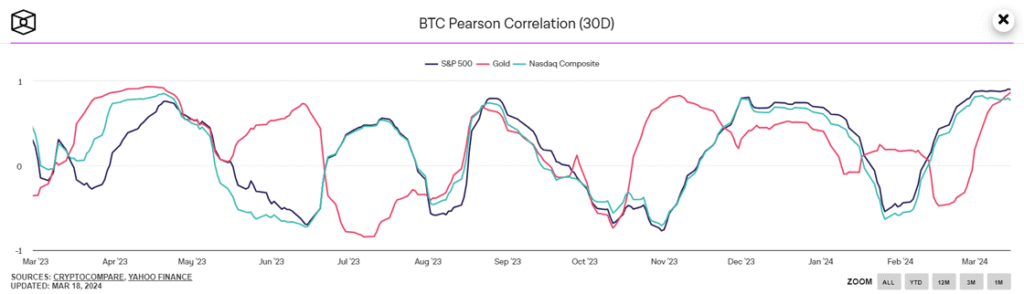
Source: The Block
Ethereum’s Dencun Upgrade and its Impact on Layer 2s
Ethereum’s long-anticipated Dencun upgrade has finally gone live on March 13. Following months of iteration to ensure that the network is ready to implement “blobs,” a new method for storing L2 transactions on Ethereum that would significantly reduce gas fees. Thus, although the Dencun upgrade doesn’t directly resolve Ethereum’s elevated fees, it alleviates the costs for scalability solutions built on top of it, such as Arbitrum and Optimism, by leveraging blobs. Less than one week following the upgrade, some Layer 2s already see more than a 90% decline in median gas fees from a month before, as shown in Figure 2. Nevertheless, we’ll continue monitoring closely, as if demand for blobs on Ethereum exceeds their storage or processing limit, the cost of utilizing them could escalate, leading to higher transaction fees across L2.
Figure 2: Dencun Upgrade Fee Comparison
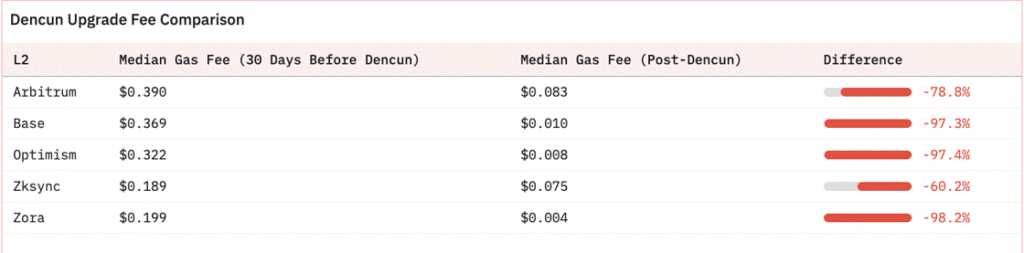
Source: 21co
Although the market is adjusting to the upgrade, Ethereum declined by approximately 13% over the past week, while Optimism and Arbitrum dropped by 28% and 22%, respectively. We anticipate this volatility to persist in the coming month as the broader market takes a pause, influenced by macroeconomic factors discussed earlier, following months of positive price trends. Nevertheless, it is healthy for the market to slow down and undergo a deleveraging event after Ethereum’s open interest surged to an all-time high of $12 billion, surpassing the peak of November 2021 by $500 million. This correction is beneficial for readjusting overextended positions, curbing excessive risk-taking, and mitigating heightened volatility, particularly as we approach Q3, which will witness significant events such as the historic BTC halving event in April and the deadline for the SEC’s decision on the ETH ETF applications.
Solana Nearly Surpassing ATH Across Multiple 2021 Metrics
The recent market rally driven by BTC has led to a surge in user activity on the Solana network, reaching its highest levels in two years. While this surge is primarily fueled by a frenzy surrounding meme coins like WIF and politically themed tokens such as ”Tremp” and ”Boden,” it highlights a growing preference for Solana among new and retail users who find Ethereum’s high costs prohibitive. While the recent Dencun upgrade is expected to change this dynamic for ETH L2s, transaction costs on Solana still remain significantly lower at a fraction of the cent, attracting a large influx of new users.
For example, in the first three months of 2024, the network saw a monthly all-time high of 12-13 million new users joining, compared to a monthly average of 11 million during the heightened activity during the LUNA collapse. Additionally, daily active users have surged to 1.4 million, approaching 2021 levels of two million, while the network is on track to process double the peak transactional volume of 2021, with February recording $100T and March witnessing $60T so far, surpassing the previous peak in November 2021 of $55T. Thus, with minimal transaction fees and a plethora of tokens—over 6,000 launched daily, as shown below in Figure 3—it provides a clearer explanation for SOL’s soaring demand as users rush to purchase the token to access the network’s on-chain ecosystem, creating a reflexive demand for the token, akin to the impact on ETH during the ICO craze of 2017. The recent speculation has now pushed Solana’s market cap, not price, to break its ATH, hovering around the $90B mark while explaining why the network’s dexes are logging five times the total volume seen at the end of the last bull cycle while outpacing incumbents like Uniswap V3 on Ethereum.
Figure 3: Total Number of New Solana-Based Tokens (SPL) Created on a Daily Basis
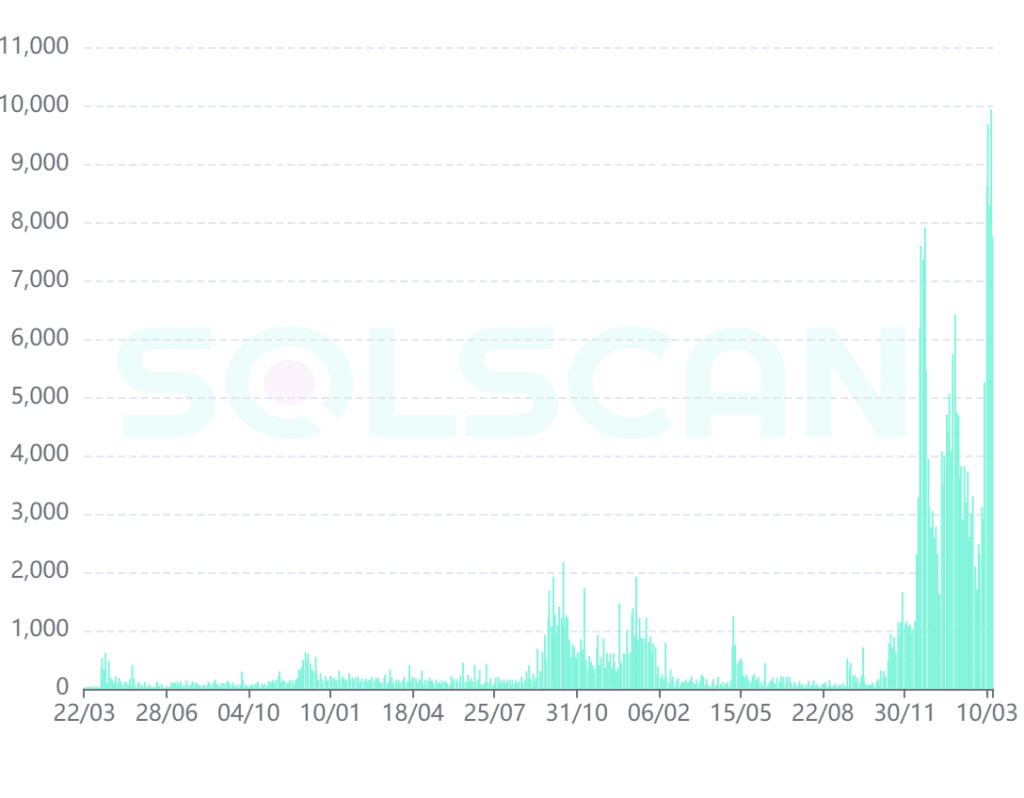
Source: Solscan
This Week’s Calendar
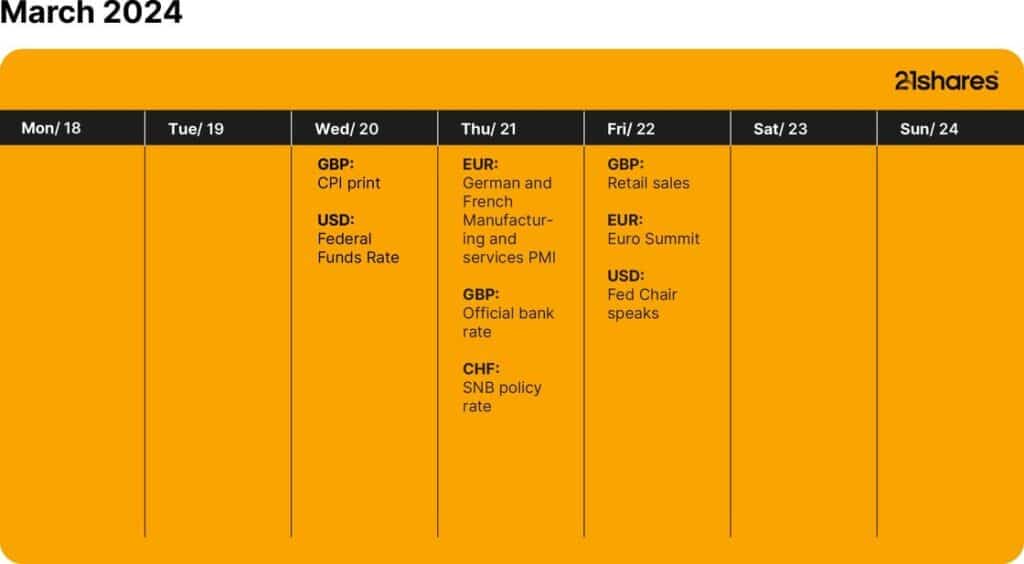
Source: Forex Factory, 21Shares
Research Newsletter
Each week the 21Shares Research team will publish our data-driven insights into the crypto asset world through this newsletter. Please direct any comments, questions, and words of feedback to research@21shares.com
Disclaimer
The information provided does not constitute a prospectus or other offering material and does not contain or constitute an offer to sell or a solicitation of any offer to buy securities in any jurisdiction. Some of the information published herein may contain forward-looking statements. Readers are cautioned that any such forward-looking statements are not guarantees of future performance and involve risks and uncertainties and that actual results may differ materially from those in the forward-looking statements as a result of various factors. The information contained herein may not be considered as economic, legal, tax or other advice and users are cautioned to base investment decisions or other decisions solely on the content hereof.


The investment environment in 2025 has been marked by increased uncertainty, including evolving trade dynamics involving the U.S. and rising geopolitical risks, which have weighed on overall market sentiment. Notably, though, gold has shone, surging past the symbolic $3,100 per ounce mark for the first time in history.
Gold has recently gained attention as investors seek potential hedges against rising inflation, currency fluctuations, and broader market volatility. Historical data suggests that both gold and gold mining equities have sometimes outperformed during periods of market stress, though such outcomes are not guaranteed and may vary depending on broader macroeconomic dynamics. The chart below displays historical episodes where gold and gold mining equities experienced relative strength during market corrections. However, such past performance should not be interpreted as a reliable indicator of future results.
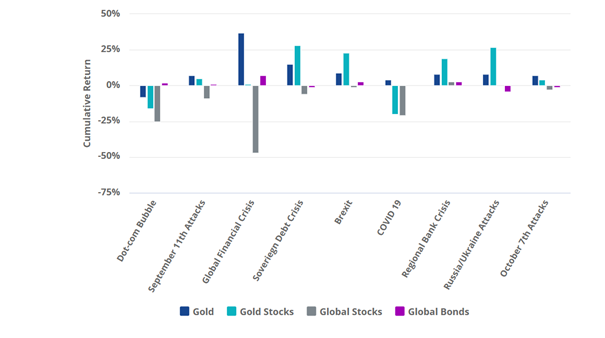
Source: VanEck, World Gold Council.
The early months of 2025 have seen a resurgence in gold mining stock interest, with the VanEck Gold Miners ETF (GDX) receiving significant capital inflows. These flows reflect changing investor sentiment but should not be viewed as a guarantee of future returns.
Improved management
While gold mining stocks are a play on the gold price, they are much more than that. In the past, gold mining companies indulged in wanton value destruction. During gold’s last bull market that ended in 2011, mining companies borrowed heavily to fund new developments and extract gold from low quality mines. After the gold price dropped, they were forced to announce write-downs.
But since then, they have learned to keep costs under control. Indeed, for more than 10 years gold mining companies’ costs have grown by far less than a gold price that’s at least doubled. Despite the sharp rise in gold prices, especially in post 2020, miners have lagged significantly, likely reflecting ongoing capital and operating challenges noted between 2011 and 2015. This divergence may suggest a potential value opportunity if mining equities eventually re-rate closer to gold’s performance. Nevertheless, this is an assumption and may not turn out to be true, as structural issues or market dynamics could continue to weigh on miners’ valuations.
Gold Miner Premium/Discount to Gold
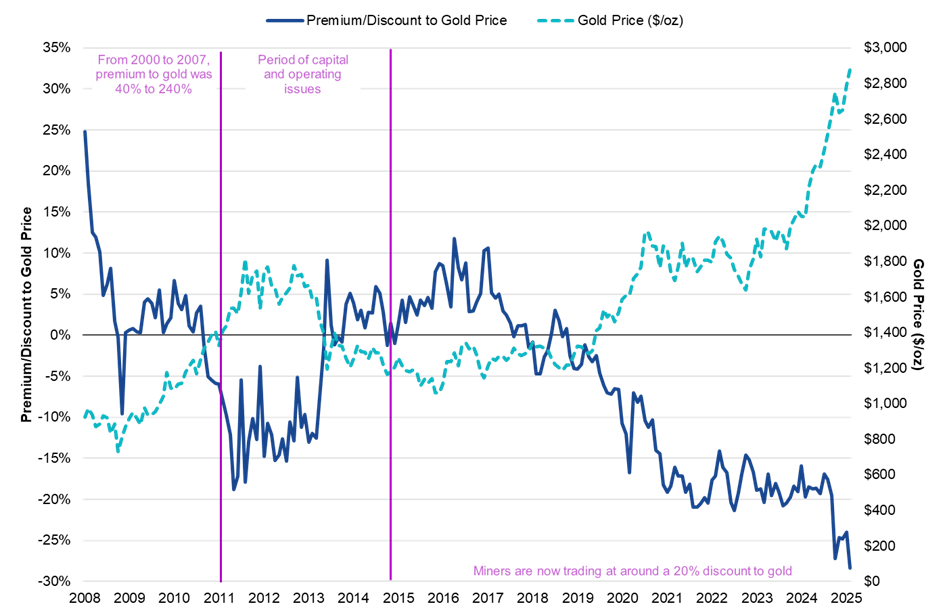
Source: Scotiabank. Data as February 2025.
Gold miners are expanding their profit margins, generating cash and embarking on share buy backs. What’s more, many have strong balance sheets. Yet still they trade at valuations below historical averages. Valuation metrics such as price-to-free cash flow (P/FCF) and price-to-earnings (P/E) ratios remain below the 12-month moving average.
Valuations are Still Below Long-Term Averages
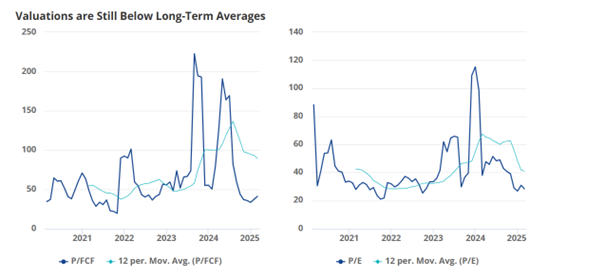
Source: Morningstar data.
Gold miners differentiate from gold because they are operating businesses influenced by company-specific factors such as management decisions, production efficiency, regulatory environments, and geopolitical risks. While gold is a passive asset driven by macroeconomic trends, miners add an additional layer of exposure to operational performance and cost structures.
A supportive macro backdrop
The performance of gold mining stocks is naturally influenced by the trajectory of gold prices. From a macroeconomic standpoint, factors such as inflation concerns and central bank policies continue to shape a cautiously optimistic outlook for gold, although the asset remains subject to volatility. Central banks continue to be net buyers, with 2023 marking a record year in terms of official sector demand. This trend has extended into 2024 and early 2025, underscoring institutional confidence in gold as a long-term store of value.
At the same time, the unfolding trade war is contributing to a more volatile global environment. These developments could support the case for gold and, by extension, gold mining equities. Moreover, recent efforts to improve transparency around global gold reserves, including audits of holdings in Fort Knox and London, have added credibility to the market, potentially reducing the perceived risk premium for miners.
Valuable portfolio diversification
From an investor’s perspective, gold mining stocks can be a useful diversifier in a broader equity portfolio, especially at a time of uncertainty for equity markets. Historically, gold mining stocks have exhibited a high sensitivity to changes in the price of gold, sometimes outperforming the metal itself during prolonged bull markets. However, they also tend to underperform during downturns, reflecting their leveraged exposure to gold price movements. Past performance is not indicative of future results. The table below shows the low correlation of the two VanEck gold miners UCITS ETFs with the MSCI World Index of global stock prices. This low correlation suggests that gold mining ETFs may perform differently than global equities, potentially helping to reduce overall portfolio volatility during periods of market stress. That said, they also carry equity-like risks, and investors should assess their portfolio objectives and risk tolerance accordingly.
Low Price Correlations with Stocks
| Investment | MSCI World | Gold Price | VanEck Junior Gold Miners ETF | VanEck Gold Miners ETF |
| MSCI World | 1.00 | |||
| Gold Price | 0.10 | 1.00 | ||
| VanEck Junior Gold Miners ETF | 0.38 | 0.76 | 1.00 | |
| VanEck Gold Miners ETF | 0.31 | 0.81 | 0.96 | 1.00 |
Source: Morningstar data.
A better way to play the rally?
When the VanEck Gold Miners UCITS ETF was introduced in 2015, it aimed to provide investors with a way to gain diversified exposure to gold mining equities. Early performance was tempered by concerns related to past capital discipline within the sector. Recent inflows into ETF may reflect renewed investor interest, although sentiment toward mining equities can remain sensitive to market and operational developments.
As gold glitters at a time of market volatility, there are good reasons to think gold miners may be a better way to play the rally. It should however be noted that while gold prices and mining companies are closely linked, investing in miners introduces additional layers of risk and complexity and investors should consider all the risk factors before investing.
IMPORTANT INFORMATION
This is marketing communication. Please refer to the prospectus of the UCITS and to the KID/KIID before making any final investment decisions. These documents are available in English and the KIDs/KIIDs in local languages and can be obtained free of charge at www.vaneck.com, from VanEck Asset Management B.V. (the “Management Company”) or, where applicable, from the relevant appointed facility agent for your country.
For investors in Switzerland: VanEck Switzerland AG, with registered office in Genferstrasse 21, 8002 Zurich, Switzerland, has been appointed as distributor of VanEck´s products in Switzerland by the Management Company. A copy of the latest prospectus, the Articles, the Key Information Document, the annual report and semi-annual report can be found on our website www.vaneck.com or can be obtained free of charge from the representative in Switzerland: Zeidler Regulatory Services (Switzerland) AG, Neudtadtgasse 1a, 8400 Winterthur, Switzerland. Swiss paying agent: Helvetische Bank AG, Seefeldstrasse 215, CH-8008 Zürich.
For investors in the UK: This is a marketing communication targeted to FCA regulated financial intermediaries. Retail clients should not rely on any of the information provided and should seek assistance from an IFA for all investment guidance and advice. VanEck Securities UK Limited (FRN: 1002854) is an Appointed Representative of Sturgeon Ventures LLP (FRN: 452811), which is authorised and regulated by the Financial Conduct Authority (FCA) in the UK, to distribute VanEck´s products to FCA regulated firms such as Independent Financial Advisors (IFAs) and Wealth Managers.
This information originates from VanEck (Europe) GmbH, which is authorized as an EEA investment firm under MiFID under the Markets in Financial Instruments Directive (“MiFiD). VanEck (Europe) GmbH has its registered address at Kreuznacher Str. 30, 60486 Frankfurt, Germany, and has been appointed as distributor of VanEck products in Europe by the Management Company. The Management Company is incorporated under Dutch law and registered with the Dutch Authority for the Financial Markets (AFM).
”The MSCI information may only be used for your internal use, may not be reproduced or redisseminated in any form and may not be used as a basis for or a component of any financial instruments or products or indices. None of the MSCI information is intended to constitute investment advice or a recommendation to make (or refrain from making) any kind of investment decision and may not be relied on as such. Historical data and analysis should not be taken as an indication or guarantee of any future performance analysis, forecast or prediction. The MSCI information is provided on an “as is” basis and the user of this information assumes the entire risk for any use made of this information. MSCI, each of its affiliates and each other person involved in or related to compiling, computing or creating any MSCI information (collectively, the “MSCI Parties”), expressly disclaims all warranties (including, without limitation, any warranties of originality, accuracy, completeness, timeliness, noninfringement, merchantability and fitness for a particular purpose) with respect to this information. Without limiting any of the foregoing, in no event shall any MSCI Party have any liability for any direct, indirect, special, incidental, punitive, consequential (including, without limitation, lost profits) or any other damages. It is not possible to invest directly in an index.”
This material is only intended for general and preliminary information and shall not be construed as investment, legal or tax advice. VanEck (Europe) GmbH and its associated and affiliated companies (together “VanEck”) assume no liability with regards to any investment, divestment or retention decision on the basis of this information. The views and opinions expressed are those of the author(s) but not necessarily those of VanEck. Opinions are current as of the publication date and are subject to change with market conditions. Information provided by third party sources is believed to be reliable and have not been independently verified for accuracy or completeness and cannot be guaranteed.
VanEck Gold Miners UCITS ETF (the ”ETF”) is a sub-fund of VanEck UCITS ETFs plc, an open-ended variable capital umbrella investment company with limited liability between sub-funds. The ETF is registered with the Central Bank of Ireland, passively managed and tracks an equity index. Investing in the ETF should be interpreted as acquiring shares of the ETF and not the underlying assets.
VanEck Junior Gold Miners UCITS ETF (the ”ETF”) is a sub-fund of VanEck UCITS ETFs plc, an open-ended variable capital umbrella investment company with limited liability between sub-funds. The ETF is registered with the Central Bank of Ireland, passively managed and tracks an equity index. Investing in the ETF should be interpreted as acquiring shares of the ETF and not the underlying assets.
Investing is subject to risk, including the possible loss of principal. Investors must buy and sell units of the UCITS on the secondary market via a an intermediary (e.g. a broker) and cannot usually be sold directly back to the UCITS. Brokerage fees may incur. The buying price may exceed, or the selling price may be lower than the current net asset value. The indicative net asset value (iNAV) of the UCITS is available on Bloomberg. The Management Company may terminate the marketing of the UCITS in one or more jurisdictions. The summary of the investor rights is available in English at: complaints-procedure.pdf (vaneck.com). For any unfamiliar technical terms, please refer to ETF Glossary | VanEck.
No part of this material may be reproduced in any form, or referred to in any other publication, without express written permission of VanEck.
© VanEck (Europe) GmbH ©VanEck Switzerland AG © VanEck Securities UK Limited


iShares noterar fond för flyg- och försvarssektorn på Xetra

8RMY ETF köper bara aktier i europeiska försvarsföretag

Are Gold Mining Equities Regaining Attention Amid Rising Gold Prices?

Fem spanska fonder som har ökat med +12% under 2025

ASRP ETF ett spel på medtech företag världen över
Crypto Market Risks & Opportunities: Insights on Bybit Hack, Bitcoin, and Institutional Adoption

Montrose storsatsning på ETFer fortsätter – lanserar Sveriges första globala ETF med hävstång

Svenskarna har en ny favorit-ETF

MONTLEV, Sveriges första globala ETF med hävstång

Sju börshandlade fonder som investerar i försvarssektorn
-

 Nyheter4 veckor sedan
Crypto Market Risks & Opportunities: Insights on Bybit Hack, Bitcoin, and Institutional Adoption
-
 Nyheter3 veckor sedan
Montrose storsatsning på ETFer fortsätter – lanserar Sveriges första globala ETF med hävstång
-
 Nyheter4 veckor sedan
Svenskarna har en ny favorit-ETF
-
 Nyheter3 veckor sedan
MONTLEV, Sveriges första globala ETF med hävstång
-
 Nyheter3 veckor sedan
Sju börshandlade fonder som investerar i försvarssektorn
-

 Nyheter3 veckor sedan
Världens första europeiska försvars-ETF från ett europeiskt ETF-företag lanseras på Xetra och Euronext Paris
-

 Nyheter3 veckor sedan
Europeisk försvarsutgiftsboom: Viktiga investeringsmöjligheter mitt i globala förändringar
-

 Nyheter2 veckor sedan
21Shares bildar exklusivt partnerskap med House of Doge för att lansera Dogecoin ETP i Europa