
Nyheter
Is Gold’s Slumber Over?
Is Gold’s Slumber Over?
Intro: ”Golden slumbers fill your eyes. Smiles awake you when you rise.”
Gold prices climbed from $1,061 an ounce on January 1, 2016 to $1,263 an ounce (an intraday high) on February 11, a 19% increase in just six weeks. As Paul McCartney sang on Abbey Road’s ”Golden Slumbers,” gold bullion and its devoted investors appeared to be waking from a nearly five-year bear market slumber with well-deserved grins. Since February 11 gold prices have retreated slightly, and have been trading within a range of $1,200 to $1,240 an ounce (at this writing).
The question remains: Is Gold’s Slumber Over?
We think so, although we expect price volatility to continue. Joe Foster explains why.
Renewed Enthusiasm for Gold
It’s pretty clear that financial markets in January helped to remind investors around the globe why perhaps virtually every portfolio should have an allocation to gold, both as a diversifier and a hedge against financial risk. Escalating geopolitical turmoil, currency issues, and slow growth are all potential risks that threaten economic development globally.
Importantly, markets are beginning to take action. Gold shares have been in one of their worst bear markets, but are the best performers this year thus far. As long-term gold investors, we have had a watchful eye out for the first glimmer of a turn in sentiment. Technical trends and fundamental drivers have shown significant improvement. It may be time to polish off the case for gold mining stocks as 2016 might be the year prices reverse course.
Despite our renewed enthusiasm for gold, we believe that bullion prices must not only break through $1,225 an ounce, but also remain above the $1,200 threshold in order to support a definitive breakout. It looks as if the markets will continue to embrace gold in the current environment and perhaps we can look back at the December $1,046 price as the bottom of the gold bear market. We might also look back on the December 16 Federal Reserve (”Fed”) rate increase as the straw that broke the camel’s back, triggering unforeseen risks to the global financial system.
Negative Rates, Loss of Confidence Good for Gold
Most of us don’t need reminding that low and/or negative real interest rates are generally good for gold. That said, it will become increasingly important to watch the global trend toward low, and even negative, interest rates. Negative rates have become more common in the Eurozone and Japan, and there is currently around $600 trillion of government debt around the world with a negative yield. And, while it may seem far-fetched for the U.S., the Fed is telling banks to prepare for the possibility of negative rates. Undeniably, the U.S. economy continues to appear vulnerable and consequently, the market and now the Fed are increasingly adopting a cautious view for 2016.
Gold Bullion Prices versus Real Interest Rates: 1970 to 2015

(Click to enlarge)
Source: Bloomberg, data as of 02/02/16.
Is this the beginning of a loss of confidence in central banks? The banks’ inability to generate normal economic growth or inflation is certainly cause for concern for many investors. As stated by John Mauldin in his popular blog, Thoughts from the Frontline, ”Clearly, QE [quantitative easing] has not worked …. if out-of-control borrowing was the original problem, then QE as a solution is kind of like drinking more whiskey in order to sober up. And if you reduce the earnings of those who are savers so that they are no longer able to spend, the whole purpose of the original project—to foster economic growth—is defeated.” Historically, gold and gold shares have acted as a safe haven during periods of low confidence in the world’s financial systems (a “safe haven” is an investment that is expected to retain its value or even increase its value in times of market turbulence).
Mining Shares Regain Their Mojo
Operating costs at mining companies rose drastically during the recent bull market, seriously impacting profitability. Since the start of this current market downturn, however, some positive changes have taken place in the gold mining industry. We believe that the industry is in the best shape it’s been in for a long time.
The most elementary fundamental support for a positive outlook for gold stocks is the impact of deflation on the cost of labor, material, and services. Costs have been falling since 2012. Global producers have reported that total cash costs for the first nine months of 2015 fell by 7% year-on-year, from a total of $733 an ounce to $680 per ounce.1 Average all-in mining costs are now below $1,000 per ounce. Gold miners have historically benefited in deflationary periods from declining costs of labor and materials. In the 1930s, shares of Homestake Mines (the major gold equity of the time) rose significantly as the company was able to expand profits during this period due to its falling cost structure. Shares of Homestake Mines increased from $65 in 1929 to $544 in 1936.2
These reductions in costs, improvements in efficiency, as well as deep declines in the currencies of commodity-producing countries, have all helped gold companies generate cash flow and maximize profit—restoring the viability of the sector.
Technicals and Leverage
Gold share valuations are at multi-decade lows and currently have technical support. The current bear market that began in late 2011 has eclipsed the duration of the average bear market since 1970 by five months, and prices are nearly 75% off their five-year highs.3 However, price levels have begun to turn and gold shares have outpaced gold thus far in 2016.
Many investors use gold stocks to gain leveraged exposure to gold in a rising gold price environment. It’s all about potential earnings leverage; as the gold price increases, the change in a company’s profitability can outpace the change in the gold price. We’ve just come off a one-month period during which the expected outperformance of gold stocks relative to gold did not materialize, but we do not expect this trend to continue. Gold shares should offer their highest leverage to gold when the price is close to the cost of production, as is now the case. So, unless costs increase at the same time as the price of gold (as in 2011 and 2012), it makes sense that equities should outperform gold during rising gold prices as has been the case over the last several years.
Gold Equities: Leveraged Exposure to Gold

(Click to enlarge)
Source: Bloomberg data as of 2/9/16.
For a deeper analysis, please take a look at our presentation, The Case for Gold in 2016.
by Joe Foster, Portfolio Manager and Strategist
With more than 30 years of gold industry experience, Foster began his gold career as a boots on the ground geologist, evaluating mining exploration and development projects. Foster is Portfolio Manager and Strategist for the Gold and Precious Metals strategy.
IMPORTANT DISCLOSURE
1Source: GFMS, Thomson Reuters. Data as of September 30, 2015.
2Source: Casey Research.
3Source: Bloomberg, ICE Benchmark Administration Ltd, World Gold Council. Data as of January 2016.
This content is published in the United States for residents of specified countries. Investors are subject to securities and tax regulations within their applicable jurisdictions that are not addressed on this content. Nothing in this content should be considered a solicitation to buy or an offer to sell shares of any investment in any jurisdiction where the offer or solicitation would be unlawful under the securities laws of such jurisdiction, nor is it intended as investment, tax, financial, or legal advice. Investors should seek such professional advice for their particular situation and jurisdiction.


Since U.S. President Donald Trump announced tariffs on April 2, termed ”Liberation Day,” global markets have experienced significant volatility. The S&P 500 shed $5.83 trillion in market value over just four days, marking its steepest drop since the 1950s. Asian markets saw their worst session since 2008, reflecting widespread fears of an economic slowdown.
The U.S. 10-year Treasury yields initially fell below 4% as investors sought safety, but by April 8-9, they surged to a seven-week high of 4.515%. This spike, driven by bond market sell-offs potentially from basis trading or China’s strategic moves to pressure U.S. negotiations, suggests a precarious economic situation rather than risk-on sentiment.
On April 9, President Trump announced a 90-day pause on tariffs for most countries (excluding China, where tariffs jumped to 145%) in an effort to give markets time to absorb the changes and calm volatility. The move sparked a broad rally, with the S&P 500 surging 9.5% for its best day since 2008 and Bitcoin rebounding above $80,000 after a turbulent stretch.
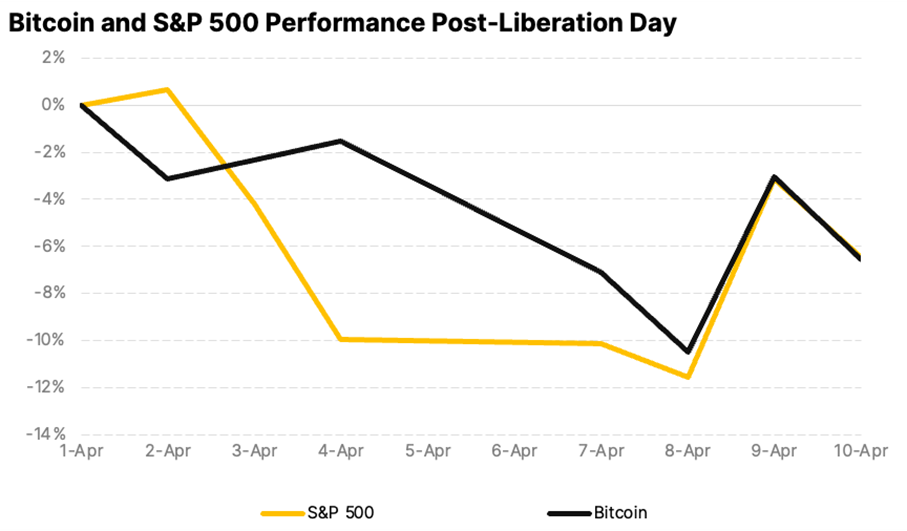
Bitcoin is macro now
Despite persistent concerns about crypto volatility, Bitcoin’s price over the past two weeks has closely mirrored the S&P 500 and has actually been less volatile. This alignment reflects Bitcoin’s growing maturity as an asset class and highlights its resilience. As a highly liquid and accessible asset, it continues to attract investors looking for relative value in turbulent markets.
Sentiment shifts toward crypto ETFs
Spot Bitcoin ETFs recorded $700 million in outflows, while Ethereum ETFs lost $400 million since March, marking a sharp reversal after nine consecutive months of inflows. The pullback points to growing institutional caution amid broader macro uncertainty. Still, on-chain data reveals that long-term holders have been steadily accumulating since January lows, signaling continued confidence in the asset class.
Macroeconomic uncertainty takes center stage
The latest U.S. CPI print came in at 2.4%, which was lower than expected. A rate cut in May still seems premature as markets assess the full impact of new protectionist measures. Federal Reserve Chair Jerome Powell has warned that tariffs could raise inflation while slowing growth. As a result, the probability of three rate cuts in 2025 now exceeds 60%. Declining yields may be an early signal of future monetary easing, which could favor risk assets like crypto if economic pressures intensify.
Bitcoin: Dollar’s ally or alternative?
In the face of policy uncertainty, the debate around the U.S. dollar’s reserve currency status is gaining momentum. With its decentralized and censorship-resistant design, Bitcoin is emerging as both a potential complement and challenger to the dollar, especially as the U.S. increasingly wields its currency as a geopolitical tool through tariffs and sanctions.
Meanwhile, Bitcoin’s fundamentals remain solid. Hashrate is at all-time highs, regulatory clarity is improving, and long-term holders continue to accumulate. With prices consolidating above $80K, the current correction may offer a strategic opportunity for investors positioning for the next leg of growth, particularly as the macro picture evolves.
Research Newsletter
Each week the 21Shares Research team will publish our data-driven insights into the crypto asset world through this newsletter. Please direct any comments, questions, and words of feedback to research@21shares.com
Disclaimer
The information provided does not constitute a prospectus or other offering material and does not contain or constitute an offer to sell or a solicitation of any offer to buy securities in any jurisdiction. Some of the information published herein may contain forward-looking statements. Readers are cautioned that any such forward-looking statements are not guarantees of future performance and involve risks and uncertainties and that actual results may differ materially from those in the forward-looking statements as a result of various factors. The information contained herein may not be considered as economic, legal, tax or other advice and users are cautioned to base investment decisions or other decisions solely on the content hereof.


BE28 ETF företagsobligationer med förfall 2028 och inget annat

Trump’s trade war puts Bitcoin in the spotlight

YCSH ETF är en satsning på den europeiska dagslåneräntan

Crypto’s stress-tested resilience
BlackRock tar iShares S&P 500 3% Capped UCITS ETF till Europa

Fonder som ger exponering mot försvarsindustrin
Crypto Market Risks & Opportunities: Insights on Bybit Hack, Bitcoin, and Institutional Adoption

Warren Buffetts råd om vad man ska göra när börsen kraschar

Montrose storsatsning på ETFer fortsätter – lanserar Sveriges första globala ETF med hävstång

Svenskarna har en ny favorit-ETF
-
 Nyheter4 veckor sedan
Fonder som ger exponering mot försvarsindustrin
-

 Nyheter3 veckor sedan
Crypto Market Risks & Opportunities: Insights on Bybit Hack, Bitcoin, and Institutional Adoption
-
 Nyheter3 veckor sedan
Warren Buffetts råd om vad man ska göra när börsen kraschar
-
 Nyheter2 veckor sedan
Montrose storsatsning på ETFer fortsätter – lanserar Sveriges första globala ETF med hävstång
-
 Nyheter2 veckor sedan
Svenskarna har en ny favorit-ETF
-

 Nyheter4 veckor sedan
HANetf lanserar Europa-fokuserad försvars-ETF
-

 Nyheter2 veckor sedan
MONTLEV, Sveriges första globala ETF med hävstång
-

 Nyheter3 veckor sedan
Fastställd utdelning i MONTDIV mars 2025