
Nyheter
Is Gold’s Slumber Over?
Is Gold’s Slumber Over?
Intro: ”Golden slumbers fill your eyes. Smiles awake you when you rise.”
Gold prices climbed from $1,061 an ounce on January 1, 2016 to $1,263 an ounce (an intraday high) on February 11, a 19% increase in just six weeks. As Paul McCartney sang on Abbey Road’s ”Golden Slumbers,” gold bullion and its devoted investors appeared to be waking from a nearly five-year bear market slumber with well-deserved grins. Since February 11 gold prices have retreated slightly, and have been trading within a range of $1,200 to $1,240 an ounce (at this writing).
The question remains: Is Gold’s Slumber Over?
We think so, although we expect price volatility to continue. Joe Foster explains why.
Renewed Enthusiasm for Gold
It’s pretty clear that financial markets in January helped to remind investors around the globe why perhaps virtually every portfolio should have an allocation to gold, both as a diversifier and a hedge against financial risk. Escalating geopolitical turmoil, currency issues, and slow growth are all potential risks that threaten economic development globally.
Importantly, markets are beginning to take action. Gold shares have been in one of their worst bear markets, but are the best performers this year thus far. As long-term gold investors, we have had a watchful eye out for the first glimmer of a turn in sentiment. Technical trends and fundamental drivers have shown significant improvement. It may be time to polish off the case for gold mining stocks as 2016 might be the year prices reverse course.
Despite our renewed enthusiasm for gold, we believe that bullion prices must not only break through $1,225 an ounce, but also remain above the $1,200 threshold in order to support a definitive breakout. It looks as if the markets will continue to embrace gold in the current environment and perhaps we can look back at the December $1,046 price as the bottom of the gold bear market. We might also look back on the December 16 Federal Reserve (”Fed”) rate increase as the straw that broke the camel’s back, triggering unforeseen risks to the global financial system.
Negative Rates, Loss of Confidence Good for Gold
Most of us don’t need reminding that low and/or negative real interest rates are generally good for gold. That said, it will become increasingly important to watch the global trend toward low, and even negative, interest rates. Negative rates have become more common in the Eurozone and Japan, and there is currently around $600 trillion of government debt around the world with a negative yield. And, while it may seem far-fetched for the U.S., the Fed is telling banks to prepare for the possibility of negative rates. Undeniably, the U.S. economy continues to appear vulnerable and consequently, the market and now the Fed are increasingly adopting a cautious view for 2016.
Gold Bullion Prices versus Real Interest Rates: 1970 to 2015

(Click to enlarge)
Source: Bloomberg, data as of 02/02/16.
Is this the beginning of a loss of confidence in central banks? The banks’ inability to generate normal economic growth or inflation is certainly cause for concern for many investors. As stated by John Mauldin in his popular blog, Thoughts from the Frontline, ”Clearly, QE [quantitative easing] has not worked …. if out-of-control borrowing was the original problem, then QE as a solution is kind of like drinking more whiskey in order to sober up. And if you reduce the earnings of those who are savers so that they are no longer able to spend, the whole purpose of the original project—to foster economic growth—is defeated.” Historically, gold and gold shares have acted as a safe haven during periods of low confidence in the world’s financial systems (a “safe haven” is an investment that is expected to retain its value or even increase its value in times of market turbulence).
Mining Shares Regain Their Mojo
Operating costs at mining companies rose drastically during the recent bull market, seriously impacting profitability. Since the start of this current market downturn, however, some positive changes have taken place in the gold mining industry. We believe that the industry is in the best shape it’s been in for a long time.
The most elementary fundamental support for a positive outlook for gold stocks is the impact of deflation on the cost of labor, material, and services. Costs have been falling since 2012. Global producers have reported that total cash costs for the first nine months of 2015 fell by 7% year-on-year, from a total of $733 an ounce to $680 per ounce.1 Average all-in mining costs are now below $1,000 per ounce. Gold miners have historically benefited in deflationary periods from declining costs of labor and materials. In the 1930s, shares of Homestake Mines (the major gold equity of the time) rose significantly as the company was able to expand profits during this period due to its falling cost structure. Shares of Homestake Mines increased from $65 in 1929 to $544 in 1936.2
These reductions in costs, improvements in efficiency, as well as deep declines in the currencies of commodity-producing countries, have all helped gold companies generate cash flow and maximize profit—restoring the viability of the sector.
Technicals and Leverage
Gold share valuations are at multi-decade lows and currently have technical support. The current bear market that began in late 2011 has eclipsed the duration of the average bear market since 1970 by five months, and prices are nearly 75% off their five-year highs.3 However, price levels have begun to turn and gold shares have outpaced gold thus far in 2016.
Many investors use gold stocks to gain leveraged exposure to gold in a rising gold price environment. It’s all about potential earnings leverage; as the gold price increases, the change in a company’s profitability can outpace the change in the gold price. We’ve just come off a one-month period during which the expected outperformance of gold stocks relative to gold did not materialize, but we do not expect this trend to continue. Gold shares should offer their highest leverage to gold when the price is close to the cost of production, as is now the case. So, unless costs increase at the same time as the price of gold (as in 2011 and 2012), it makes sense that equities should outperform gold during rising gold prices as has been the case over the last several years.
Gold Equities: Leveraged Exposure to Gold

(Click to enlarge)
Source: Bloomberg data as of 2/9/16.
For a deeper analysis, please take a look at our presentation, The Case for Gold in 2016.
by Joe Foster, Portfolio Manager and Strategist
With more than 30 years of gold industry experience, Foster began his gold career as a boots on the ground geologist, evaluating mining exploration and development projects. Foster is Portfolio Manager and Strategist for the Gold and Precious Metals strategy.
IMPORTANT DISCLOSURE
1Source: GFMS, Thomson Reuters. Data as of September 30, 2015.
2Source: Casey Research.
3Source: Bloomberg, ICE Benchmark Administration Ltd, World Gold Council. Data as of January 2016.
This content is published in the United States for residents of specified countries. Investors are subject to securities and tax regulations within their applicable jurisdictions that are not addressed on this content. Nothing in this content should be considered a solicitation to buy or an offer to sell shares of any investment in any jurisdiction where the offer or solicitation would be unlawful under the securities laws of such jurisdiction, nor is it intended as investment, tax, financial, or legal advice. Investors should seek such professional advice for their particular situation and jurisdiction.


President Trump announced a highly aggressive tariff package—one with broad macroeconomic implications—and global markets reacted sharply. In this environment of heightened volatility, we urge investors to maintain perspective, just as they should when prices are volatile to the upside (e.g., last year’s post-election rally).
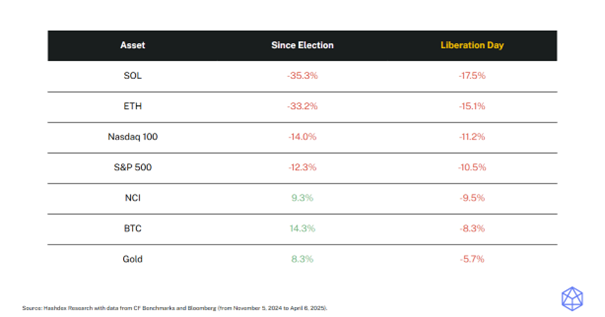
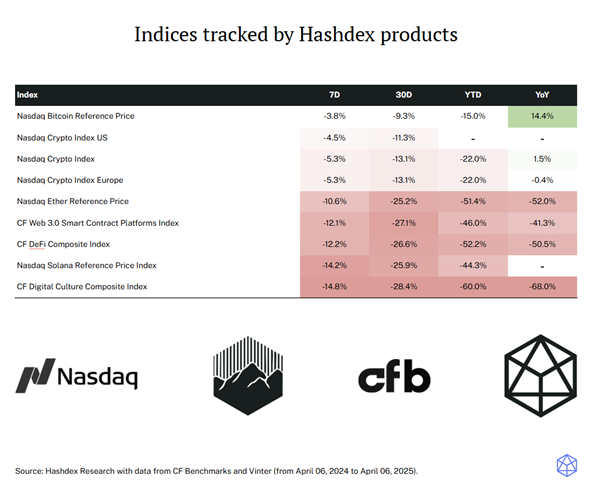
Notably, since the election, bitcoin and the Nasdaq Crypto Index have outperformed gold, the S&P 500, and Nasdaq 100. Even in the wake of the tariffs, only gold has outpaced bitcoin and the NCI—highlighting the relative strength of digital assets amid global market declines.
Market Highlights
Stablecoin legislation advances in US
The House Financial Services Committee voted to advance a monumental bill to regulate stablecoins, the STABLE Act, following the Senate Banking Committee approval of similar legislation earlier this year.
President Trump has said he wants stablecoin legislation approved by Congress before its August recess, reinforcing the new administration’s focus on establishing clear crypto regulation.
Tokenized fund sets dividend benchmark
BlackRock’s BUIDL paid an estimated $4.17 million in monthly dividends during March.
This highlights the potential of crypto to create attractive investment instruments, such as tokenized funds, which stood out this month paying massive dividends and setting a new benchmark for the class.
SEC chair orders review of crypto guidance
Acting SEC Chair Mark T. Uyeda ordered a review of past staff guidance on crypto, including risk warnings and interpretations of the Howey test.
This move, like others before, signals a broader shift toward a more open regulatory approach, potentially strengthening the presence of bitcoin and other digital assets in the US in the near future.
Market Metrics
The NCITM constituents had another negative week, with only XRP (-7.0%) and BTC (-3.8%) avoiding double-digit losses. The overall NCITM decline of -5.2% was cushioned by BTC’s relative resilience, as it performed better as a store-of-value asset. However, the drop still reflects a broader risk-off sentiment across all markets, driven by Trump’s tariff policies and growing macroeconomic uncertainties that are prompting investors to reassess their positions.
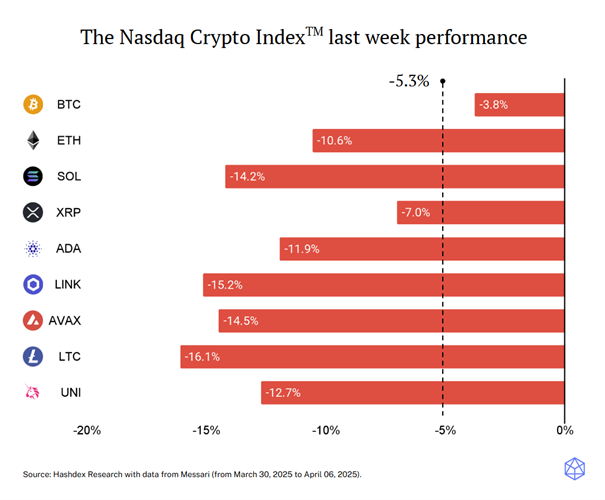
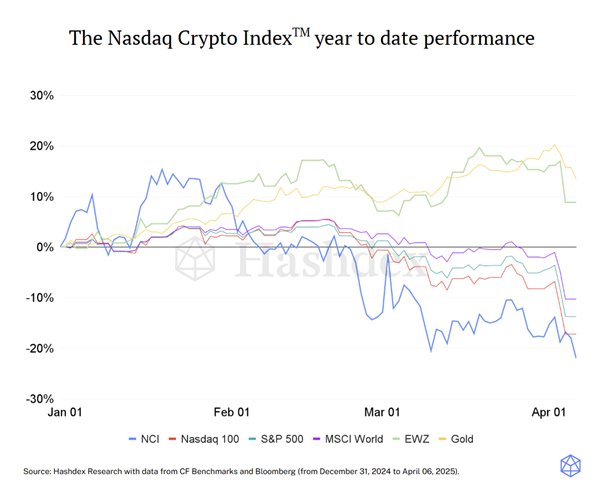
This week, the NCITM fell -5.3%, narrowing the gap with traditional indices such as the Nasdaq 100 (-9.8%) and S&P 500 (-9.1%) which experienced sharper losses following Trump’s tariff announcements. BTC (-3.8%) performed similarly to gold (-3.3%), though gold remains the top-performing asset class year-to-date. The week reinforced the risk-off sentiment, with investors broadly retreating from risk assets. Still, it also highlighted crypto’s growing relevance, as the most volatile asset class managed to outperform traditional markets in a stressed environment.


WEL8 ETF är en satsning på globala finansföretag

Tariffs spark turmoil: BTC holds its ground

JMES ETF en aktivt förvaltad fond från JPMorgan

Världens första europeiska försvars-ETF från ett europeiskt ETF-företag lanseras på Xetra och Euronext Paris

BSE7 ETF investerar i företagsobligationer med förfall 2027

Fonder som ger exponering mot försvarsindustrin

WisdomTree lanserar europeisk försvarsfond.

Warren Buffetts råd om vad man ska göra när börsen kraschar

De bästa börshandlade fonderna för tyska utdelningsaktier

Trumps återkomst får europeiska aktier att rusa
-
 Nyheter2 veckor sedan
Fonder som ger exponering mot försvarsindustrin
-
 Nyheter4 veckor sedan
WisdomTree lanserar europeisk försvarsfond.
-
 Nyheter2 veckor sedan
Warren Buffetts råd om vad man ska göra när börsen kraschar
-
 Nyheter3 veckor sedan
De bästa börshandlade fonderna för tyska utdelningsaktier
-
 Nyheter4 veckor sedan
Trumps återkomst får europeiska aktier att rusa
-

 Nyheter1 vecka sedan
Svenskarna har en ny favorit-ETF
-

 Nyheter1 vecka sedan
Crypto Market Risks & Opportunities: Insights on Bybit Hack, Bitcoin, and Institutional Adoption
-

 Nyheter3 veckor sedan
HANetf lanserar Europa-fokuserad försvars-ETF