
Nyheter
Golds Breakout Continues in February
Gold and Precious Metals – Golds Breakout Continues in February by Joe Foster, Portfolio Manager and Strategist. With more than 30 years of gold industry experience, Foster began his gold career as a boots on the ground geologist, evaluating mining exploration and development projects. Foster is Portfolio Manager and Strategist for the Gold and Precious Metals strategy.
Golds Breakout Continues in February
For the month ended February 29, 2016
Gold’s Bear Market is Over
We are willing to declare the gold bear market over. Is this the beginning of a new bull? Time will tell.
Since the Federal Reserve (the ”Fed”) raised the targeted federal funds rate on December 16, a number of changes have occurred in the markets that lead us to believe that one of the longest and deepest bear markets in the history of gold and gold equities may be over.
These changes include:
• Waning conviction in the market regarding further Fed rate increases.
• The U.S. dollar’s rise appears to have stalled.
• Volatility and weakness in U.S. stock markets.
• Strong gold prices despite seasonal weakness in Chinese demand.
• Strong gold prices as oil and commodities have sunk to new lows.
• Tremendous inflows to gold bullion exchange traded products (ETPs) and gold futures.
• Technical breakout from an established downtrend.
Gold advanced $120.57 (10.8%) to $1,238.74 per ounce in February and is up $177.32 (16.7%) for the year [as of 2/29/16].
Growing Concerns About Global Financial Risks
Economic headwinds have escalated, from local occurrences in Asia and Europe to global concerns that now include the United States. The Institute for Supply Management’s (”ISM”) Non-Manufacturing Index fell more than expected in January and was weak in February as well. The U.S. has been in a manufacturing recession and the ISM reports suggest that the services sector, which makes up the bulk of the economy, is beginning to weaken.
Negative Interest Rates May Increase Gold’s Appeal
Worries about systemic financial risk have also escalated due to many European countries and the Bank of Japan employing negative interest rates on certain reserves. There are now trillions of dollars’ worth of sovereign bonds that trade at negative yields. Fed Chair Janet Yellen said recently that the Fed is evaluating whether negative rates are an option for monetary policy in the U.S. Meanwhile the president of the European Central Bank (”ECB”) has said the ECB is looking at expanding its stimulus. The Governor of the Bank of Japan (”BOJ”) stated last summer, ”If we judge that existing measures in the tool kit are not enough to achieve the goal, what we have to do is to devise new tools, rather than give up the goal.” If negative rates work their way into commercial deposits, it might undermine money market funds, pension funds, and the insurance and banking industries.
Negative rates may also increase gold’s appeal, as gold effectively has a better yield at 0% than negative rate accounts. The Wall Street Journal reports that in the month after the BOJ’s negative rate announcement, sales of personal safes rose as much as 250% in some stores. What we believe markets are telling central bankers in 2016 is that radical monetary policies have not produced positive results and that further financial engineering risks bringing down the financial system. So far this year, because of these concerns, gold has supplanted the U.S. dollar as the preferred safe haven investment.
South Africa Stands Out Among Gold Shares
Gold stocks are showing the leverage we expect in a positive gold market. The NYSE Gold Miners Index (GDMNTR) gained 36.1% in February while the Market Vectors Junior Gold Miners Index (MVGDXJTR) advanced 35.0%. While nearly all gold stocks have seen handsome returns this year, the South Africans have seen additional gains as a currency play, with some more than doubling this year in the wake of the collapse of the rand. We continue to see the geopolitical, operating, and other risks in South Africa as impediments to prudent investing. In addition, many of the highly levered (high cost and/or high debt) but lower quality companies have outperformed. It is not uncommon for short covering and momentum investing to propel low quality stocks in the early phase of a strong market.
What to Expect from Gold Miners in 2016
The junior gold stocks have lagged the larger producers, as evidenced by the 6.6% year-to-date underperformance of the MVGDXJTR relative to the GDMNTR. The performances of some of the mid-tier stocks have lagged as well. This lag is typical in the early phase of a newly rising market as investment flows start with the large companies. We expect the mid-tiers and smaller companies to outperform if gold continues higher.
By analyzing companies’ fourth quarter reporting, 2016 guidance, and our meetings at the Bank of Montreal (BMO) Global Metals and Mining Conference, we have a better idea of what to expect in 2016 from gold mining companies. We have commented frequently about efforts to help reduce costs across the industry. It looks like the cost cycle is nearing its low point, as some companies are expecting further declines in 2016 and others are guiding to slightly increase. It is now common for companies to carry all-in mining costs of less than $1,000 per ounce. Large companies that were the perennial leaders 20 years ago are reasserting their roles. Newmont, Barrick, AngloGold, and Newcrest are the super majors that fell out of favor as they became bloated bureaucratic behemoths in the bull market. After several years under new managements, they are in the process of downsizing to become leaner, more efficient and more profitable companies. Barrick is targeting all-in mining costs below $700 per ounce by 2020. At the same time, company reports indicate that Barrick expects production to decline from 6.1 million ounces (before asset sales) in 2015 to 4.5 million ounces in 2020. Barrick also intends to reduce its net debt to zero. We think these are lofty goals, but if successful, they would solidify Barrick’s leadership and potentially reset the bar for the industry.
Gold Strategy Review: A Focus on Value Creation
Historically our investment strategy has tended to underperform during downturns in the gold price and outperform in positive gold markets, generating strong performance over the long term. However, based on our years of experience following the gold industry, we find our performance, and that of most actively managed funds in general, to be surprising so far this year given the rising gold price environment.
The overriding theme of our investment criteria, which has not changed, is value creation. Companies create value by taking an essentially worthless piece of property and turning it into a gold mine. This is what motivated me as a geologist in the ’80s and ’90s and it drives me now as a fund manager. So why is this investment style performing differently in 2016?
To answer that question we have undertaken a portfolio review and here are our conclusions:
• As we mentioned earlier, South African mining stocks are on fire despite the risk mentioned earlier, with some gaining more than 100% this year. In the past, we have avoided South African stocks due to geopolitical risk, union strife, difficult deep mining conditions, and an unreliable power grid.
• Highly indebted supermajors have outperformed. The market no longer seems concerned with excessive debt. We have been avoiding these stocks.
• Beaten down companies with high costs and/or no growth have outperformed. We have avoided these fundamentally flawed names.
• Mid-tiers and juniors that are creating value through growth have underperformed due to market concerns over project financing or acquisitions. These concerns began early in 2015 and gained momentum at the beginning of 2016. Some of these companies may need additional capital if gold prices average around $1,100 or less. We have been overweight in these stocks.
• We believe most of the companies that fall into the first three categories are unable to create value outside of their ongoing operations. However, until we see the market again rewarding companies that fit our investment style, we must adapt. We are not abandoning our quest for companies that create value, just toning it down. Here are the key portfolio developments that have been made as of the end of February.
Investment considerations:
• We continue to avoid South Africa due to risks. The outperformance is largely a function of a collapse in the rand, which we now believe is priced into the stocks.
• We have said that the supermajors have done a good job of paring down debt. We initiated a position in Newmont last year and we continue to view the large caps in a more positive light. With the operating improvements and financial discipline evident throughout the bear market, these large caps are again able to attract the big funds.
• We will consider more operationally levered companies if the relative valuation is compelling. However, some of these companies are in need of an acquisition to maintain production. We will continue to underweight or avoid potential acquirers until they make a transformative acquisition.
• We have adjusted our exposure to mid-tier growth names until we see the market take a more positive view. We are not avoiding these companies, as we believe they are now acquisition targets for the majors. We have increased exposure to Australian mid-tiers and juniors. There is a reemerging gold sector in Australia that doesn’t carry the same financing stigma of its global peers.
Our overall top-down allocations have not changed much. However, the strategy has more names, fewer overweights, and a few new names in the top 10. As we had indicated at yearend, we have reduced royalty companies to rotate into producing companies. The portfolio will remain more diversified until we gain the conviction to make larger bets. Also, our investment universe will expand if gold stays above the $1,200 per ounce threshold.
Finally, despite these challenges, we find all this market action very compelling. Seeing the movement in South African and other stocks reminds me of the early phase of the bull market that started in 2001.
Fed’s Rate Hike: The Straw Breaking the Camel’s Back?
To appreciate what is going on in the markets this year, we believe investors must use a perspective that takes into account the post-credit crisis economy. We believe that the post-crisis monetary tightening cycle did not begin with the first rate increase, as it did in past cycles. Tightening began when the Fed began ”tapering” its purchase of government bonds in late 2013. Once the Fed stopped buying bonds, it talked about raising rates. Then on December 16, 2015 it finally increased rates by 25 basis points. We see this as the modern tightening cycle and it has been going on for two years. The Atlanta Fed’s Wu-Xia Shadow Federal Funds Rate model measures an overall tightening in financial conditions that occurred while rates were artificially held around the zero-bound by central banks. The Wu-Xia calculation estimates there has been a tightening that is equivalent to a 3.19% rate rise over the last two years. An economy that, in our opinion, is overburdened with regulations, taxes, uncertainties, and misallocations of capital is unable to grow without monetary stimulus. The December 16 rate increase was the straw that is seemingly breaking the camel’s back.
Three areas that we believe have underpinned the stock market have diminished as this tightening cycle has progressed:
• Companies that took on debt when corporate rates were lower to buy back stock.
• Risk averse investors who moved out of treasuries and CDs into higher risk stocks and junk bonds to generate yield.
• The sovereign wealth funds of energy producing countries who must sell stock to help support their economies.
Flows in to Gold Stock Reverse Course
As markets seem to have passed a potentially historic inflection point, it looks like the money that flowed out of gold and into stocks and corporate debt over the last five years is beginning to reverse course. When a little of this money flows into gold stocks, it can have a big impact. The market cap of the global gold industry is only $205 billion, which is roughly one third (36%) of the value of Apple. While gold stocks have performed well this year, when factoring in the higher gold price, Scotiabank figures stock valuations of the senior producers are lower now than they were a month ago. We find that the valuations of many mid-tier and junior stocks are even more compelling.
Gold Breaks Out of Technical Downtrend
Gold has broken a technical downtrend that was well established. Following gold’s crash in 2013, it traded in a declining $150 range that in December stood at $1,050 to $1,200 (see chart below). Gold has clearly broken out of this range and until we see a new technical pattern emerge, it will be difficult to discern a trend. The next major technical resistance is at $1,600, which was the support level before the crash in 2013. However, we believe reaching this level is unrealistic in 2016, barring some sort of black swan event. At some point during the first half of 2016, we expect gold to pull back and consolidate. At that point, the depth and duration of the correction will help determine whether this is a new positive trend. We believe gold will be driven by a heightened undercurrent of financial risk as a result of growing distrust of central bank policies, global economic malaise, and overall market turbulence. Layered onto this is additional uncertainty brought on by Middle Eastern turmoil and widespread discontent with political leadership as evidenced by the U.S. presidential race and the British referendum on EU membership.
Breaking the Technical Downtrend – Gold Price Per Ounce (USD)

(Click to enlarge) Source: Bloomberg.
IMPORTANT DISCLOSURE
This content is published in the United States for residents of specified countries. Investors are subject to securities and tax regulations within their applicable jurisdictions that are not addressed on this content. Nothing in this content should be considered a solicitation to buy or an offer to sell shares of any investment in any jurisdiction where the offer or solicitation would be unlawful under the securities laws of such jurisdiction, nor is it intended as investment, tax, financial, or legal advice. Investors should seek such professional advice for their particular situation and jurisdiction.
Please note that the information herein represents the opinion of the portfolio manager and these opinions may change at any time and from time to time. Not intended to be a forecast of future events, a guarantee of future results or investment advice. Historical performance is not indicative of future results; current data may differ from data quoted. Current market conditions may not continue. Non-VanEck proprietary information contained herein has been obtained from sources believed to be reliable, but not guaranteed. No part of this material may be reproduced in any form, or referred to in any other publication, without express written permission of VanEck.
Commentaries are general in nature and should not be construed as investment advice. Any discussion of specific securities is neither an offer to sell nor a solicitation to buy these securities. Fund holdings will vary. Any indices mentioned are historical measures of common market sectors and performance. It is not possible to invest directly in an index.
Gold-related investments are subject to risks associated with precious metals, market risk, industry concentration, inflation, foreign securities, frequent trading, short-sales, leverage, and non-diversification.
Please note that Van Eck Securities Corporation offers investment products that invest in the asset class(es) included in this commentary. Please call 800.826.2333 or visit vaneck.com for a free prospectus and summary prospectus of such funds. An investor should consider investment objectives, risks, charges and expenses of the investment company carefully before investing. The prospectus and summary prospectus contain this and other information. Please read the prospectus and summary prospectus carefully before investing.


Since U.S. President Donald Trump announced tariffs on April 2, termed ”Liberation Day,” global markets have experienced significant volatility. The S&P 500 shed $5.83 trillion in market value over just four days, marking its steepest drop since the 1950s. Asian markets saw their worst session since 2008, reflecting widespread fears of an economic slowdown.
The U.S. 10-year Treasury yields initially fell below 4% as investors sought safety, but by April 8-9, they surged to a seven-week high of 4.515%. This spike, driven by bond market sell-offs potentially from basis trading or China’s strategic moves to pressure U.S. negotiations, suggests a precarious economic situation rather than risk-on sentiment.
On April 9, President Trump announced a 90-day pause on tariffs for most countries (excluding China, where tariffs jumped to 145%) in an effort to give markets time to absorb the changes and calm volatility. The move sparked a broad rally, with the S&P 500 surging 9.5% for its best day since 2008 and Bitcoin rebounding above $80,000 after a turbulent stretch.
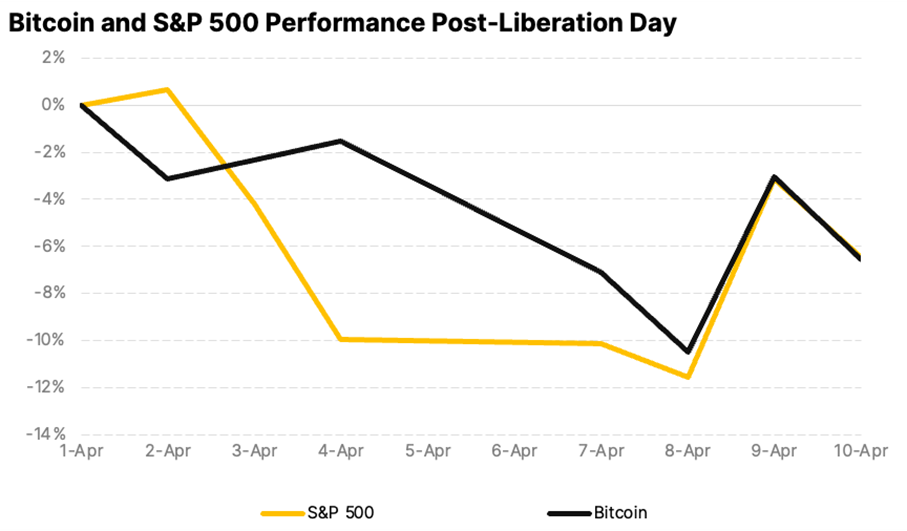
Bitcoin is macro now
Despite persistent concerns about crypto volatility, Bitcoin’s price over the past two weeks has closely mirrored the S&P 500 and has actually been less volatile. This alignment reflects Bitcoin’s growing maturity as an asset class and highlights its resilience. As a highly liquid and accessible asset, it continues to attract investors looking for relative value in turbulent markets.
Sentiment shifts toward crypto ETFs
Spot Bitcoin ETFs recorded $700 million in outflows, while Ethereum ETFs lost $400 million since March, marking a sharp reversal after nine consecutive months of inflows. The pullback points to growing institutional caution amid broader macro uncertainty. Still, on-chain data reveals that long-term holders have been steadily accumulating since January lows, signaling continued confidence in the asset class.
Macroeconomic uncertainty takes center stage
The latest U.S. CPI print came in at 2.4%, which was lower than expected. A rate cut in May still seems premature as markets assess the full impact of new protectionist measures. Federal Reserve Chair Jerome Powell has warned that tariffs could raise inflation while slowing growth. As a result, the probability of three rate cuts in 2025 now exceeds 60%. Declining yields may be an early signal of future monetary easing, which could favor risk assets like crypto if economic pressures intensify.
Bitcoin: Dollar’s ally or alternative?
In the face of policy uncertainty, the debate around the U.S. dollar’s reserve currency status is gaining momentum. With its decentralized and censorship-resistant design, Bitcoin is emerging as both a potential complement and challenger to the dollar, especially as the U.S. increasingly wields its currency as a geopolitical tool through tariffs and sanctions.
Meanwhile, Bitcoin’s fundamentals remain solid. Hashrate is at all-time highs, regulatory clarity is improving, and long-term holders continue to accumulate. With prices consolidating above $80K, the current correction may offer a strategic opportunity for investors positioning for the next leg of growth, particularly as the macro picture evolves.
Research Newsletter
Each week the 21Shares Research team will publish our data-driven insights into the crypto asset world through this newsletter. Please direct any comments, questions, and words of feedback to research@21shares.com
Disclaimer
The information provided does not constitute a prospectus or other offering material and does not contain or constitute an offer to sell or a solicitation of any offer to buy securities in any jurisdiction. Some of the information published herein may contain forward-looking statements. Readers are cautioned that any such forward-looking statements are not guarantees of future performance and involve risks and uncertainties and that actual results may differ materially from those in the forward-looking statements as a result of various factors. The information contained herein may not be considered as economic, legal, tax or other advice and users are cautioned to base investment decisions or other decisions solely on the content hereof.


iShares och Franklin Templeton listar nya ETFer på Xetra

BE28 ETF företagsobligationer med förfall 2028 och inget annat

Trump’s trade war puts Bitcoin in the spotlight

YCSH ETF är en satsning på den europeiska dagslåneräntan

Crypto’s stress-tested resilience

Fonder som ger exponering mot försvarsindustrin
Crypto Market Risks & Opportunities: Insights on Bybit Hack, Bitcoin, and Institutional Adoption

Warren Buffetts råd om vad man ska göra när börsen kraschar

Montrose storsatsning på ETFer fortsätter – lanserar Sveriges första globala ETF med hävstång

Svenskarna har en ny favorit-ETF
-
 Nyheter4 veckor sedan
Fonder som ger exponering mot försvarsindustrin
-

 Nyheter3 veckor sedan
Crypto Market Risks & Opportunities: Insights on Bybit Hack, Bitcoin, and Institutional Adoption
-
 Nyheter3 veckor sedan
Warren Buffetts råd om vad man ska göra när börsen kraschar
-
 Nyheter2 veckor sedan
Montrose storsatsning på ETFer fortsätter – lanserar Sveriges första globala ETF med hävstång
-
 Nyheter2 veckor sedan
Svenskarna har en ny favorit-ETF
-

 Nyheter4 veckor sedan
HANetf lanserar Europa-fokuserad försvars-ETF
-

 Nyheter2 veckor sedan
MONTLEV, Sveriges första globala ETF med hävstång
-

 Nyheter3 veckor sedan
Fastställd utdelning i MONTDIV mars 2025