
Nyheter
Gold Supported by Cracks in Market Confidence
Gold Supported by Cracks in Market Confidence. Since the financial crisis of 2008-2009, markets have been obsessed with what the Federal Reserve does or doesn’t say or do. This past January, the Fed was relatively quiet, giving no indications of an early year rate increase. This silence has forced the markets to find a second obsession: The Trump Administration. It appears as if there will be at least four more years of obsessing over President Trump’s actions and statements (and perhaps even more importantly, his tweets). The good news for gold is that markets are beginning to reflect reality following the irrational euphoria that occurred after the November U.S. presidential election.
Encouraging Start for Gold As Risks Come Into Focus
The risks of a Trump presidency, which we have been highlighting since the election, are coming into clearer focus. President Trump broke with tradition (again) by indicating that a strong U.S. dollar is not necessarily in the best interest of the United States. His chief trading advisor and incoming U.S. Treasury Secretary Steven Mnuchin also made comments that were interpreted as being unsupportive of the dollar. Controversial executive orders and anti-trade maneuvering have damaged confidence and contributed to further dollar weakness. As a result, gold and gold shares have had an encouraging start to the year, bouncing off oversold yearend levels and benefitting from downward moves in the U.S. dollar. Gold gained $58.38 (5.1%) to end January the month at $1,210.65 per ounce. The NYSE Arca Gold Miners Index1 (GDMNTR) gained 13.7% while the MVIS Global Junior Gold Miners Index2 (MVGDXJTR) advanced 17.9%.
Markets are generally fairly good at pricing in demand trends, earnings expectations, technology innovations, and many other things. However, one thing markets have great difficulty putting a price on is uncertainty. Just two weeks in, and it appears that Trump’s administration will be unconventional, controversial, and unpredictable. If we could measure the level of market uncertainty over the next four years, it would likely be off the charts. Many people in the U.S. and internationally are genuinely fearful of the future. With interest rates still at microscopic levels and U.S. stocks at all-time highs, gold, in our view, is an obvious investment alternative as a hedge against the potential for uncertain outcomes that may easily damage other asset classes.
Gold Trading Explained: Physical vs. Paper
Given our gold investing expertise, we are often asked about the nature of the gold market, as some investors are perplexed by the volumes traded. Bloomberg recently released an article in which the CPM Group, a research firm specializing in precious and industrial metals, quantified the global gold market. In 2015, 310,358 tonnes (10 billion ounces) of gold were traded globally. The London over-the-counter (OTC) market amounted to 144,000 tonnes, or 46.3%, of the gold traded, while the New York futures market accounted for 130,350 tonnes or 42.0%. These numbers stand in stark contrast to the physical demand of 4,124 tonnes estimated by Reuters GFMS in 2015. The magnitude of the trading stands out further when considering that there have been approximately 170,000 tonnes of gold mined since the beginning of time.
These markets enable a huge portion of gold to trade without moving a single ounce. Participants in the futures market understand and expect this, so trades are only rarely settled with physical gold. The OTC market is a physical market and much of the gold taken for delivery globally is settled through London. However, an OTC ounce can change hands many times in a day, so only a fraction of the gold traded in London is actually moved to a new owner. Thus, the overwhelming volume of gold is traded in paper transactions, not physical metal.
Treat Gold as a Financial Asset, Not as a Traditional Commodity
Although there are many people who believe gold is a useless relic, the millions who invest in gold believe differently. To make money in this sector, it is crucial to understand the behavior of dedicated gold investors. The most important thing to recognize is that gold (and its paper proxies) is used as a financial asset, not a commodity. It is a safe haven3 store of wealth with no liabilities and has been used as such throughout human history. Therefore, the gold price is not driven by the same supply/demand fundamentals as soybeans, copper, or crude, for example.
The chart shows a traditional commodity price analysis with surpluses and deficits in the physical gold market since 1988. Notice there are many years when the gold price rose when there was a physical surplus. Likewise, there are also years when the price fell and there was a deficit. This doesn’t make economic sense, which makes a physical supply/demand analysis an unreliable price indicator. We believe there are three possible reasons for this: 1) the global physical market is difficult to measure accurately; 2) the huge above ground stores of gold; and 3) investment drivers in the paper market can overwhelm the physical market.
Gold Supply vs. Price Change

(click to enlarge)
Western Investment Demand is Behind the Wheel
As 88% of global trading volume occurs in New York and London, we believe the dominant driver of gold prices is Western investment demand. Western investors and others use gold to monetize their views on currencies, interest rates, geopolitical risk, systemic financial risk, central bank policies, inflation, deflation, and tail risk.4 These are the primary factors that help drive the gold price. Technicals are also important, as many investors make decisions based on chart patterns. Prices can be volatile, and this volatility is another aspect that tends to attract certain investors. Commercial players, such as jewelers and producers, use these markets to trade metal or hedge, although we suspect this to be a relatively minor driver compared with investment demand.
According to the CPM Group, China and India are the two largest gold consumers with 1,803 tonnes of combined physical demand in 2015. While this is 44% of physical metal consumption, these two countries account for just 7.9% (24,518 tonnes) of global gold transactions. India has no modern gold exchanges and the Shanghai Gold Exchange and the emerging Chinese futures market have a very long way to go to rival the Western trading hubs. As such, even though Asia accounts for the majority of physical demand, this region tends to be a secondary driver of gold prices. The local markets in India and China typically trade at a premium or discount to Western markets depending on local demand levels. Asian investors are sensitive to rising prices, as demand tends to increase during periods of price weakness. Asian buying typically helps establish a floor for gold prices, while Western investment demand is usually responsible for driving it higher.
Manipulation in Gold Market? Maybe. But No Lasting Effect.
We are also asked, because of the unusual structure of the gold market, if the gold market is manipulated. We would not be surprised to find that the gold market has been manipulated, but to a lesser extent than other markets. For example, currency markets are often manipulated by governments. Bond markets have been manipulated by the central banks since the financial crisis. Some governments, banks, and hedge funds may occasionally derive some benefit from lower gold prices. We periodically have seen curious price movements caused by large paper market orders at times of thin trading. This has happened especially in weak markets. It would be naïve, however, to dismiss the gold market as “rigged” based on this. While the magnitude of the paper market is remarkable, it is still driven by gold fundamentals. We believe any attempts at manipulation, if successful, can only influence prices over short periods. The gold market is too large for any manipulation to have a lasting effect.

by Joe Foster, Portfolio Manager and Strategist
With more than 30 years of gold industry experience, Foster began his gold career as a boots on the ground geologist, evaluating mining exploration and development projects. Foster is Portfolio Manager and Strategist for the Gold and Precious Metals strategy..
Please note that the information herein represents the opinion of the author and these opinions may change at any time and from time to time.
1NYSE Arca Gold Miners Index (GDMNTR) is a modified market capitalization-weighted index comprised of publicly traded companies involved primarily in the mining for gold.
2MVIS Global Junior Gold Miners Index (MVGDXJTR) is a rules-based, modified market capitalization-weighted, float-adjusted index comprised of a global universe of publicly traded small- and medium-capitalization companies that generate at least 50% of their revenues from gold and/or silver mining, hold real property that has the potential to produce at least 50% of the company’s revenue from gold or silver mining when developed, or primarily invest in gold or silver.
3Safe haven is an investment that is expected to retain its value or even increase its value in times of market turbulence.
4Tail risk is a form of portfolio risk that arises when the possibility that an investment will move more than three standard deviations from the mean is greater than what is shown by a normal distribution.
Important Disclosures
This commentary originates from VanEck Associates Corporation (“VanEck”) and does not constitute an offer to sell or solicitation to buy any security.


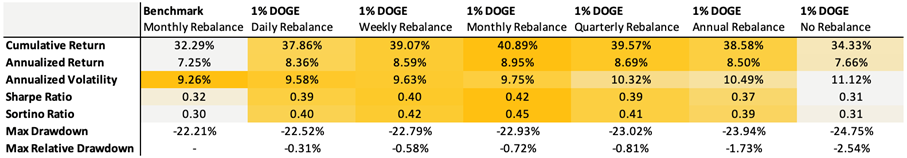
Dogecoin has outperformed other major cryptoassets over the past decade, while also exhibiting a low correlation to crypto and traditional assets. This creates a compelling argument for a portfolio allocation. We tested a Bitcoin-enhanced growth portfolio, which is a traditional 60/40 infused with 3% Bitcoin, and we introduced a modest 1% DOGE allocation. Since most prospective investors likely already hold Bitcoin, this offers a lens into how the two assets can complement each other.
Despite the small portfolio allocation, every approach delivered stronger returns. The benchmark returned 7.25% annually, while DOGE-enhanced portfolios reached as high as 8.95%. Sharpe ratios improved in almost all tests, indicating better risk-adjusted returns. Volatility did slightly tick up, but drawdowns remained largely contained. Even with no rebalancing, the max drawdown only deepened by a few percentage points, underscoring that even a 1% DOGE allocation adds meaningful punch without destabilizing the broader portfolio.
Rebalancing remains essential to capturing upside effectively. Without it, returns can plateau while risk quietly compounds. Monthly or weekly rebalancing offered the best balance, maximizing returns while keeping volatility and drawdowns in check, especially during periods of broader market stress, as we’ve recently seen. Given Dogecoin’s momentum-driven nature, a more strategic approach linked to broader crypto market cycles may offer even greater optimization beyond routine rebalancing.
With the right structure, a 1% allocation to Dogecoin isn’t reckless—it’s rewarding.
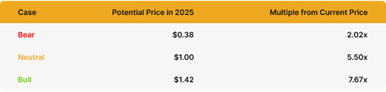
Bear Case
Despite strong fundamentals and a rich cultural legacy, Dogecoin’s recent rally, fueled by post-election memecoin mania, may have front-run its true cycle potential. As attention shifts to newer narratives, DOGE risks being seen as ’yesterday’s play,’ potentially underperforming even in a rising market. Still, that wouldn’t signal a flaw in its model, just a pause in a fast-rotating cycle.
Assuming a continued 10% compounded annual growth rate (CAGR) from its 2021 peak of $0.73, DOGE would be projected to land around $0.38 by 2025—still more than 2x from today’s levels but modest relative to past cycles. More notably, this would mark the first time Dogecoin fails to reach a new all-time high in a full market cycle.
Neutral Case
Dogecoin may not dominate headlines like it did at its peak, but it still holds cultural relevance and widespread recognition. In a scenario where the total crypto market cap peaks at $5 trillion this cycle and DOGE maintains a solid, albeit slightly reduced, market share of 3% instead of its previous 4%, this would result in a market capitalization of approximately $150 billion for DOGE.
At that valuation, DOGE would trade near $1 per coin, a ~5.5x gain from current levels around $0.185. This neutral case assumes Dogecoin retains its stature as the leading memecoin, despite increased competition, with stable adoption and renewed retail interest, but without the same euphoria of the last cycle.
Bull Case
If we take DOGE’s bottom price of $0.007 just before the last bull run began and fast-forward two years to the bottom of the current cycle at $0.0585, that move reflects a CAGR of 189%. If DOGE were to mirror this explosive growth, DOGE would reach approximately $1.42.
In this scenario, Dogecoin benefits from renewed memecoin mania, increasing real-world adoption, and stronger interest fueled by regulatory clarity and potential integration with major platforms like Elon Musk’s X. A full return of retail enthusiasm and broad cultural momentum could reestablish DOGE as the breakout asset of the cycle, potentially even doubling its all-time high.
Research Newsletter
Each week the 21Shares Research team will publish our data-driven insights into the crypto asset world through this newsletter. Please direct any comments, questions, and words of feedback to research@21shares.com
Disclaimer
The information provided does not constitute a prospectus or other offering material and does not contain or constitute an offer to sell or a solicitation of any offer to buy securities in any jurisdiction. Some of the information published herein may contain forward-looking statements. Readers are cautioned that any such forward-looking statements are not guarantees of future performance and involve risks and uncertainties and that actual results may differ materially from those in the forward-looking statements as a result of various factors. The information contained herein may not be considered as economic, legal, tax or other advice and users are cautioned to base investment decisions or other decisions solely on the content hereof.


SPFT ETF är en global satsning på teknikföretag

Dogecoin in a portfolio: A small 1% allocation has a loud bark!

VBTC ETN spårar priset på kryptovalutan Bitcoin

iShares och Franklin Templeton listar nya ETFer på Xetra

BE28 ETF företagsobligationer med förfall 2028 och inget annat

Fonder som ger exponering mot försvarsindustrin
Crypto Market Risks & Opportunities: Insights on Bybit Hack, Bitcoin, and Institutional Adoption

Warren Buffetts råd om vad man ska göra när börsen kraschar

Montrose storsatsning på ETFer fortsätter – lanserar Sveriges första globala ETF med hävstång

Svenskarna har en ny favorit-ETF
-
 Nyheter4 veckor sedan
Fonder som ger exponering mot försvarsindustrin
-

 Nyheter3 veckor sedan
Crypto Market Risks & Opportunities: Insights on Bybit Hack, Bitcoin, and Institutional Adoption
-
 Nyheter3 veckor sedan
Warren Buffetts råd om vad man ska göra när börsen kraschar
-
 Nyheter2 veckor sedan
Montrose storsatsning på ETFer fortsätter – lanserar Sveriges första globala ETF med hävstång
-
 Nyheter3 veckor sedan
Svenskarna har en ny favorit-ETF
-

 Nyheter4 veckor sedan
HANetf lanserar Europa-fokuserad försvars-ETF
-

 Nyheter2 veckor sedan
MONTLEV, Sveriges första globala ETF med hävstång
-

 Nyheter3 veckor sedan
Fastställd utdelning i MONTDIV mars 2025