VanEck Joe Foster Gold Reacts to Fed Hawks in June
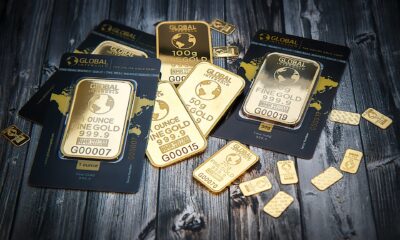
Gold continued its range-bound trading pattern, fluctuating between $1,200 and $1,300 per ounce since January. In June the price fell $27.39 (-2.16%) to end the month at $1,241.55. On June 14, the Fed raised rates for the fourth time in this rate hiking cycle. A common pattern emerged for the first three rate hikes with gold price weakness ahead of the hikes, followed by a rally to higher prices immediately after each hike. This pattern then changed, as gold reached its high for the year ($1,298 per ounce) on June 7 before the hike and subsequently trended lower for the rest of the month. Gold came under pressure as hawkish statements by the Fed following the Federal Open Market Committee (FOMC) meeting raised the odds of a fifth rate increase later in 2017.
The U.S. dollar gained strength temporarily following the FOMC meeting, but ended June with a 1.4% loss, as measured by the U.S. Dollar Index (DXY),1 which fell to nine month lows. The weakness was caused by comments from top officials from the European Central Bank (ECB) and Bank of England (BOE), which the markets interpreted as suggesting that some removal of monetary accommodation could be warranted soon. Also weighing on the U.S. dollar was the International Monetary Fund (IMF) downgrade of its 2018 U.S. GDP growth forecast to 2.1% from 2.5%. The global economy appears to be set to outpace the U.S. economy over the coming year.
Gold Hurt by Intense Selling Pressure, and Possible Manipulation
The June performance of gold was disappointing given the weakness in the U.S. dollar. Gold normally has an inverse correlation2 with the dollar. However gold came under intense selling pressure that looks suspiciously like someone was set on manipulating the market lower. On June 26 before European markets opened at 4:00 a.m. U.S. Eastern Time, the futures market was hit with a 1.8 million ounce sell order that drove the price down $18 in an instant. The selling came during off hours when liquidity was light and it pushed the price below the technically important $1,250 per ounce level.
Further selling pressure on the day before the Fourth of July holiday in the U.S. had gold looking to test the $1,200 level. We have not seen this type of (presumably) manipulated selling pressure since the bear market period from 2013 to 2015. We assume this activity originates with banks or hedge funds attempting to generate a profit, or with a government attempting to dampen competition with the U.S. dollar. We will never know the source, or whether it is part of a broader conspiracy, so we do not waste further time considering the possibilities. In the longer term, the market is too broad and deep to be manipulated successfully.
Mixed Results for Gold Equities
Gold stocks were mixed in June. The NYSE Arca Gold Miners Index (GDMNTR)3 followed gold lower with a loss of 2.87%, whereas the MVIS™ Global Junior Gold Miners Index (MVGDXJTR)4 posted a gain of 5.59%. The junior miners are showing some mean reversion after being oversold ahead of a major Index rebalance that occurred on June 16.
Waiting for a Strong Catalyst to Propel Gold off its Base
Since the bear market ended in December 2015, the price of gold and gold shares has been forming a base. We have yet to see a strong catalyst, however. Thus far in 2017, U.S. dollar weakness and a general nervousness on many geopolitical fronts have provided solid support for gold as a currency alternative and hedge against risks. Gold ended the first half with a modest gain of 7.75%. Gold stock indices underperformed gold as GDMNTR gained 5.29% and MVGDXJTR rose 3.47%. We normally expect gold stocks to outperform gold in a rising market. The underperformance of the indices this year is likely due to:
1. Mean reversion after stellar outperformance in 2016;
2. Heavy net redemptions in the gold mining ETFs;
3. Inability of stock indices to engage in fundamental stock selection.
Support Exists for Current Price Levels
The market is now in the midst of the summer doldrums, a time when physical demand is at its lowest, trading volumes can be light, and, as we saw in late June and early July, the bears come out to play. The gold price is testing the $1,200 per ounce level for the third time this year. If $1,200 fails, then it will go on to test the $1,175 base of the uptrend that has developed over the past 18 months. Successfully holding above these price levels would be very positive technically and psychologically for the market. Fundamentally, we believe the market is well supported around current levels because:
1. Physical demand in India and China continues to improve, even though the People’s Bank of China (PBOC) has yet to buy gold in 2017. We believe the PBOC is on pause this year due to foreign exchange and debt issues in China;
2. Geopolitics in the Middle East and Korea—along with uncertainty surrounding the U.S. political climate and policy—has created a pervasive nervousness globally that benefits gold;
3. The U.S. dollar appears to be in decline. While it did not help gold in June, we expect the historically negative correlation to benefit gold in the longer term;
4. Positioning in the futures market suggests there could be more buying ahead.
To Gold’s Benefit, This Fed Rate Hiking Cycle is Likely to End in Tears
We continue to be positive on the gold price in the longer term. Based on what we see and hear every day, all of us can imagine possible black swan5 events that might propel gold much higher. When we look at the economic cycle in the U.S., we find a more compelling investment case. Our March commentary highlighted many signs of a late cycle economy. In our May commentary, we published an ominous looking chart of NYSE margin debt. Complacency is at high levels typically seen at market tops. Investors continue to pour money into ETFs, driving stock market indices to new highs, while volatility as measured by the VIX Index6 is at historic lows. Most Fed rate hiking cycles end in tears. Will this one be any different?
Gold Remains a Solid Money Alternative Given Financial Risks
Gold would likely benefit from dollar weakness if the Fed is unable to raise rates later this year. In the longer term, when the economy and markets eventually see a downturn, the risks to the financial system will probably be substantial. Historically, excessive leverage is the core cause of financial upheaval. Student loans, automotive loans, and credit card debt are each over $1 trillion now. The ”elephant in the debt room” remains sovereign debt levels that exploded higher after the last financial crisis and has been growing ever since. A shrinking economy magnifies debt problems and, with interest rates still far below normal, would likely see the Fed again resort to quantitative easing and maybe more extreme intervention, such as debt monetization. Gold as a sound money alternative can act as a hedge against such risks.
by Joe Foster, Portfolio Manager and Strategist
With more than 30 years of gold industry experience, Foster began his gold career as a boots on the ground geologist, evaluating mining exploration and development projects. Foster is Portfolio Manager and Strategist for the Gold and Precious Metals strategy.
Please note that the information herein represents the opinion of the author and these opinions may change at any time and from time to time.
Important Information
1 U.S. Dollar Index (DXY) indicates the general international value of the U.S. dollar. The DXY does this by averaging the exchange rates between the U.S. dollar and six major world currencies: Euro, Japanese yen, Pound sterling, Canadian dollar, Swedish kroner, and Swiss franc.
2 The correlation coefficient is a measure that determines the degree to which two variables’ movements are associated and will vary from -1.0 to 1.0. -1.0 indicates perfect negative correlation, and 1.0 indicates perfect positive correlation.
3 NYSE Arca Gold Miners Index (GDMNTR) is a modified market capitalization-weighted index comprised of publicly traded companies involved primarily in the mining for gold.
4 MVIS Global Junior Gold Miners Index (MVGDXJTR) is a rules-based, modified market capitalization-weighted, float-adjusted index comprised of a global universe of publicly traded small- and medium-capitalization companies that generate at least 50% of their revenues from gold and/or silver mining, hold real property that has the potential to produce at least 50% of the company’s revenue from gold or silver mining when developed, or primarily invest in gold or silver.
5 Black swan is an event or occurrence that deviates beyond what is normally expected of a situation and is extremely difficult to predict.
6 VIX is the ticker symbol for the Chicago Board Options Exchange (CBOE) Volatility Index, which shows the market’s expectation of 30-day volatility. It is constructed using the implied volatilities of a wide range of S&P 500 index options.

 Nyheter3 veckor sedan

 Nyheter2 veckor sedan
 Nyheter2 veckor sedan
 Nyheter4 veckor sedan
 Nyheter2 veckor sedan
 Nyheter1 vecka sedan
 Nyheter3 veckor sedan

 Nyheter3 veckor sedan
