
Nyheter
Gold miners caught in a value trap
ETF Securities Equity Research – Gold miners caught in a value trap
Summary
- Gold miners are historically very cheap but at this juncture are likely to be a value trap due to profitability concerns.
- Gold miners are facing deteriorating ore grades despite the CAPEX splurges from 2007 to 2013 and recent mine closures haven’t improved margins.
- The recent slide in energy prices and the depreciation of currencies in jurisdictions where local miners operate, has had minimal positive impact on cash costs.
- We prefer gold relative to gold miners until the fundamentals improve.
Download the complete report (.pdf)
Gold miners are a value trap for now
We find ourselves starting 2016 with heightened market volatility. A global sell off in financial markets has pushed up gold prices by 2%, while gold miners have fallen by 7%. This has piqued our interest in the rationality of the historical parity between gold and its miners. While the case for gold remains intact we scrutinize the current valuation of gold miners. For the purpose of this report, gold miners refer to the constituents of the DAXglobal Gold Miners USD (TR) Index.
At first glance, offering a 59% discount to the gold price since 2009, gold miners seem attractive. Coupled with a price to book value of 1.0x and an average dividend yield of 2.8% make them a compelling investment from a valuation perspective. But when comparing with the mining sector in general, which trades at a price to book of 0.69 and an average dividend yield of 5.5%, gold miners do not offer the best value in the sector.

Click to enlarge
Furthermore, the decline in median cash dividend cover to 1.4x suggests sustainability of dividend payments remains questionable.
Elevated production costs dent margins
The recent slide in energy prices, (which has historically been positive for miners), and depreciation of currencies in jurisdictions where the local miners operate, has had minimal beneficial impact on cash costs. Cash costs continue to rise and consequently narrow profit margins. Given the decline in exploration of new projects and construction of new mines we have used ”cash costs” as our metric for calculating the mining cost of production as opposed to ”all in sustaining costs” which includes the full costs of producing gold including exploration and bringing new mines online.

Click to enlarge
Declining ore grades raise production costs
A significant factor contributing to the rising cash costs is the decline in average ore grades of existing mines that have witnessed a staggering 51% decline since 2000. Either the gold is too dispersed (low grade) or buried too deep underground (high grade) making the task of gold mining quite expensive given its capital intensive nature. The average ore grades of producing mines stand at 1.18g/ton, while that of undeveloped deposits is 0.89g/ton according to Visual Capitalist. These undeveloped mines represent a staggering 66% of all deposits on earth, leaving gold miners faced with deteriorating efficiency and higher costs as current reserves are depleted.

Click to enlarge
Discovery drought weighs on profitability
In addition, the future profitability of miners has come into question as they face the brunt of aggressive reductions in capital expenditure in the form of closures of uneconomical mines and curtailed exploration budgets. The golden era that lasted from 2001 to 2011 rewarded gold miners for aggressive growth over cash flow generation, eroding company valuations over the long run as they were funded by record amount of debt.

Click to enlarge
Today, long term risks to supply remain at the forefront of the debate after capital expenditures have declined to the lowest level in 12 years.
Gold miners are much higher risk
The financial credibility of the gold miners is low. The credit default swap spreads (CDS) for gold mining companies have risen 712% on average since 2003 to 220 basis points, well above the 66bp average for the S&P500. While it is unlikely to prompt a wave of impending defaults, as the net debt to EBITDA is low at 0.5, it reflects the increased risk of owning gold miners particularly when compared to the relative safe haven of physical gold. Furthermore, it highlights gold miners’ ability to raise debt while debt costs are typically rising, is becoming more difficult.

Click to enlarge
We continue to prefer gold over gold miners
We believe that gold prices will be constrained by rising nominal interest rates and some strengthening of the US Dollar in the short-term. However, we believe the US Federal Reserve (Fed) is potentially behind the curve with risks of inflation rising by more than their expectations and the markets in the longer-term. Furthermore, we believe the US Dollar strength is likely to wane, taking some of the gold-negative pressure away.
Contrary to popular belief, historically gold tends to rise in the first year of rate hikes, having only faltered when real interest rates rose aggressively in 1994. We believe a repeat of 1994 is unlikely in light of dovish leadership at the Fed.
Despite the low valuation of gold miners, on a risk adjusted basis we prefer physical gold and other areas of the mining sector which offer much better value.
For more information contact
ETF Securities Research team
ETF Securities (UK) Limited
T +44 (0) 207 448 4336
E info@etfsecurities.com
Important Information
This communication has been issued and approved for the purpose of section 21 of the Financial Services and Markets Act 2000 by ETF Securities (UK) Limited (“ETFS UK”) which is authorised and regulated by the United Kingdom Financial Conduct Authority (the “FCA”).


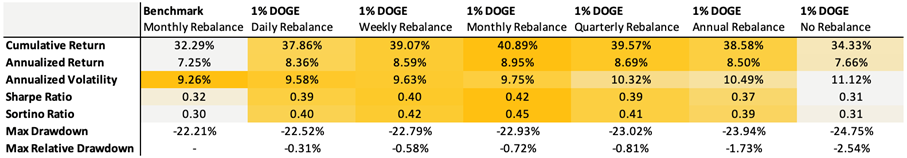
Dogecoin has outperformed other major cryptoassets over the past decade, while also exhibiting a low correlation to crypto and traditional assets. This creates a compelling argument for a portfolio allocation. We tested a Bitcoin-enhanced growth portfolio, which is a traditional 60/40 infused with 3% Bitcoin, and we introduced a modest 1% DOGE allocation. Since most prospective investors likely already hold Bitcoin, this offers a lens into how the two assets can complement each other.
Despite the small portfolio allocation, every approach delivered stronger returns. The benchmark returned 7.25% annually, while DOGE-enhanced portfolios reached as high as 8.95%. Sharpe ratios improved in almost all tests, indicating better risk-adjusted returns. Volatility did slightly tick up, but drawdowns remained largely contained. Even with no rebalancing, the max drawdown only deepened by a few percentage points, underscoring that even a 1% DOGE allocation adds meaningful punch without destabilizing the broader portfolio.
Rebalancing remains essential to capturing upside effectively. Without it, returns can plateau while risk quietly compounds. Monthly or weekly rebalancing offered the best balance, maximizing returns while keeping volatility and drawdowns in check, especially during periods of broader market stress, as we’ve recently seen. Given Dogecoin’s momentum-driven nature, a more strategic approach linked to broader crypto market cycles may offer even greater optimization beyond routine rebalancing.
With the right structure, a 1% allocation to Dogecoin isn’t reckless—it’s rewarding.
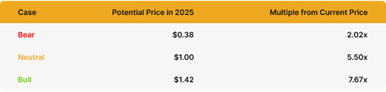
Bear Case
Despite strong fundamentals and a rich cultural legacy, Dogecoin’s recent rally, fueled by post-election memecoin mania, may have front-run its true cycle potential. As attention shifts to newer narratives, DOGE risks being seen as ’yesterday’s play,’ potentially underperforming even in a rising market. Still, that wouldn’t signal a flaw in its model, just a pause in a fast-rotating cycle.
Assuming a continued 10% compounded annual growth rate (CAGR) from its 2021 peak of $0.73, DOGE would be projected to land around $0.38 by 2025—still more than 2x from today’s levels but modest relative to past cycles. More notably, this would mark the first time Dogecoin fails to reach a new all-time high in a full market cycle.
Neutral Case
Dogecoin may not dominate headlines like it did at its peak, but it still holds cultural relevance and widespread recognition. In a scenario where the total crypto market cap peaks at $5 trillion this cycle and DOGE maintains a solid, albeit slightly reduced, market share of 3% instead of its previous 4%, this would result in a market capitalization of approximately $150 billion for DOGE.
At that valuation, DOGE would trade near $1 per coin, a ~5.5x gain from current levels around $0.185. This neutral case assumes Dogecoin retains its stature as the leading memecoin, despite increased competition, with stable adoption and renewed retail interest, but without the same euphoria of the last cycle.
Bull Case
If we take DOGE’s bottom price of $0.007 just before the last bull run began and fast-forward two years to the bottom of the current cycle at $0.0585, that move reflects a CAGR of 189%. If DOGE were to mirror this explosive growth, DOGE would reach approximately $1.42.
In this scenario, Dogecoin benefits from renewed memecoin mania, increasing real-world adoption, and stronger interest fueled by regulatory clarity and potential integration with major platforms like Elon Musk’s X. A full return of retail enthusiasm and broad cultural momentum could reestablish DOGE as the breakout asset of the cycle, potentially even doubling its all-time high.
Research Newsletter
Each week the 21Shares Research team will publish our data-driven insights into the crypto asset world through this newsletter. Please direct any comments, questions, and words of feedback to research@21shares.com
Disclaimer
The information provided does not constitute a prospectus or other offering material and does not contain or constitute an offer to sell or a solicitation of any offer to buy securities in any jurisdiction. Some of the information published herein may contain forward-looking statements. Readers are cautioned that any such forward-looking statements are not guarantees of future performance and involve risks and uncertainties and that actual results may differ materially from those in the forward-looking statements as a result of various factors. The information contained herein may not be considered as economic, legal, tax or other advice and users are cautioned to base investment decisions or other decisions solely on the content hereof.


SPFT ETF är en global satsning på teknikföretag

Dogecoin in a portfolio: A small 1% allocation has a loud bark!

VBTC ETN spårar priset på kryptovalutan Bitcoin

iShares och Franklin Templeton listar nya ETFer på Xetra

BE28 ETF företagsobligationer med förfall 2028 och inget annat

Fonder som ger exponering mot försvarsindustrin
Crypto Market Risks & Opportunities: Insights on Bybit Hack, Bitcoin, and Institutional Adoption

Montrose storsatsning på ETFer fortsätter – lanserar Sveriges första globala ETF med hävstång

Warren Buffetts råd om vad man ska göra när börsen kraschar

Svenskarna har en ny favorit-ETF
-
 Nyheter4 veckor sedan
Fonder som ger exponering mot försvarsindustrin
-

 Nyheter3 veckor sedan
Crypto Market Risks & Opportunities: Insights on Bybit Hack, Bitcoin, and Institutional Adoption
-
 Nyheter2 veckor sedan
Montrose storsatsning på ETFer fortsätter – lanserar Sveriges första globala ETF med hävstång
-
 Nyheter4 veckor sedan
Warren Buffetts råd om vad man ska göra när börsen kraschar
-
 Nyheter3 veckor sedan
Svenskarna har en ny favorit-ETF
-

 Nyheter4 veckor sedan
HANetf lanserar Europa-fokuserad försvars-ETF
-

 Nyheter2 veckor sedan
MONTLEV, Sveriges första globala ETF med hävstång
-

 Nyheter4 veckor sedan
Fastställd utdelning i MONTDIV mars 2025