Följ oss
the_ad_group(12516);

Nyheter

Gold Follows Rate Hike Pattern

Publicerad

den

Gold and Precious Metals Weakness to Rally: Gold Follows Rate Hike Pattern Rate Increase and Political Uncertainty in U.S. are Primary Drivers

Gold and Precious Metals Weakness to Rally: Gold Follows Rate Hike Pattern

Rate Increase and Political Uncertainty in U.S. are Primary Drivers in March

Expectations around the Federal Reserve’s (Fed) March 15 rate announcement were the principal drivers of the gold market in March. U.S. economic statistics have been somewhat positive recently, leading the market to expect the Fed to become more hawkish and to perhaps even guide for four rate increases in 2017 (one more than the Fed had announced in December). As a result, gold was weak ahead of the Fed’s rate decision, falling roughly $50 over two weeks to the $1,200 per ounce level. On March 15 when the Fed implemented its first 2017 rate hike as expected, it maintained its projection of only two more rate increases this year. Economic guidance also remained unchanged and Chair Janet Yellen said the Fed is willing to tolerate temporary inflation in order to overshoot its two percent target. The $1,200 per ounce gold price level held on the dovish Fed announcements and gold rallied to end the month with a small gain closing March at $1,249.35 per ounce.

Political activity in the U.S. was also supportive of gold. As we had expected, the market euphoria surrounding the November U.S. presidential election continues to dissipate. The Trump administration has suffered two strikes: the courts are blocking the implementation of new travel restrictions, and the House has blocked healthcare reform. In our opinion, these early defeats make it increasingly unlikely that the administration will be able to deliver on the expected pro-growth reforms that drove the market to new highs following the election. We believe one more strike could create a confidence crisis, which makes meaningful tax reform the next issue that will be vital for Trump’s presidency to gain some positive momentum.

The price trend for gold stocks mimicked gold bullion in March, for the most part. Both the NYSE Arca Gold Miners Index1(GDMNTR) and the MVIS™ Junior Gold Miners Index2 (MVGDXJTR) fell ahead of the March 15 Fed announcement and gained afterwards, but, unlike the metal, both gold stock indices ended the month with small losses overall.

Gold’s Before and After Rate Hike Pattern

The March 0.25% Fed rate increase was the third in this tightening cycle that began in December 2015. In all three instances, increasing pessimism in the gold market caused gold to fall to long-term or technical lows. This pessimism was caused by anticipation of rising real rates, a strong U.S. dollar, and faith in the Fed’s outlook for a strengthening economy. However, the economy has not been as robust as hoped and recently, rising inflation has caused real rates to fall. The Fed rate increase in December 2015 was a major turning point, marking the end of the historic 2011 – 2015 bear market for gold. A shift in sentiment also lead to gold rallies following the December 2016 and March 2017 rate hikes. Markets were irrationally causing the U.S. dollar to become overbought and gold to be oversold before each rate increase. Three times makes a pattern and if we have learned anything in our history of investing, it’s that trading patterns end once they are recognized. We will look for market sentiment, Fed behavior, or some other driver to help change the pattern when the Fed hikes rates again. The market expects the next possible rate hike at the June Federal Open Market Committee (FOMC) meeting.

The Current (More Rational) Market Bubble Could Pop on Growing Debt

The current economic expansion and bull market in stocks are among the longest on record. Such cycles do not last forever and we have commented in the past on the risks an economic downturn would bring to the financial system. While valuations for stocks and real estate are lofty, the level of mania that we had felt ahead of the tech bust (2001) or housing bubble (2008) has not materialized. Although the popularity of exchange traded funds (ETFs) and other passive investment vehicles could be seen as a form of mania, it is difficult to see anything happening in those vehicles that foreshadows a market crash. Perhaps, if there is to be a downturn, this time it will likely be more orderly than others in the recent past.

While economic downturns are not necessarily drivers for gold, since the subprime crisis of 2008-2009 the financial system has been in such a precarious state that even a mild recession could be financially devastating, thus ultimately benefitting gold and gold stocks. The difference in this cycle is, firstly, that sovereign debt globally is higher than it has ever been during peacetime and it continues to grow. The Congressional Budget Office’s (CBO) annual report shows the debt/GDP ratio3 has doubled since 2008 to 77% today and is forecasted to reach 150% in 2047. The CBO also forecasts debt service rising from 7% today to 21% in 2047. The budget deficit was not mentioned in President Trump’s February 28 speech to Congress. We believe no politician wants to seriously tackle the debt bubble for fear of getting voted out of office for raising taxes or cutting entitlements.

Recently we have seen that it appears politically impossible to implement the necessary reforms required to avoid insolvency or a systemic failure of the public healthcare insurance system. Social Security is yet another entitlement that appears to be heading toward insolvency. Gridlock reigns, which makes a debt crisis or another calamity a prerequisite to motivate those in Washington to act constructively. Such a crisis becomes much more likely in a recessionary economy.

The Fed’s three rate increases in this cycle amount to 75 basis points (0.25% on December 16, 2015; 0.25% on December 14, 2016; and 0.25% on March 15, 2017). U.S. rates remain far below historic norms and rates in other advanced economies are even lower. Quantitative easing did not work as well as planned. The Fed is holding trillions of dollars in U.S. Treasuries and mortgage-backed securities on its balance sheet and may have to resort to more radical policies to stimulate the economy in the next recession, which brings added financial risks.

Indications of a Late-Cycle Economy Are Increasing

Here are a number of signs of a late-cycle economy and market. Many of these were highlighted in recent Gluskin Sheff4 newsletters:

•    At eight years, the S&P 500® Index5 is in its second longest bull market since 1928.
•    With a 16.9% annualized gain, this is the third strongest S&P bull market since 1928.
•    Despite stock market gains, GDP growth has expanded just 1.8% annually, versus 3.4% during the longest bull market, occurring from 1987 to 2000.
•    10 of the last 13 Fed hiking cycles ended with a recession.
•    Price to Earnings multiples are in the top quintiles historically and the most expensive since the dot-com bubble (1995-2001).
•    Margin debt is at all-time highs.
•    Auto sales and loan delinquencies suggest automotive activity has peaked.
•    A record 279 corporate insiders have sold stock so far this year.
•    Initial jobless claims are at their cycle lows, typical historically in the waning months/years of expansions.
•    Each of the seventeen Republican presidents since Ulysses S. Grant has experienced a recession within roughly two years of taking office.

Sentiment and Consumption: A Recession Precursor?

A recent Morgan Stanley report interestingly examines historical consumer confidence, as measured by the Conference Board Consumer Confidence Index,6 and personal consumption expenditures7 (PCE). The sentiment of consumers and businesses (soft data) has been trending higher, while data that tracks actual economic results (hard data) has stagnated. This chart is particularly compelling. Notice the divergence between the soft and hard data preceding the last three recessions. A similar divergence is happening now, as consumer confidence appears to have reached its highest level since the tech bust.

Divergence Between Sentiment and Consumption Precedes Recessions

(click to enlarge) Source: Bloomberg; Federal Reserve Bank of St. Louis; U.S. Bureau of Economic Analysis. Data as of February 28. 2017.

While we hope that President Trump is able to bring tax, regulatory, and other reforms that energize the U.S. economy, political headwinds and late cycle evidence suggest it is prudent for investors to begin to hedge against the financial pain that the next recession might bring.

by Joe Foster, Portfolio Manager and Strategist

With more than 30 years of gold industry experience, Foster began his gold career as a boots on the ground geologist, evaluating mining exploration and development projects. Foster is Portfolio Manager and Strategist for the Gold and Precious Metals strategy..

Please note that the information herein represents the opinion of the author and these opinions may change at any time and from time to time.

1NYSE Arca Gold Miners Index (GDMNTR) is a modified market capitalization-weighted index comprised of publicly traded companies involved primarily in the mining for gold.

2MVIS™ Global Junior Gold Miners Index (MVGDXJTR) is a rules-based, modified market capitalization-weighted, float-adjusted index comprised of a global universe of publicly traded small- and medium-capitalization companies that generate at least 50% of their revenues from gold and/or silver mining, hold real property that has the potential to produce at least 50% of the company’s revenue from gold or silver mining when developed, or primarily invest in gold or silver.

3In economics, the debt-to-GDP ratio is the ratio between a country’s government debt (a cumulative amount) and its gross domestic product (GDP) (measured in years). A low debt-to-GDP ratio indicates an economy that produces and sells goods and services sufficient to pay back debts without incurring further debt.

4Gluskin Sheff + Associates Inc., a Canadian independent wealth management firm, manages investment portfolios for high net worth investors, including entrepreneurs, professionals, family trusts, private charitable foundations, and estates.

5The S&P 500® Index (SPX) consists of 500 widely held common stocks, covering four broad sectors (industrials, utilities, financial, and transportation).

6The Conference Board Consumer Confidence Index® is an indicator designed to measure consumer confidence, which is defined as the degree of optimism on the state of the economy that consumers are expressing through their activities of savings and spending.

7Personal consumption expenditures (PCE) is the primary measure of consumer spending on goods and services in the U.S. economy. It accounts for about two-thirds of domestic final spending, and thus it is the primary engine that drives future economic growth.

Important Disclosures

This commentary originates from VanEck Associates Corporation (“VanEck”) and does not constitute an offer to sell or solicitation to buy any security.

Fortsätt läsa
Annons
Klicka för att kommentera

Skriv en kommentar

Din e-postadress kommer inte publiceras. Obligatoriska fält är märkta *

Nyheter

Spotlight on the tariff war

Publicerad

den

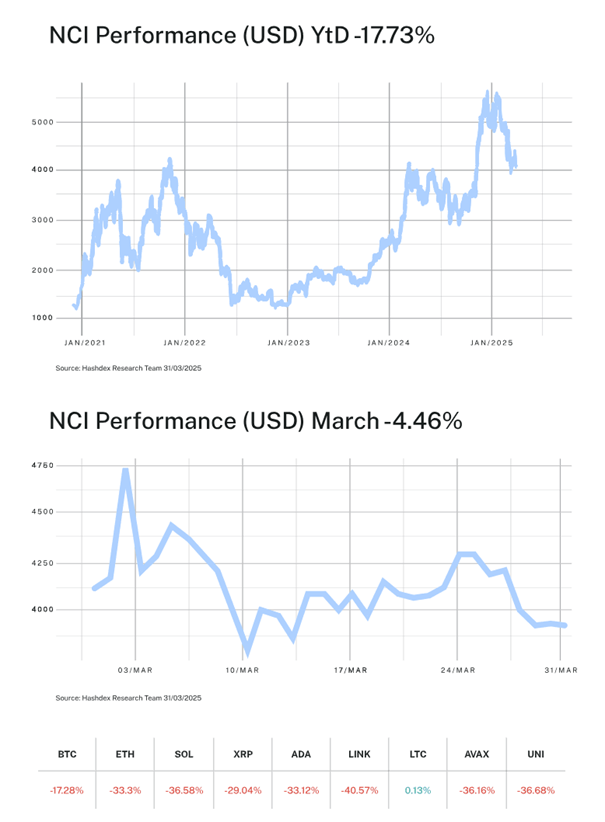
The impact of US tariffs continues to dominate market sentiment and risk assets, including crypto, struggled with this uncertainty throughout the month. The Nasdaq Crypto Index™ (NCI™) fell 4.46% in March as the S&P 500 and Nasdaq 100 dropped 5.63% and 7.61%, respectively.

The impact of US tariffs continues to dominate market sentiment and risk assets, including crypto, struggled with this uncertainty throughout the month. The Nasdaq Crypto Index™ (NCI™) fell 4.46% in March as the S&P 500 and Nasdaq 100 dropped 5.63% and 7.61%, respectively.

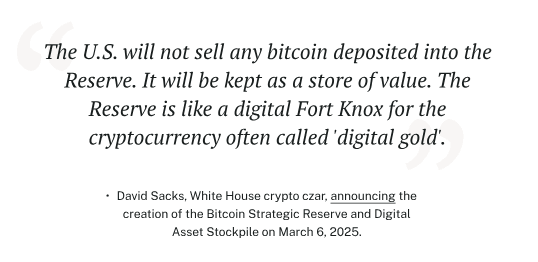
Despite the macro uncertainty from Washington, US policymakers are continuing to embrace crypto in an unprecedented way, including launching a Bitcoin Strategic Reserve, Digital Asset Stockpile, and engaging in expansive work at the regulatory agencies and in Congress.

Our team spent the last week of the month in Washington, meeting with regulators to share our experiences and views on what’s most important for crypto investors in the US. In his latest Notes from the CIO, Samir Kerbage shares what he learned from these meetings and how investors should be thinking about the new regulatory regime in the US.

As always, we are greatly appreciative of your trust in us and are here to answer any questions you may have.

-Your Partners at Hashdex

Market Review

March was marked by the tariff dispute triggered by the Trump administration. Back-and-forth fiscal policies, threats, and retaliations dominated the month’s agenda. The uncertain macroeconomic environment put investors into a defensive stance and negatively impacted crypto assets. The Nasdaq Crypto Index™ (NCI™) closed the month down -4.46% after a period of high volatility. Major market indices, the S&P 500 and Nasdaq-100, also recorded steep declines of -5.63% and -7.61%, respectively. These concurrent drawdowns across equities and crypto underscored March’s broad market caution, as trade war uncertainty prompted investors to flee risk assets.

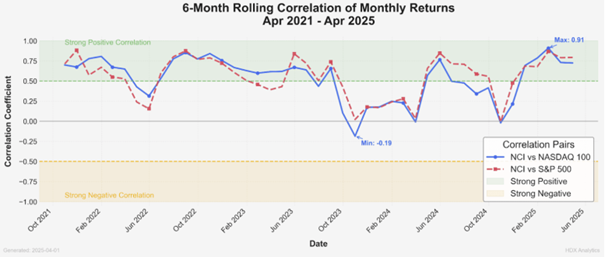
During times of uncertainty, it is common to observe increased correlation among different classes of risk assets. This pattern played out in March: the 6-month rolling correlation of monthly returns between the NCI™ and the Nasdaq-100 surged to roughly 0.91 (see chart below), its highest level since 2021, indicating that crypto assets were moving almost in lockstep with tech stocks. This spike in correlation confirms that crypto was behaving like a high-beta extension of the tech sector—an amplified version of the Nasdaq-100. The lack of clarity in the global landscape leads investors to reduce their risk exposure and seek protection, a movement known in financial markets as “risk-off” allocation.

6-Month Rolling Correlation of Monthly Returns between the Nasdaq Crypto Index and Nasdaq-100 (Apr 2021–Apr 2025).

The chart illustrates how this correlation has been increasing since the American elections in November 2024 and spiked to approximately 0.91 in the most recent period—a multi-year high. This visual evidence reinforces the view that crypto assets have been moving closely in tandem with tech stocks, effectively acting as a high-beta version of the Nasdaq-100 during the March risk-off phase.

Following this trend, risk reduction was evident within the crypto asset class. Among the NCI’s constituents, Bitcoin (BTC) posted a decline of -1.93%, withstanding the downturn far better than other constituents such as Ether (ETH, -17.4%) and Litecoin (LTC, -34.6%). BTC’s relatively mild drop in this sell-off aligns with the idea that it increasingly trades like a high-beta proxy for large-cap tech. It still declined, but less severely, whereas smaller-cap crypto assets behaved more like speculative growth stocks and suffered outsized losses. The only exception to the negative results was Cardano (ADA), which surprised with a positive return of 3.88% despite no significant protocol developments during the month.

Thematic indices also faced a challenging environment. As highlighted in previous letters, smaller capitalization assets tend to suffer more during periods of market stress, mirroring how speculative small-cap stocks are hit hardest in equity sell-offs. The biggest negative highlight was the Digital Culture Index, which dropped -17.45%, followed by the Decentralized Finance (DeFi) and Smart Contract Platform (Web3) indices, which fell -16.73% and -12.07%, respectively. The Vinter Hashdex Risk Parity Momentum Index recorded a negative result of -8.26% but outperformed the three other thematic indices, benefiting from its high allocation in BTC and TRX (which gained 4.68%). The heavy weighting in BTC – the more resilient large-cap crypto – helped cushion this index, underscoring the relevance of the momentum factor in a well-diversified strategy during times of market stress.

The market remains on the lookout for the outcome of the fiscal policy discussions, hoping for a reduction in uncertainties and an end to the tariff war. That would likely mark the moment when investors regain their appetite for risk assets, including crypto assets. The U.S. government has also signaled interest in advancing the crypto agenda, a development that could drive the asset class to a new level of adoption. We remain confident in our positive outlook for the rest of the year and the long term.

Top Stories

US creates Bitcoin Strategic Reserve and Digital Asset Stockpile

The Bitcoin Reserve will be capitalized with BTC owned by the Department of Treasury, which could further increase via new budget-neutral acquisitions. The stockpile will also include assets owned by the Treasury. This marks a major milestone, with the US government starting to integrate major crypto assets and continues the new administration’s work to lead the global crypto economy.

Stablecoins surpass $230 billion in market value

The total stablecoins market capitalization surpassed $230 billion amid institutional demand for dollar-backed digital assets. This showcases one of the most successful applications for crypto technology enhancing traditional financial payments. It could also pave the way for new use cases that require a strong and reliable global payment system.

FDIC eases banks’ ability to engage in crypto activities

The FDIC has rescinded previous guidelines which prevented financial institutions from engaging with crypto activities without prior sign-off. By removing bureaucratic hurdles, banks may more readily over crypto-related services, potentially leading to broader adoption and integration of digital assets into the financial system.


Fortsätt läsa

Nyheter

BSE8 ETF ger exponering mot företagsobligationer med förfall under 2028

Publicerad

den

Invesco BulletShares 2028 EUR Corporate Bond UCITS ETF EUR Acc (BSE8 ETF) med ISIN IE00079EUF59, försöker följa Bloomberg 2028 Maturity EUR Corporate Bond Screened-index. Bloomberg 2028 Maturity EUR Corporate Bond Screened Index följer företagsobligationer denominerade i EUR. Indexet speglar inte ett konstant löptidsintervall (som är fallet med de flesta andra obligationsindex). Istället ingår endast obligationer som förfaller under det angivna året (här: 2028) i indexet. Indexet består av ESG (environmental, social and governance) screenade företagsobligationer. Betyg: Investment Grade. Löptid: december 2028 (Denna ETF kommer att stängas efteråt).

Invesco BulletShares 2028 EUR Corporate Bond UCITS ETF EUR Acc (BSE8 ETF) med ISIN IE00079EUF59, försöker följa Bloomberg 2028 Maturity EUR Corporate Bond Screened-index. Bloomberg 2028 Maturity EUR Corporate Bond Screened Index följer företagsobligationer denominerade i EUR. Indexet speglar inte ett konstant löptidsintervall (som är fallet med de flesta andra obligationsindex). Istället ingår endast obligationer som förfaller under det angivna året (här: 2028) i indexet. Indexet består av ESG (environmental, social and governance) screenade företagsobligationer. Betyg: Investment Grade. Löptid: december 2028 (Denna ETF kommer att stängas efteråt).

Den börshandlade fondens TER (total cost ratio) uppgår till 0,10 % p.a. Invesco BulletShares 2028 EUR Corporate Bond UCITS ETF EUR Acc är den billigaste och största ETF som följer Bloomberg 2028 Maturity EUR Corporate Bond Screened index. ETFen replikerar det underliggande indexets prestanda genom samplingsteknik (köper ett urval av de mest relevanta indexbeståndsdelarna). Ränteintäkterna (kupongerna) i ETFen ackumuleras och återinvesteras.

Invesco BulletShares 2028 EUR Corporate Bond UCITS ETF EUR Acc är en mycket liten ETF med tillgångar på 6 miljoner euro under förvaltning. Denna ETF lanserades den 18 juni 2024 och har sin hemvist i Irland.

Produktbeskrivning

Invesco BulletShares 2028 EUR Corporate Bond UCITS ETF Acc syftar till att tillhandahålla den totala avkastningen för Bloomberg 2028 Maturity EUR Corporate Bond Screened Index (”Referensindexet”), minus avgifternas inverkan. Fonden har en fast löptid och kommer att upphöra på Förfallodagen.

Referensindexet är utformat för att återspegla resultatet för EUR-denominerade, investeringsklassade, fast ränta, skattepliktiga skuldebrev emitterade av företagsemittenter. För att vara kvalificerade för inkludering måste företagsvärdepapper ha minst 300 miljoner euro i nominellt utestående belopp och en effektiv löptid på eller mellan 1 januari 2028 och 31 december 2028.

Värdepapper är uteslutna om emittenter: 1) är inblandade i kontroversiella vapen, handeldvapen, militära kontrakt, oljesand, termiskt kol eller tobak; 2) inte har en kontroversnivå enligt definitionen av Sustainalytics eller har en Sustainalytics-kontroversnivå högre än 4; 3) anses inte följa principerna i FN:s Global Compact; eller 4) kommer från tillväxtmarknader.

Portföljförvaltarna strävar efter att uppnå fondens mål genom att tillämpa en urvalsstrategi, som inkluderar användning av kvantitativ analys, för att välja en andel av värdepapperen från referensindexet som representerar hela indexets egenskaper, med hjälp av faktorer som index- vägd genomsnittlig varaktighet, industrisektorer, landvikter och kreditkvalitet. När en företagsobligation som innehas av fonden når förfallodag kommer kontanterna som fonden tar emot att användas för att investera i kortfristiga EUR-denominerade skulder.

ETFen förvaltas passivt.

En investering i denna fond är ett förvärv av andelar i en passivt förvaltad indexföljande fond snarare än i de underliggande tillgångarna som ägs av fonden.

Förfallodag”: den andra onsdagen i december 2026 eller sådant annat datum som bestäms av styrelseledamöterna och meddelas aktieägarna.

Handla BSE8 ETF

Invesco BulletShares 2028 EUR Corporate Bond UCITS ETF EUR Acc (BSE8 ETF) är en europeisk börshandlad fond. Denna fond handlas på Deutsche Boerse Xetra.

Det betyder att det går att handla andelar i denna ETF genom de flesta svenska banker och Internetmäklare, till exempel DEGIRONordnet, Aktieinvest och Avanza.

Börsnoteringar

BörsValutaKortnamn
XETRAEURBSE8

Största innehav

NamnCUSIPISINKupongräntaVikt %
Volkswagen Leasing GmbH 3.875% 11/10/28D9T70CNQ3XS27457251553,8752,19%
Swedbank AB 4.25% 11/07/28W94240FJ7XS25724966234,2501,63%
ABN AMRO Bank NV 4.375% 20/10/28N0R37XLP3XS26136587104,3751,62%
Carlsberg Breweries AS 4% 05/10/28K3662HDY6XS26960464604,0001,60%
RCI Banque SA 4.875% 14/06/28F7S48DSE5FR001400IEQ04,8751,59%
Booking Holdings Inc 3.625% 12/11/28XS26210072313,6251,59%
Banco Santander SA 3.875% 16/01/28E2R99DB46XS25759526973,8751,58%
Nordea Bank Abp 4.125% 05/05/28X5S8VP8C3XS26189065854,1251,58%
E.ON SE 3.5% 12/01/28D2T8J8CT1XS25748732663,5001,57%
General Motors Financial Co Inc 3.9% 12/01/28U37047BA1XS27472706303,9001,57%

Innehav kan komma att förändras

Fortsätt läsa

Nyheter

En vecka för historieböckerna…

Publicerad

den

Det senaste vecan var den värsta veckan för världens aktiemarknader sedan covid-lockdown-kollapsen i mars 2020. Det var dessutom den värsta vecka för amerikanska aktier sedan covid-lockdown-kollapsen i mars 2020.

Det senaste veckan var den värsta veckan för världens aktiemarknader sedan covid-lockdown-kollapsen i mars 2020. Det var dessutom den värsta vecka för amerikanska aktier sedan covid-lockdown-kollapsen i mars 2020.

Det amerikanska referensindexet NASDAQ gick tillsammans med i Russell 2000, ett amerikanskt aktiemarknadsindex för småbolag i björnmarknadens territorium när dessa båda index fallit med över 20 procent från sina toppnoteringar. Samtidigt föll amerikanska Dow Jones med 2 200 punkter under fredagen.

Den grupp av företag som kallas för Mag 7 och har drivit börsuppgången på den amerikanska aktiemarknaden, tappade 1,4 biljoner dollar i börsvärde under veckan – det mest någonsin.

Fredagen den 4 april såh den högsta volymsessionen i historien på den amerikanska aktiemarknaden mätt som det totala antalet omsatta aktier på alla börser.

Det amerikanska VIX-indexet, känt som ”fear and greed-indexet” såg sin största veckorörelse sedan februari 2020. Det var också den värsta veckan för USAskreditmarknader sedan covid-lockdown-krisen, till och med värre än under SVB-bankkrisen.

Oljepriset kraschade med 11 procent under veckan, det största fallet sedan mars 2023 (SVB-kris / tillväxtskräck). Samtidigt rapporterade guldpriset den andra nedgångsvecka i år. Fredagen kursfall var den värsta dagen sedan november 2024. Priset på koppar såg sitt största fall sedan Lehman-kraschen i oktober 2008. Kryptovalutan Bitcoin rapporterade små vinster under veckan.

Fortsätt läsa

21Shares

Prenumerera på nyheter om ETFer

* indicates required

21Shares

Populära