
Nyheter
Ethermine to Pull Plug on PoW Forks, NFTs in Collateral Face Potential Liquidations, and More!
Last week saw a downtrend in returns and TVL of most assets and protocols in major crypto categories. Over the past seven days, Bitcoin and Ethereum have declined in price by 12.6% and 18.9% respectively. The top 3 cryptoassets within these categories are Binance Coin, Polygon, and Maker, who are down by 7.4%, 21.5%, and 20.8%. However, Polygon was the only asset to have a slight increase in its assets under management, with a 0.24% increase.
Figure 1: 7-Day Price and TVL Developments of Cryptoassets in Major Sectors
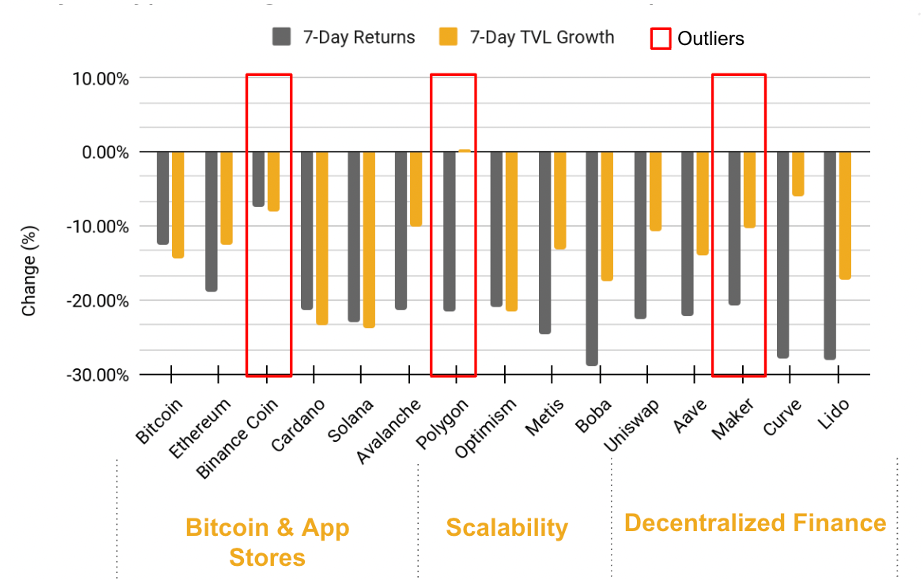
Source: 21Shares, Coingecko, DeFi Llama
Key takeaways
• Millions in long liquidation may be the main contributor to a market correction.
• Ethermine, the largest ETH mining pool, will not support PoW forks.
• Blue chip protocols continue siding exclusively with ETHPOS.
• Hundreds of NFTs face potential liquidations on BendDAO.
Spot and Derivatives Markets
Figure 2: Total Liquidations of Long and Short Positions
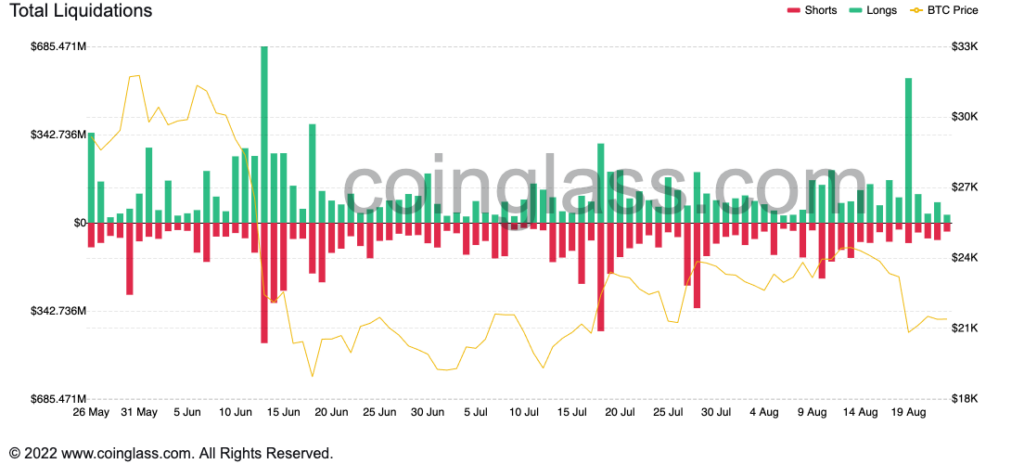
Source: Glassnode
The general downtrend of the crypto market may have been escalated by a liquidation spree that happened on Friday. According to data gathered by Coinglass, over 157K traders got liquidated on Friday, resulting in total liquidations of over $600M; Bitcoin traders lost over $239M, while Ethereum lost over $224M. With around $562M worth of long positions and $79M in shorts, this marks the biggest liquidation of long positions on futures since June 13, a few days before Bitcoin’s price fell below $20K.
On-chain Indicators
Figure 3: NVT Ratio of Bitcoin (2011-2022)
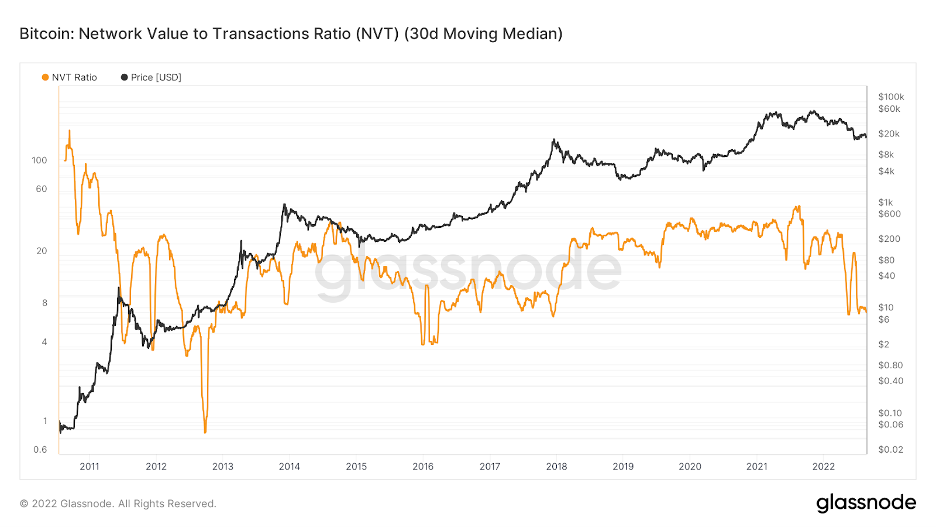
Source: Glassnode
With traders failing to meet margin requirements leading to enormous liquidations, one on-chain indicator that can help track the realized valuation levels of an asset is the Net Value to Transactions Ratio (NVT), analogous to the price to earnings for stocks. As shown in Figure 3, an NVT ratio as high as 100 indicates that the price of Bitcoin is overvalued, whereas downtrends like the one seen on July 24 indicate that investors are buying Bitcoin at a discount. Back in December 2018 when Bitcoin’s price fell to $3K, the NVT ratio fluctuated between 13 and 33. Compared to its current NVT ratio resting at 4.5 as of Monday, Bitcoin appears to be undervalued.
Figure 4: NVT Ratio of Ethereum (2011-2022)
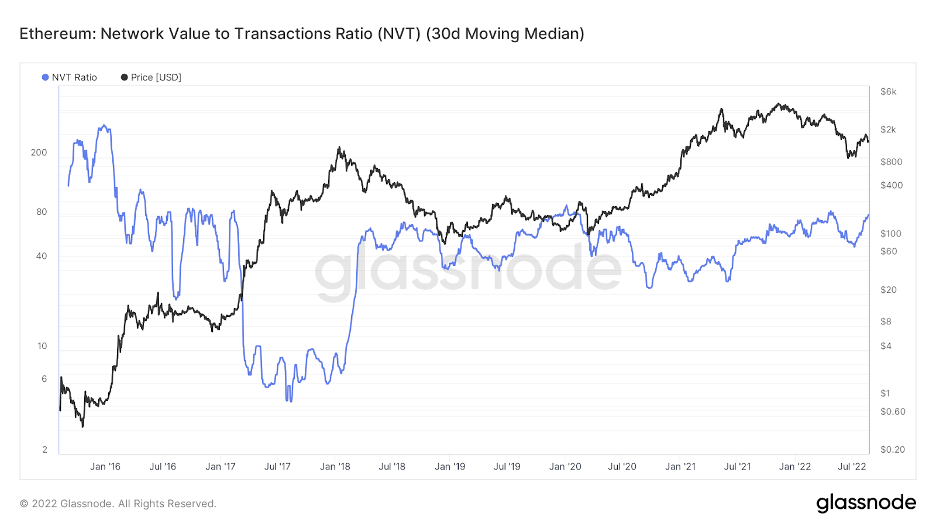
Source: Glassnode
When Ethereum’s price fell to $85 on December 16, 2018, the NVT ratio was 58.57. Compared to its current NVT ratio resting at 102.76 as of Monday, Ethereum may seem to be overvalued compared to historical levels.
Next Week’s Calendar
The two distinctive events of this week will be led by the release of the US GDP data on Thursday. The intelligence should denote the damage done to the US economy as a result of inflation. What’s more critical is the Core PCE price index, which is Fed’s favorite metric in understanding whether inflation has truly peaked or not, and which will be released on Friday.
Research Newsletter
Each week the 21Shares Research team will publish our data-driven insights into the crypto asset world through this newsletter. Please direct any comments, questions, and words of feedback to research@21shares.com
Disclaimer
The information provided does not constitute a prospectus or other offering material and does not contain or constitute an offer to sell or a solicitation of any offer to buy securities in any jurisdiction. Some of the information published herein may contain forward-looking statements. Readers are cautioned that any such forward-looking statements are not guarantees of future performance and involve risks and uncertainties and that actual results may differ materially from those in the forward-looking statements as a result of various factors. The information contained herein may not be considered as economic, legal, tax or other advice and users are cautioned to base investment decisions or other decisions solely on the content hereof.


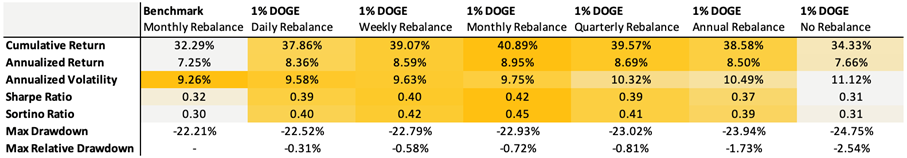
Dogecoin has outperformed other major cryptoassets over the past decade, while also exhibiting a low correlation to crypto and traditional assets. This creates a compelling argument for a portfolio allocation. We tested a Bitcoin-enhanced growth portfolio, which is a traditional 60/40 infused with 3% Bitcoin, and we introduced a modest 1% DOGE allocation. Since most prospective investors likely already hold Bitcoin, this offers a lens into how the two assets can complement each other.
Despite the small portfolio allocation, every approach delivered stronger returns. The benchmark returned 7.25% annually, while DOGE-enhanced portfolios reached as high as 8.95%. Sharpe ratios improved in almost all tests, indicating better risk-adjusted returns. Volatility did slightly tick up, but drawdowns remained largely contained. Even with no rebalancing, the max drawdown only deepened by a few percentage points, underscoring that even a 1% DOGE allocation adds meaningful punch without destabilizing the broader portfolio.
Rebalancing remains essential to capturing upside effectively. Without it, returns can plateau while risk quietly compounds. Monthly or weekly rebalancing offered the best balance, maximizing returns while keeping volatility and drawdowns in check, especially during periods of broader market stress, as we’ve recently seen. Given Dogecoin’s momentum-driven nature, a more strategic approach linked to broader crypto market cycles may offer even greater optimization beyond routine rebalancing.
With the right structure, a 1% allocation to Dogecoin isn’t reckless—it’s rewarding.
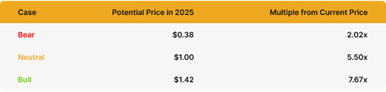
Bear Case
Despite strong fundamentals and a rich cultural legacy, Dogecoin’s recent rally, fueled by post-election memecoin mania, may have front-run its true cycle potential. As attention shifts to newer narratives, DOGE risks being seen as ’yesterday’s play,’ potentially underperforming even in a rising market. Still, that wouldn’t signal a flaw in its model, just a pause in a fast-rotating cycle.
Assuming a continued 10% compounded annual growth rate (CAGR) from its 2021 peak of $0.73, DOGE would be projected to land around $0.38 by 2025—still more than 2x from today’s levels but modest relative to past cycles. More notably, this would mark the first time Dogecoin fails to reach a new all-time high in a full market cycle.
Neutral Case
Dogecoin may not dominate headlines like it did at its peak, but it still holds cultural relevance and widespread recognition. In a scenario where the total crypto market cap peaks at $5 trillion this cycle and DOGE maintains a solid, albeit slightly reduced, market share of 3% instead of its previous 4%, this would result in a market capitalization of approximately $150 billion for DOGE.
At that valuation, DOGE would trade near $1 per coin, a ~5.5x gain from current levels around $0.185. This neutral case assumes Dogecoin retains its stature as the leading memecoin, despite increased competition, with stable adoption and renewed retail interest, but without the same euphoria of the last cycle.
Bull Case
If we take DOGE’s bottom price of $0.007 just before the last bull run began and fast-forward two years to the bottom of the current cycle at $0.0585, that move reflects a CAGR of 189%. If DOGE were to mirror this explosive growth, DOGE would reach approximately $1.42.
In this scenario, Dogecoin benefits from renewed memecoin mania, increasing real-world adoption, and stronger interest fueled by regulatory clarity and potential integration with major platforms like Elon Musk’s X. A full return of retail enthusiasm and broad cultural momentum could reestablish DOGE as the breakout asset of the cycle, potentially even doubling its all-time high.
Research Newsletter
Each week the 21Shares Research team will publish our data-driven insights into the crypto asset world through this newsletter. Please direct any comments, questions, and words of feedback to research@21shares.com
Disclaimer
The information provided does not constitute a prospectus or other offering material and does not contain or constitute an offer to sell or a solicitation of any offer to buy securities in any jurisdiction. Some of the information published herein may contain forward-looking statements. Readers are cautioned that any such forward-looking statements are not guarantees of future performance and involve risks and uncertainties and that actual results may differ materially from those in the forward-looking statements as a result of various factors. The information contained herein may not be considered as economic, legal, tax or other advice and users are cautioned to base investment decisions or other decisions solely on the content hereof.


SPFT ETF är en global satsning på teknikföretag

Dogecoin in a portfolio: A small 1% allocation has a loud bark!

VBTC ETN spårar priset på kryptovalutan Bitcoin

iShares och Franklin Templeton listar nya ETFer på Xetra

BE28 ETF företagsobligationer med förfall 2028 och inget annat

Fonder som ger exponering mot försvarsindustrin
Crypto Market Risks & Opportunities: Insights on Bybit Hack, Bitcoin, and Institutional Adoption

Montrose storsatsning på ETFer fortsätter – lanserar Sveriges första globala ETF med hävstång

Warren Buffetts råd om vad man ska göra när börsen kraschar

Svenskarna har en ny favorit-ETF
-
 Nyheter4 veckor sedan
Fonder som ger exponering mot försvarsindustrin
-

 Nyheter3 veckor sedan
Crypto Market Risks & Opportunities: Insights on Bybit Hack, Bitcoin, and Institutional Adoption
-
 Nyheter2 veckor sedan
Montrose storsatsning på ETFer fortsätter – lanserar Sveriges första globala ETF med hävstång
-
 Nyheter4 veckor sedan
Warren Buffetts råd om vad man ska göra när börsen kraschar
-
 Nyheter3 veckor sedan
Svenskarna har en ny favorit-ETF
-

 Nyheter4 veckor sedan
HANetf lanserar Europa-fokuserad försvars-ETF
-

 Nyheter2 veckor sedan
MONTLEV, Sveriges första globala ETF med hävstång
-

 Nyheter4 veckor sedan
Fastställd utdelning i MONTDIV mars 2025