
Nyheter
ETC Group Crypto Market Compass #8 2024
• Last week, cryptoassets outperformed traditional assets by a very wide margin as Bitcoin reclaimed 50k USD in price and 1 trn USD in market cap again
• Our in-house “Cryptoasset Sentiment Index” has also continued to increase and still signals bullish sentiment
• There is an increasing divergence between global Bitcoin ETP inflows and Gold ETP outflows which might be an early sign for bitcoin stealing gold’s crown as the prime store-of-value
Chart of the Week
Performance
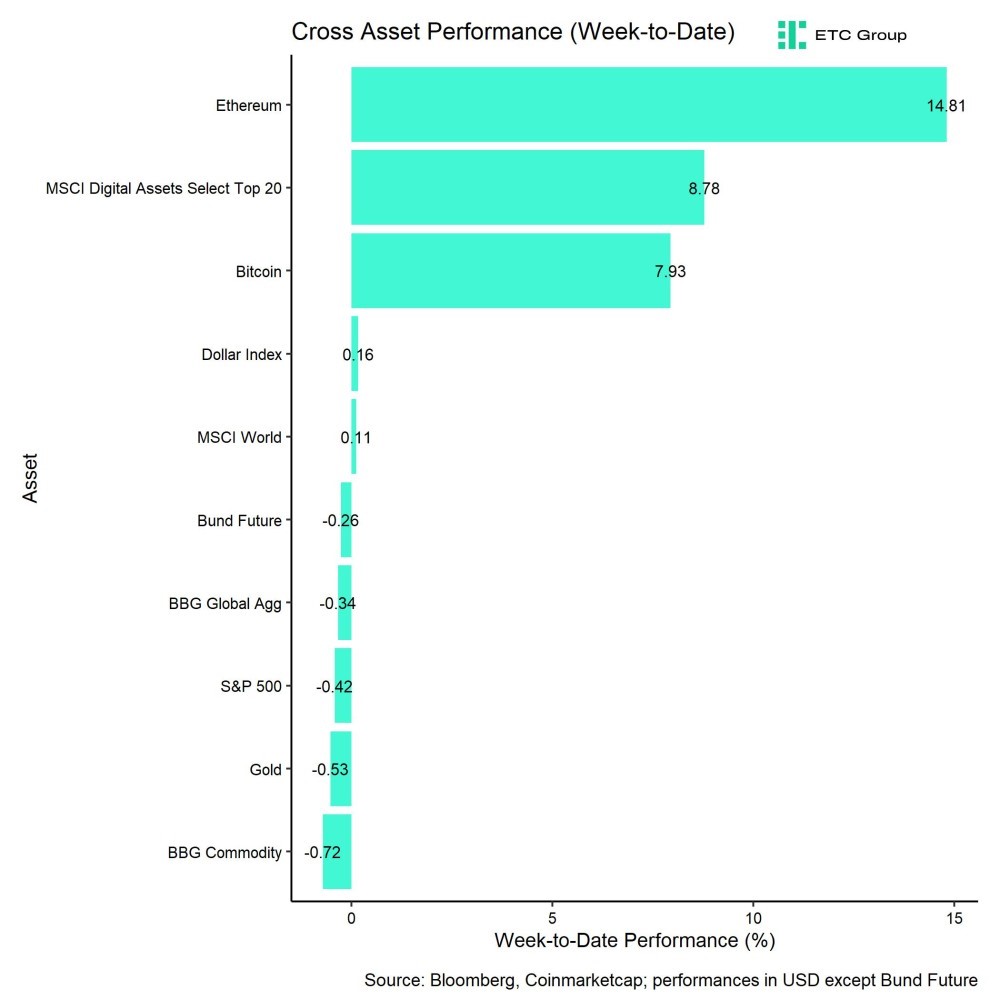
Last week, cryptoassets outperformed traditional assets like US equities or commodities by a very wide margin. In fact, while most major asset classes showed a negative performance last week, some major cryptoassets like Ethereum even posted double-digit returns. It appears as if cryptoassets are increasingly starting to decouple from the performance of traditional assets.
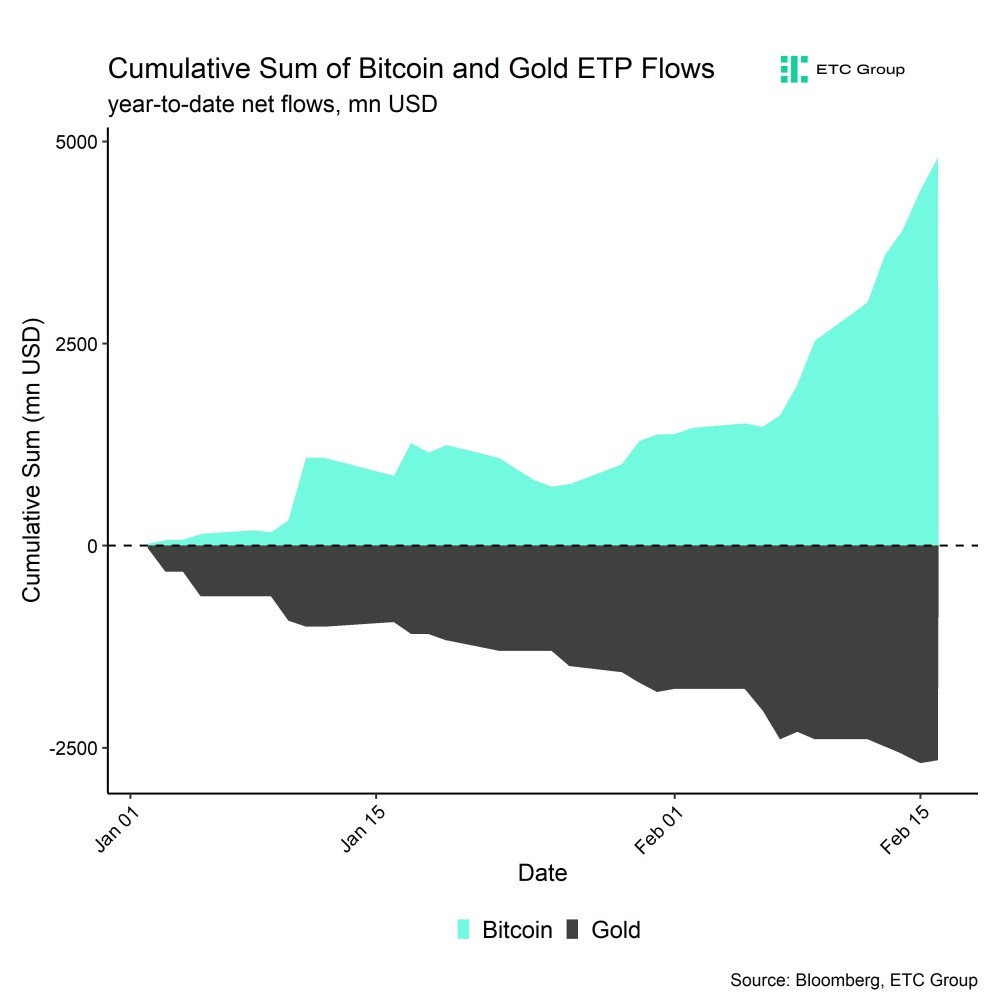
In this context, we are also observing an increasing divergence between global fund flows into Bitcoin ETPs and fund flows into global Gold ETPs (Chart-of-the-Week). While global Gold ETPs have seen net outflows or approximately -2.6 bn USD, global Bitcoin ETPs have attracted around +4.8 bn USD year-to-date, according to our own calculations based on Bloomberg data.
In general, we also expect this trend to continue, as our medium- to long-term expectation is that Bitcoin will ultimately disrupt Gold as the prime store-of-value. If that were the case, i.e. if Bitcoin had a similar market cap than Gold today (~13 trn USD), one single bitcoin would cost around ~600k USD which implies significant upside potential if this scenario continues to materialize.
What is more is that net inflows into Bitcoin ETPs have started to accelerate, as both outflows from Grayscale Bitcoin Trust (GBTC) have slowed down and inflows into other products have accelerated. According to a recent study by CryptoQuant, the large majority of new investments overall into Bitcoin appears to be related to investments into US ETFs. So, there is an increasing importance of those new ETF flows for Bitcoin’s performance.
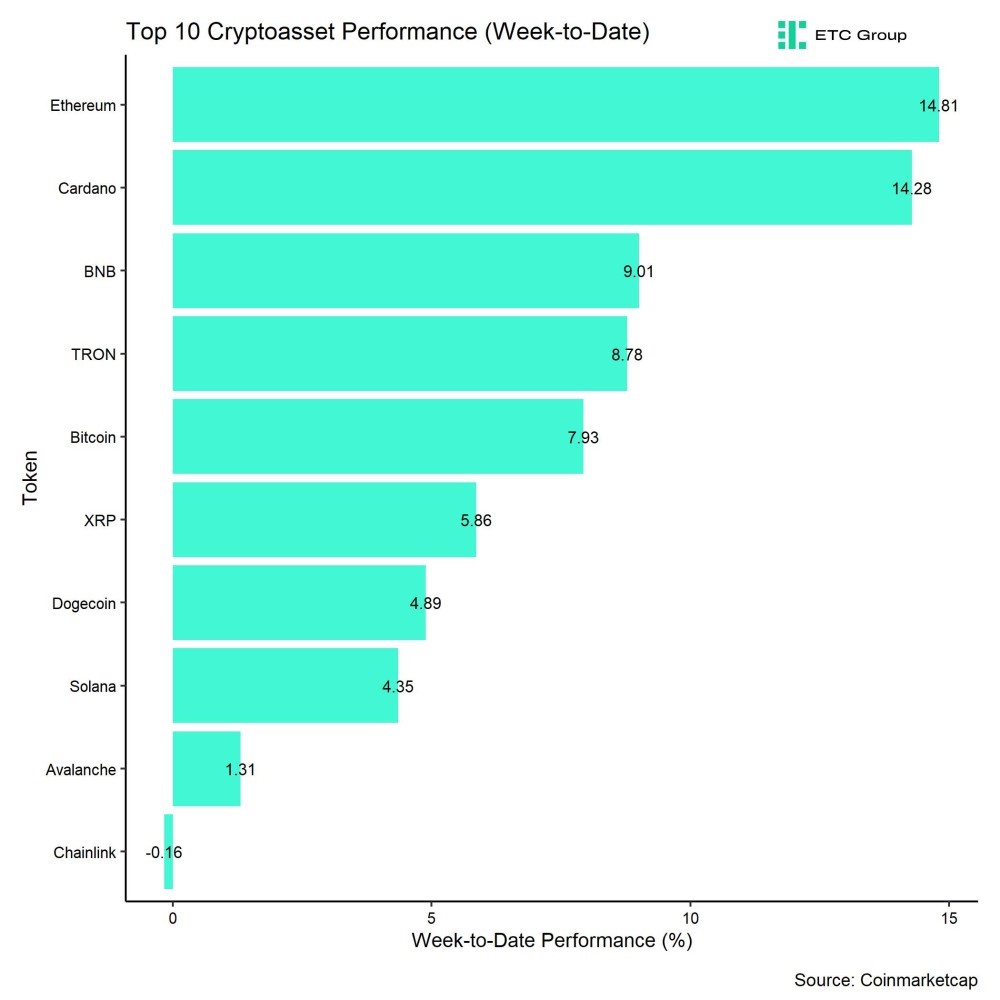
In general, among the top 10 crypto assets, Ethereum, Cardano, and Binance’s BNB token were the relative outperformers.
Overall altcoin outperformance vis-à-vis Bitcoin also picked up compared to the week prior, with 40% of our tracked altcoins managing to outperform Bitcoin on a weekly basis.
Sentiment
Our in-house “Cryptoasset Sentiment Index” has also continued to increase and still signals bullish sentiment.
At the moment, 13 out of 15 indicators are above their short-term trend.
High momentum in global crypto ETP flows as well as low BTC exchange inflows remain very supportive at the moment.
The Crypto Fear & Greed Index remains in ”Greed” territory as of this morning.
Meanwhile, our own measure of Cross Asset Risk Appetite (CARA) has also continued to increase as throughout the week which is signalling a positive sentiment in traditional financial markets.
Besides, performance dispersion among cryptoassets has increased again and remains relatively high.
In general, high performance dispersion among cryptoassets implies that correlations among cryptoassets are low, which means that cryptoassets are trading more on coin-specific factors.
At the same time, altcoin outperformance vis-à-vis Bitcoin has also increased, with a clear outperformance of Ethereum vis-à-vis Bitcoin last week. Viewed more broadly, around 40% of our tracked altcoins have outperformed Bitcoin on a weekly basis.
In general, increasing altcoin outperformance tends to be a sign of increasing risk appetite within cryptoasset markets.
Fund Flows
Overall, we saw very significant net fund inflows in the amount of +2292.1 mn USD (week ending Friday) based on Bloomberg data across all types of cryptoassets. In fact, we saw the highest weekly net inflows into cryptoasset ETPs year-to-date last week.
Global Bitcoin ETPs continued to see significant net inflows of +2261.1 mn USD of which +2273.4 mn (net) were related to US spot Bitcoin ETFs alone. The ETC Group Physical Bitcoin ETP (BTCE) saw net inflows equivalent to +12.1 mn USD last week.
The Grayscale Bitcoin Trust (GBTC) continued to see net outflows of around -624 mn USD last week albeit at a steady pace. This was more than offset by net inflows into other US spot Bitcoin ETFs.
Note that some fund flows data for US major issuers are still lacking in the abovementioned numbers due to T+2 settlement.
Apart from Bitcoin, we saw comparatively small flows into other cryptoassets last week again.
Inflows into global Ethereum ETPs picked up last week to around +27.2 mn USD. The ETC Group Physical Ethereum ETP (ZETH) attracted +1.3 mn USD in inflows. Besides, Altcoin ETPs ex Ethereum that managed to attract +4.7 mn USD last week.
In contrast, thematic & basket crypto ETPs continued to experience net outflows of -1.9 mn USD, based on our calculations. The ETC Group MSCI Digital Assets Select 20 ETP (DA20) did neither see in- nor outflows last week. (+/- 0 mn USD).
Besides, the beta of global crypto hedge funds to Bitcoin over the last 20 trading increased to around 1.0 which implies that global crypto hedge funds are currently positioned neutral to Bitcoin market risks.
On-Chain Data
On-Chain developments continue to support the positive performance at the moment. Global aggregate BTC exchange balances continue to drift lower and have just recently reached a new multi-year low.
In fact, we saw a very significant BTC exchange outflow today between 3:00 am and 4:00 am UTC during the Asian session when around -17,119 BTC were transferred out of exchange, most of which happened on Coinbase. Coinbase BTC exchange balances reached their lowest level since July 2015. These large downward spikes in exchange balances usually indicate institutional buying activity, as institutional investors usually keep their coins off the general exchange in so-called “cold storage”.
This is also supported by the observation that we saw net exchange outflows of -34.1k BTC last week only within the wallet cohort between 1 mn USD and 10 mn USD, so larger investors.
Another piece of evidence that also supports this is the fact that the overall number of BTC whales have skyrocketed recently and is now at the highest level in 3 years. In this context, whales are defined as the number of unique entities holding at least 1k bitcoins.
Whales continue to withdraw bitcoins from exchanges on a net basis. Based on our calculations, whales have been withdrawing around -5.8k BTC on average per day over the past week.
At the same time, some BTC on-chain analysts have pointed towards the fact that long-term holders have started distributing their supply already. In fact, long-term holder supply has been falling from 14.956 mn BTC at the beginning of the year to 14.659 mn BTC yesterday (-297k BTC net decline).
That being said, short-term holder supply has been increasing by around +366k BTC during the same period which implies a demand overhang by short-term holders.
Although this distribution by long-term holders is worth watching, it could simply be related to GBTC’s distributions of bitcoins while other new ETFs have started accumulating BTC.
Meanwhile, aggregate Ethereum (ETH) exchange balances also continued to drift downwards and are now near their multi-year lows as well.
Futures, Options & Perpetuals
Aggregate BTC futures open interest has remained fairly stable last week while CME futures open interest has increased only slightly by around +4k BTC.
Meanwhile, BTC perpetual open interest has even declined by around -12k BTC. This maybe related to the fact that we saw a significant increase in future short liquidations on Wednesday last week as bitcoin surpassed the 50k USD mark. Short liquidations were generally supportive of the latest increase in prices.
Besides, the 3-months annualized BTC futures basis continued to increase to around 14.4% p.a. and the BTC perpetual funding rate increased to the highest level since January 2nd across major derivatives exchanges.
BTC options’ open interest also increased last week by around +18k BTC. At the same time, the Put-call open interest also increased throughout the week implying that option traders continued to build up downside protections throughout the week. Put-call volume ratios were also somewhat elevated.
This observation seems to be supported by the fact that the 25-delta BTC option skew for 1 week expiries increased last week, albeit from low levels, which implies a relatively higher demand for put options. However, the skew for other expiries was mostly flat.
Option implied volatilities also increased again as realized volatility picked up with Bitcoin reaching multi-year highs. At the time of writing, BTC 1-month ATM implied volatilities are at around 55% on Deribit.
Bottom Line
• Last week, cryptoassets outperformed traditional assets by a very wide margin as Bitcoin reclaimed 50k USD in price and 1 trn USD in market cap again
• Our in-house “Cryptoasset Sentiment Index” has also continued to increase and still signals bullish sentiment
• There is an increasing divergence between global Bitcoin ETP inflows and Gold ETP outflows which might be an early sign for bitcoin stealing gold’s crown as the prime store-of-value
Disclaimer
Important Information
The information provided in this material is for informative purposes only and does not constitute investment advice, a recommendation or solicitation to conclude a transaction. This document (which may be in the form of a blogpost, research article, marketing brochure, press release, social media post, blog post, broadcast communication or similar instrument – we refer to this category of communications generally as a “document” for purposes of this disclaimer) is issued by ETC Issuance GmbH (the “issuer”), a limited company incorporated under the laws of Germany, having its corporate domicile in Germany. This document has been prepared in accordance with applicable laws and regulations (including those relating to financial promotions). If you are considering investing in any securities issued by ETC Group, including any securities described in this document, you should check with your broker or bank that securities issued by ETC Group are available in your jurisdiction and suitable for your investment profile.
Exchange-traded commodities/cryptocurrencies, or ETPs, are a highly volatile asset and performance is unpredictable. Past performance is not a reliable indicator of future performance. The market price of ETPs will vary and they do not offer a fixed income. The value of any investment in ETPs may be affected by exchange rate and underlying price movements. This document may contain forward-looking statements including statements regarding ETC Group’s belief or current expectations with regards to the performance of certain asset classes. Forward-looking statements are subject to certain risks, uncertainties and assumptions, and there can be no assurance that such statements will be accurate and actual results could differ materially. Therefore, you must not place undue reliance on forward-looking statements. This document does not constitute investment advice nor an offer for sale nor a solicitation of an offer to buy any product or make any investment. An investment in an ETC that is linked to cryptocurrency, such as those offered by ETC Group, is dependent on the performance of the underlying cryptocurrency, less costs, but it is not expected to match that performance precisely. ETPs involve numerous risks including, among others, general market risks relating to underlying adverse price movements and currency, liquidity, operational, legal, and regulatory risks.
For more details and the full disclaimer


Fem spanska fonder som har ökat med +12% under 2025

ASRP ETF ett spel på medtech företag världen över

Europafokuserade ETPer ser större andel av flödena under första kvartalet

JAAA ETF an aktiv satsning på säkerställda obligationer

Can crypto outperform amidst the current market turmoil?
Crypto Market Risks & Opportunities: Insights on Bybit Hack, Bitcoin, and Institutional Adoption

Montrose storsatsning på ETFer fortsätter – lanserar Sveriges första globala ETF med hävstång

Svenskarna har en ny favorit-ETF

MONTLEV, Sveriges första globala ETF med hävstång

Sju börshandlade fonder som investerar i försvarssektorn
-

 Nyheter4 veckor sedan
Crypto Market Risks & Opportunities: Insights on Bybit Hack, Bitcoin, and Institutional Adoption
-
 Nyheter3 veckor sedan
Montrose storsatsning på ETFer fortsätter – lanserar Sveriges första globala ETF med hävstång
-
 Nyheter4 veckor sedan
Svenskarna har en ny favorit-ETF
-
 Nyheter3 veckor sedan
MONTLEV, Sveriges första globala ETF med hävstång
-
 Nyheter3 veckor sedan
Sju börshandlade fonder som investerar i försvarssektorn
-

 Nyheter3 veckor sedan
Världens första europeiska försvars-ETF från ett europeiskt ETF-företag lanseras på Xetra och Euronext Paris
-

 Nyheter3 veckor sedan
Europeisk försvarsutgiftsboom: Viktiga investeringsmöjligheter mitt i globala förändringar
-

 Nyheter2 veckor sedan
21Shares bildar exklusivt partnerskap med House of Doge för att lansera Dogecoin ETP i Europa