
Nyheter
Dividends as alternative sources of income
Today, there are more investment choices than ever before. Yet, when looking for income, a lot of investors tend face two options:
• Take More Risk: Usually, this ends up being “credit” risk, which deals with the chance of an entity being able to meet specific obligations. Common strategies may focus on “High Yield” or “Floating Rate” debt, or dealing with European Banks, AT1 Coco Bonds. Why is there more income? To compensate investors for taking greater risk that payments won’t be made.
• Accept Lower Income: People are aging, so “lower income” may not necessarily be an option for everyone. If safety of principal is the primary objective, then there is little safer than government debt of some of the world’s most creditworthy countries, such as the United States, Germany or Japan. We cite these three countries because they also have exhibited “safe haven” characteristics, meaning that when investors are nervous, the value of these assets has historically tended to rise.
The ugly nature of inflation
Inflation is important to consider because it may be one of the most significant challenges facing investors in the future. Central Banks printed an awful lot of money in response to the Global Financial Crisis of 2008-2009. History has indicated that typically the consequence of this response is higher inflation. Consider that, at 3% inflation, prices double every 24 years and at 5%, they double every 15 years. Inflation truly erodes real returns, as the purchasing power of future units of currency—be it British pounds, US Dollars or Euros—can buy less and less and less over time.
To give investors a sense of the current environment :
• The US 10-Year Treasury is yielding slightly more than 3.20%.
• The United Kingdom 10-Year Gilt is yielding almost 1.60%.
• The German 10-Year Bund is yielding less than 0.50%.
• The Italian 10-Year BTP (not currently in the headlines for its lack of risk—quite the opposite) is yielding nearly 3.40%.
An alternative may be dividend-paying stocks, as these are one investment option that could not only potentially provide income, but also have a higher potential for price appreciation—providing the opportunity to keep up with inflation. Consider that dividend equities:
• Offer the potential to grow your income stream through dividend growth, in fact, outpacing the rate of inflation over the entire history of the S&P 500 from 1957 to today .
• Provide potential growth of principal through price appreciation
• May offer more downside protection than their non-dividend paying counterparts
Dividends are everywhere
First, it is worth noting that dividends are quite prolific. Small, medium and large companies all over the world offer dividends, with nearly 35% from the United States, more than 18% from emerging markets and almost half coming from Europe and other developed international countries.
Figure 1: The world broken down by dividend stream weighted exposure

Sources: WisdomTree, Factset, Standard & Poor’s, with data measured as of the 30 September 2018 WisdomTree Global Dividend Index Screening. Historical performance is not an indication of future performance and any investments may go down in value. You cannot invest directly within an Index.
New paradigm for asset allocation?
While it is always difficult to make such a bold statement, we think that it is always important and valuable to look across different, logical alternatives. For decades, people have looked at equity markets and thought in terms of weighting stocks by their market capitalization (share price x number of shares outstanding). Doing this, roughly speaking, leads to approximately 50% weight to the US, 40% weight to the developed world ex-US, and 10% weight to emerging markets . Figure 1 substitutes “dividend per share” for “share price” in the aforementioned equation, and we saw the results in the regional allocations. Now might be an interesting time to be thinking in these ways, as the US equity market has tended toward strong outperformance for the better part of the past 10 years.


We’re seeing increasing client interest in how crypto behaves during market stress. This week’s Hash Insider, our weekly research letter, dives into correlation dynamics.
Crypto Correlations Shift Pattern
Toward the end of February, correlations between crypto and other asset classes—excluding gold—began to rise, influenced by key US policy decisions on international trade tariffs. This trend, captured in the 30-day correlation window, is typical during periods of market stress, when assets often move in tandem, reflecting a broader risk-off sentiment.
However, in the wake of “Liberation Day,” this pattern unexpectedly broke, with crypto correlations declining (except to gold). This anomaly mirrors the first week of April when digital assets outperformed traditional markets despite economic uncertainty.
Nasdaq Crypto Index correlation with traditional asset classes:
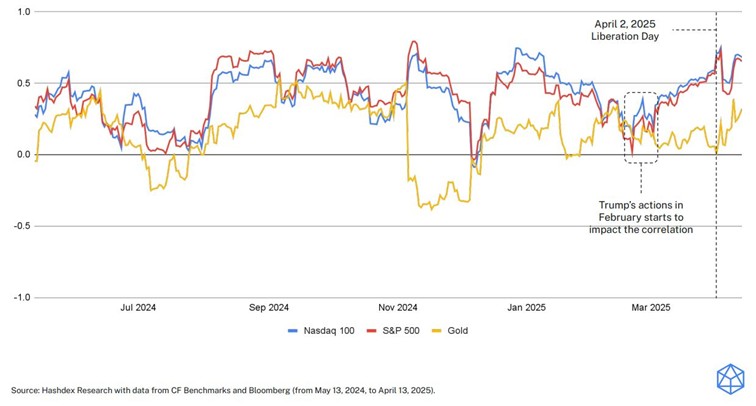
More in this week’s Hash Insider → Link to report
In addition, our team looked at market rebound past dynamics:
Bitcoin: Post-Stress Winner
Looking back at six major dislocations since 2020, Bitcoin saw sharp drawdowns in the first 10 days—but outperformed all major assets 60 days later in four of the six cases. In my view, the current environment could offer interesting entry point to build a position into the broad crypto market via the Nasdaq Crypto Index. More details about our flagship ETP replicating this index on its Product Page .
How assets performed after stress events
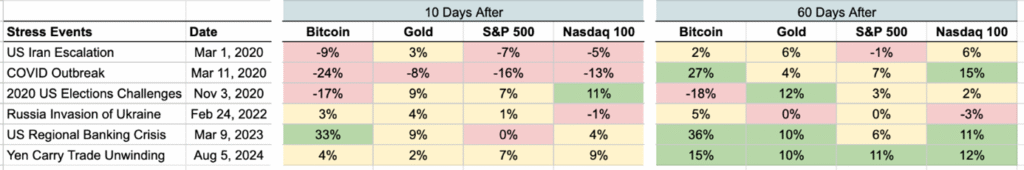
Source : Hashdex and Bloomberg


Crypto’s stress-tested resilience
BlackRock tar iShares S&P 500 3% Capped UCITS ETF till Europa

CNFY ETF de 50 största och mest likvida kinesiska aktierna på ChiNext

Bitcoin supply on crypto exchanges hits 5-year low and that’s a good sign

WDSD ETF småbolag från hela världen

Fonder som ger exponering mot försvarsindustrin
Crypto Market Risks & Opportunities: Insights on Bybit Hack, Bitcoin, and Institutional Adoption

Warren Buffetts råd om vad man ska göra när börsen kraschar

Montrose storsatsning på ETFer fortsätter – lanserar Sveriges första globala ETF med hävstång

Svenskarna har en ny favorit-ETF
-
 Nyheter3 veckor sedan
Fonder som ger exponering mot försvarsindustrin
-

 Nyheter3 veckor sedan
Crypto Market Risks & Opportunities: Insights on Bybit Hack, Bitcoin, and Institutional Adoption
-
 Nyheter3 veckor sedan
Warren Buffetts råd om vad man ska göra när börsen kraschar
-
 Nyheter2 veckor sedan
Montrose storsatsning på ETFer fortsätter – lanserar Sveriges första globala ETF med hävstång
-
 Nyheter2 veckor sedan
Svenskarna har en ny favorit-ETF
-

 Nyheter4 veckor sedan
HANetf lanserar Europa-fokuserad försvars-ETF
-

 Nyheter2 veckor sedan
MONTLEV, Sveriges första globala ETF med hävstång
-

 Nyheter3 veckor sedan
Fastställd utdelning i MONTDIV mars 2025