
Nyheter
Crypto Market Espresso | 23. May 2024
• The SEC has just approved the spot Ethereum ETFs in the US – we expect approximately 1.65 bn USD potential net inflows into US Ethereum ETFs 3 months after trading launch
• If we assumed the historical ”performance multiplier” of 6.15 to Ethereum flows to be true, then a ~15% increase in global Ethereum ETF AuM would be associated with ~92% performance
• The approval marks a significant shift in sentiment within the SEC and among US regulators in general but US investors still received inferior investment vehicles compared to European vehicles
6.5 years
The SEC has just approved spot Ethereum ETFs for trading in the US.
Although the exact date of trading launch is unknown and could take a few months, this approval marks a significant shift in sentiment within the SEC and US regulators in general.
The Grayscale Ethereum Trust (ETHE) was launched on 14 December 2017. It was the first investment vehicle that allowed professional investors to gain exposure to the second largest cryptoasset – Ethereum.
Nearly 6.5 years later, US investors finally have a more efficient investment vehicle to participate in Ethereum’s performance.
US ETF issuers made last-minute adjustments to their 19b-4 filings to meet the final deadline for the SEC’s decision on VanEck’s spot Ethereum ETF application, which was due on 23 May.
Bloomberg ETF analysts had previously commented that approval could come as early as Wednesday this week, beating consensus expectations for a later approval date. Other applicants included the same companies that applied for a spot bitcoin ETF previously, such as iShares and Fidelity.
The sudden increase in approval odds caught many by surprise, as Bloomberg ETF analysts unexpectedly raised their approval odds from 25% to 75% after the SEC asked exchanges to expedite their 19b-4 filings. Meanwhile, the odds of approval by the end of May on popular betting sites also jumped to over 50%, up from 10% just a few days earlier.
This unexpected rise in approval odds also surprised Ethereum futures short sellers, causing short liquidations in Ethereum futures contracts to surge to their highest level since March.
This caused the price of Ethereum to jump more than 10% in a matter of hours,
reversing much of its underperformance against bitcoin this year.
So, the market had already started to anticipate a potential approval.
But what’s next?
How many fund flows should we expect?
Many market observers have tried to guide down expectations for an Ethereum ETF trading launch.
The reason is that the Ethereum spot ETF approval is coming after a bonanza in fund flows into US spot Bitcoin ETFs which is why Bloomberg ETF analysts expect only around 10%-15% of Bitcoin ETF flows to flow into Ethereum ETFs.
At the time of writing, US spot Bitcoin ETFs have already seen cumulative net fund inflows in the amount of +13.2 bn USD since trading launch on the 11th of January 2024.
12.5% of that amount would imply approximately 1.65 bn USD potential net inflows into US Ethereum ETFs.
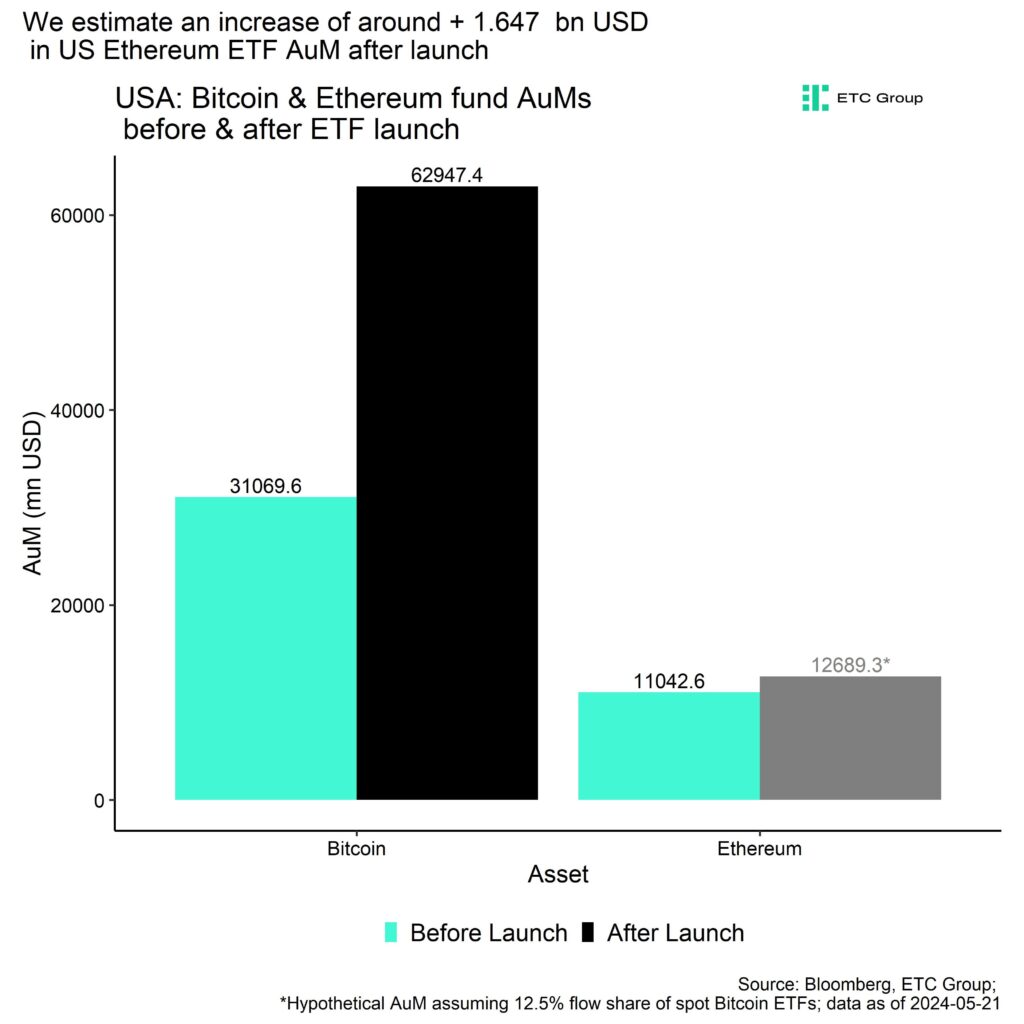
This amount would currently be equivalent to ~15% of current global Ethereum ETP assets-under-management (AuM) or around 0.7% of Ethereum’s realized cap, i.e. the amount invested on-chain.
What could be the price effect of this approval?
Nonetheless, this amount of capital could potentially still have a very significant impact on Ethereum’s performance going forward.
The reason is that Ethereum’s performance has shown a significantly higher sensitivity to global ETP flows than Bitcoin in the past.
While Bitcoin’s performance sensitivity to global ETP flows was around ~1.0, Ethereum’s performance has shown an average sensitivity of around 6.15 to global ETP flows in the past.
In other words, an increase of global ETH ETP AuM by 1% per week was associated with an average ETH/USD performance of 6.15% per week.
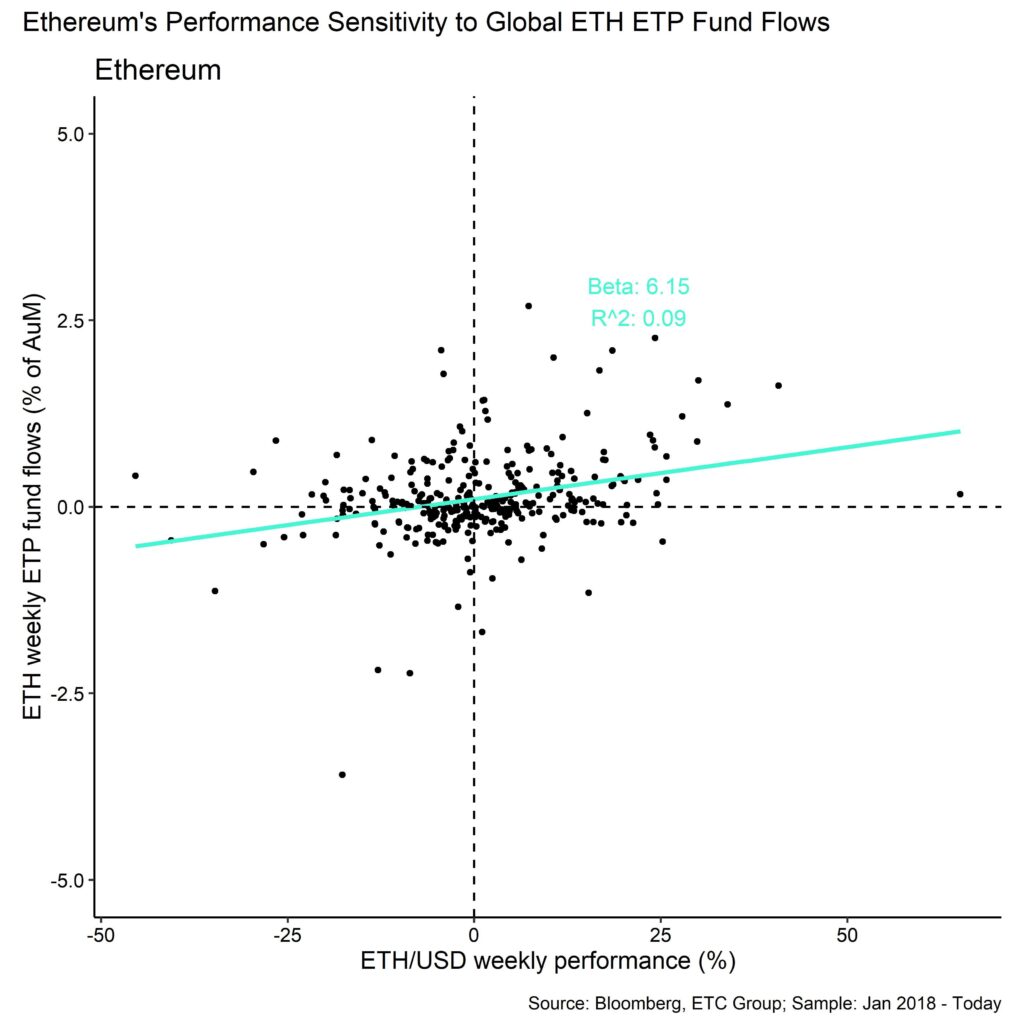
Now, if we assumed the abovementioned ”multiplier” of 6.15 to be true, then a ~15% increase in global Ethereum ETF AuM would be associated with ~92% performance!
That being said, the sensitivity of Ethereum’s performance to weekly ETP flows can vary significantly over time and has been around ~10.5 more recently.
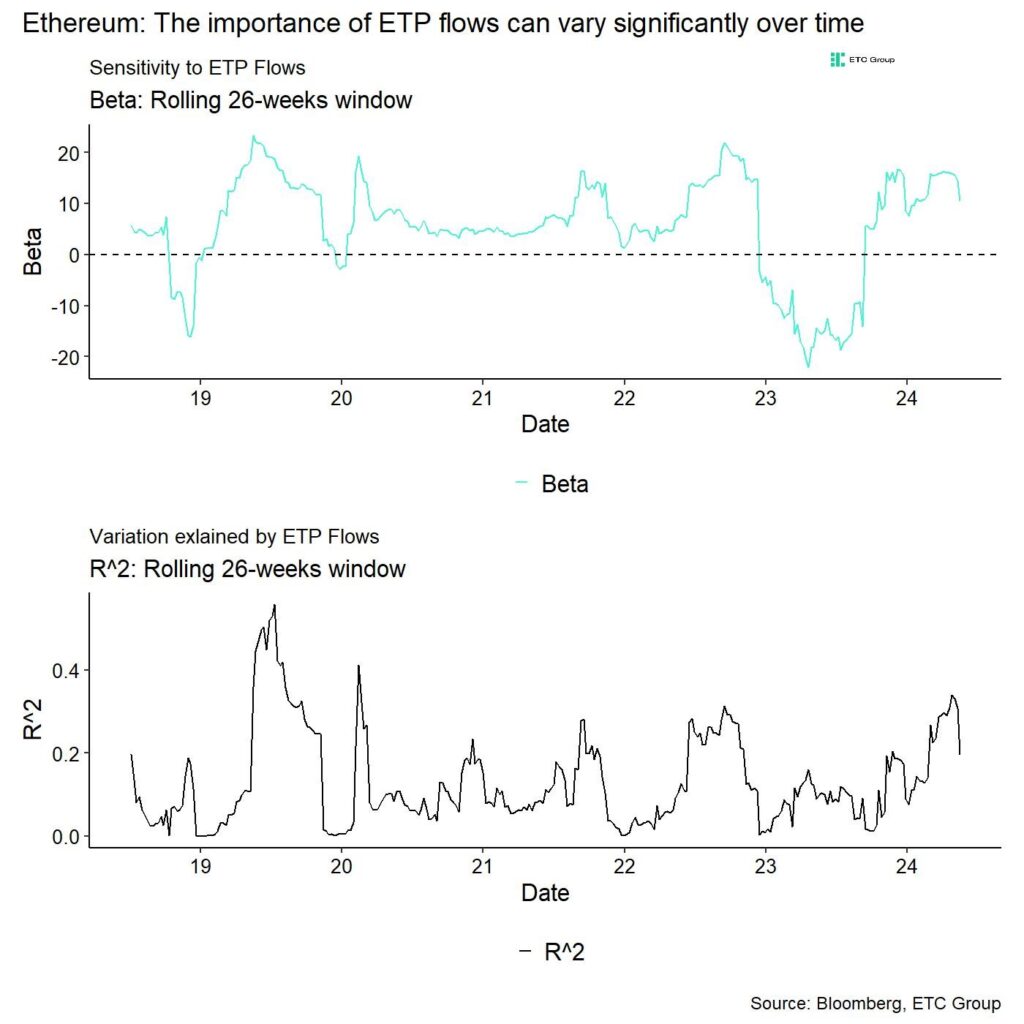
As a caveat, keep in mind that correlation does not imply causation and that higher net inflows could possibly not cause increases in price.
More specifically, we estimate that global Ethereum ETP flows could only explain around 19.6% in the variation of Ethereum over the past 6 months. So, other factors such as macro or coin-specific factors have played a larger role.
What’s special about these Ethereum ETFs?
The approval marks a significant shift in sentiment within the SEC and US regulators more general. The recent passing of the “crypto bill” in the US senate has demonstrated that there is bipartisan consensus on the importance of cryptoassets for the United States.
The fact that the Trump campaign has recently started accepting crypto donations for campaign finance speaks volumes in this regard as Trump had personally shown a rather anti-crypto stance in the past.
Thus, viewed more broadly within the context of recent domestic political developments in the US, this approval could be evidence of a more mainstream acceptance of cryptoassets as a legitimate asset class.
However, US investors still receive a suboptimal investment vehicle for Ethereum:
The creation-redemption mechanism is still not done in kind and staking has not been allowed within the filings. Thus, US investors won’t be able to fully capture Ethereum’s total return profile via staking returns that currently amount to around 3.2% p.a.
European investors are once again better served with products that allow investors to participate in these total returns such as the ETC Group Ethereum Staking ETP.
Bottom Line
• The SEC has just approved the spot Ethereum ETFs in the US – we expect approximately 1.65 bn USD potential net inflows into US Ethereum ETFs 3 months after trading launch
• If we assumed the historical ”performance multiplier” of 6.15 to Ethereum flows to be true, then a ~15% increase in global Ethereum ETF AuM would be associated with ~92% performance
• The approval marks a significant shift in sentiment within the SEC and among US regulators in general but US investors still received inferior investment vehicles compared to European vehicles

This is not investment advice. Capital at risk. Read the full disclaimer
© ETC Group 2019-2024 | All rights reserved


Fem spanska fonder som har ökat med +12% under 2025

ASRP ETF ett spel på medtech företag världen över

Europafokuserade ETPer ser större andel av flödena under första kvartalet

JAAA ETF an aktiv satsning på säkerställda obligationer

Can crypto outperform amidst the current market turmoil?
Crypto Market Risks & Opportunities: Insights on Bybit Hack, Bitcoin, and Institutional Adoption

Montrose storsatsning på ETFer fortsätter – lanserar Sveriges första globala ETF med hävstång

Svenskarna har en ny favorit-ETF

MONTLEV, Sveriges första globala ETF med hävstång

Sju börshandlade fonder som investerar i försvarssektorn
-

 Nyheter4 veckor sedan
Crypto Market Risks & Opportunities: Insights on Bybit Hack, Bitcoin, and Institutional Adoption
-
 Nyheter3 veckor sedan
Montrose storsatsning på ETFer fortsätter – lanserar Sveriges första globala ETF med hävstång
-
 Nyheter4 veckor sedan
Svenskarna har en ny favorit-ETF
-
 Nyheter3 veckor sedan
MONTLEV, Sveriges första globala ETF med hävstång
-
 Nyheter3 veckor sedan
Sju börshandlade fonder som investerar i försvarssektorn
-

 Nyheter2 veckor sedan
Världens första europeiska försvars-ETF från ett europeiskt ETF-företag lanseras på Xetra och Euronext Paris
-

 Nyheter3 veckor sedan
Europeisk försvarsutgiftsboom: Viktiga investeringsmöjligheter mitt i globala förändringar
-

 Nyheter2 veckor sedan
21Shares bildar exklusivt partnerskap med House of Doge för att lansera Dogecoin ETP i Europa