
Nyheter
Correction potential builds for cotton


Nyheter
Mar.25 crypto update, Research commentary on market turmoil, CIO Notes and ETP performance attribution
A – Research commentaries from last week developments
- Markets reacted to Trump tariffs – Bitcoin stands
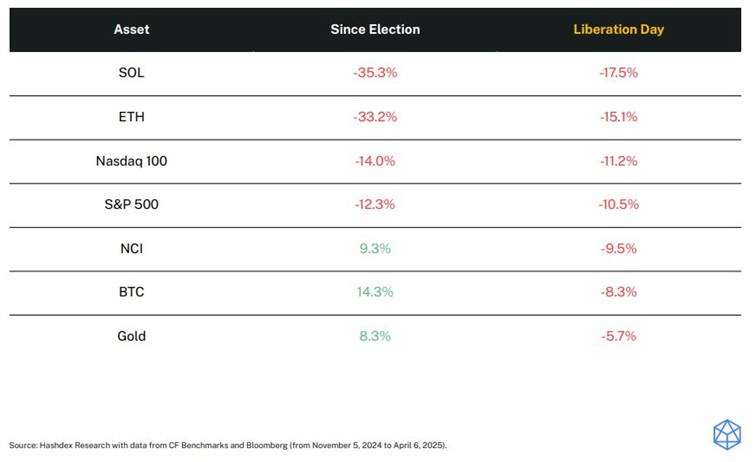
Global markets fell sharply after President Trump’s new 25% tariffs on Chinese imports. Stocks led the decline – the Nasdaq 100 is now down -14% since the election, and the S&P 500 -12.3%. Crypto reacted too, but not uniformly:
• Altcoins such as SOL and ETH were hit hardest (down over 30% since November)
• Bitcoin and the Nasdaq Crypto Index (NCI) showed resilience, gaining +14.3% and +9.3%, respectively since Election
This kind of selloff tends to erase diversification — everything moves together. But it’s essential to take a longer view:
• Since Trump’s election, only three assets have consistently outperformed: Bitcoin, NCI, and gold.
• Last week, only gold outpaced BTC, confirming the role of digital assets as a strategic long-term allocation — even in volatile regimes.
- Regulatory tailwinds are building
The next phase of crypto decoupling could come from policy. In the US, the signals are turning positive:
• The STABLE Act advanced in Congress, with Trump urging swift approval
• A tokenized fund paid $4.17M in dividends last month, proving blockchain’s real-world income potential
• The SEC has launched a review of past crypto guidance — a move toward clearer rules and broader institutional comfort
Bottom line: In a week where most assets fell, crypto stood out. That’s not a coincidence — it’s a signal.
B – CIO Monthly Notes – Crypto’s Political Tailwinds Are Blowing Hard
• Following a week in Washington, our CIO outlines how crypto is gaining bipartisan traction in DC.
• Key takeaway: regulatory clarity is coming faster than expected, and institutions are taking note.
C – March 2025 ETP performance overview
As of 31/03/25 – Source: Hashdex and Bloomberg. Performances in USD.
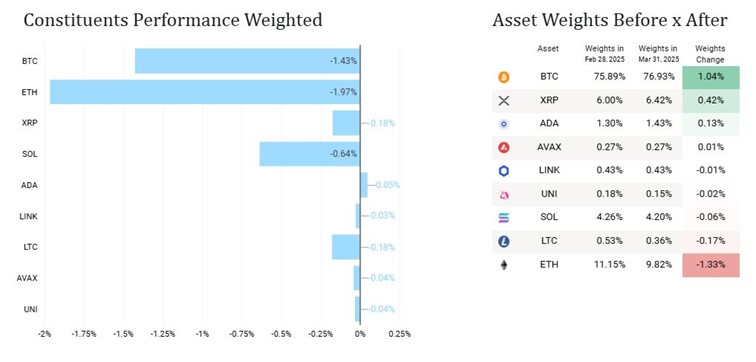
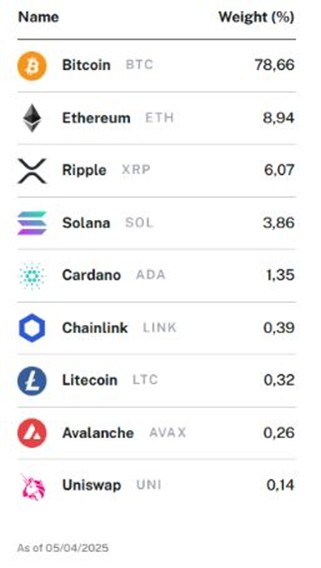
Hashdex Nasdaq Crypto Index ETP (HASH / HDX1) : March: -4.5% | YTD: -19%
Key drivers in March: Bitcoin and Ethereum
March Performance Attribution:
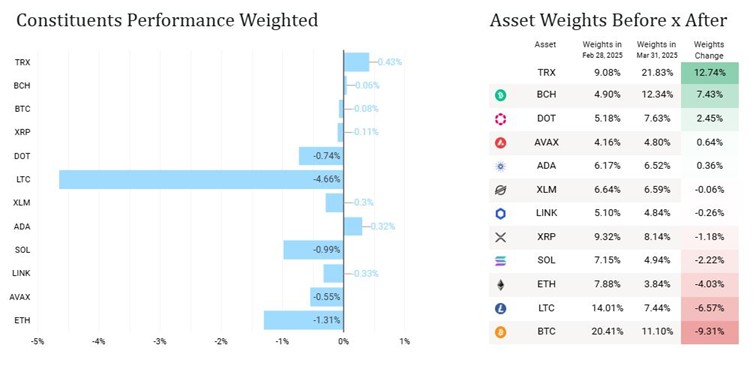
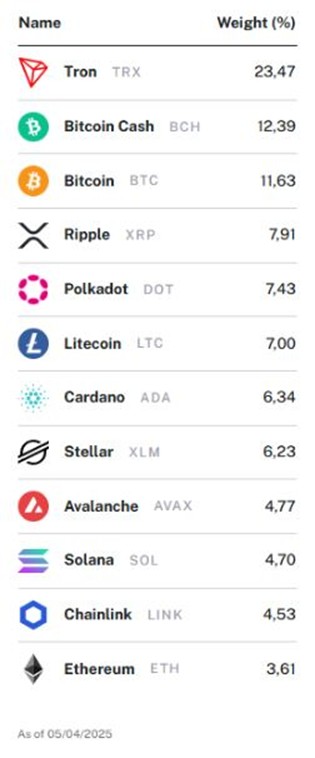
Hashdex Crypto Momentum Factor ETP (HAMO / HDXM): March: -8.5% | YTD: -22%
Key drivers in March: Litecoin, Ethereum and Solana
March Performance Attribution:
Hashdex Multi-Crypto Index ETPs
Hashdex Nasdaq Crypto Index ETP (HASH)
• Broad exposure to BTC, ETH, and major altcoins (SOL, XRP, ADA, etc)
• Quarterly rebalancing – evolutive, market cap-based allocation with no caps (weights and number of constituents)
• Largest crypto index ETP in Europe (+$300m AUM)
• ISIN: CH1184151731 | Tickers: HASH (SIX, Euronext) / HDX1 (Xetra)
• Tradable in USD, EUR, CHF, GBP
• Factsheet / Product page / Index Methodology
Hashdex Crypto Momentum Factor ETP (HAMO/HDXM )
• Momentum-based strategy with monthly rebalancing
• Designed to capture trends across large-cap crypto assets
• ISIN: CH1218734544 | Tickers: HAMO (SIX, Euronext) / HDXM (Xetra)
• Tradable in USD, EUR, CHF, GBP
• Factsheet / Product page / Index Methodology


Mar.25 crypto update, Research commentary on market turmoil, CIO Notes and ETP performance attribution

NXTB ETP spårar värdet på kryptovalutan Bitcoin

Nya ETF- och ETP-noteringar på Xetra den 8 april 2025

21Shares bildar exklusivt partnerskap med House of Doge för att lansera Dogecoin ETP i Europa

8RMY en ny börshandlad fond från HanETF på Xetra

Fonder som ger exponering mot försvarsindustrin

Warren Buffetts råd om vad man ska göra när börsen kraschar

De bästa börshandlade fonderna för tyska utdelningsaktier
Crypto Market Risks & Opportunities: Insights on Bybit Hack, Bitcoin, and Institutional Adoption

Svenskarna har en ny favorit-ETF
-
 Nyheter3 veckor sedan
Fonder som ger exponering mot försvarsindustrin
-
 Nyheter2 veckor sedan
Warren Buffetts råd om vad man ska göra när börsen kraschar
-
 Nyheter4 veckor sedan
De bästa börshandlade fonderna för tyska utdelningsaktier
-

 Nyheter2 veckor sedan
Crypto Market Risks & Opportunities: Insights on Bybit Hack, Bitcoin, and Institutional Adoption
-
 Nyheter1 vecka sedan
Svenskarna har en ny favorit-ETF
-
 Nyheter7 dagar sedan
Montrose storsatsning på ETFer fortsätter – lanserar Sveriges första globala ETF med hävstång
-

 Nyheter3 veckor sedan
HANetf lanserar Europa-fokuserad försvars-ETF
-

 Nyheter3 veckor sedan
En av de mest nedladdade finansapparna i Sverige