ETF Securities Commodity Research: Above-target inflation will be supportive for goldand silver
Highlights
An upside surprise in US inflation will drive gold higher by the end of this year, before paring gains by Q2 2018.
We expect silver to outpace gold, rising 13% by end of Q2 2018, bringing the elevated gold to silver ratio down closer to its long-term average.
Downside risks in both metals will be limited by the gradual nature of Federal Reserve policy changes.
In this note we provide an update to our gold and silver forecasts using our in-house modelsi. Our gold model has four key inputs: US inflation rates, US nominal 10-year government bond yields, US dollar exchange rate and speculative positioning in gold futures. Our silver model uses our gold price forecast in combination with drivers of physical demand and supply silver.
Base case for gold: largely sideways
We expect gold to rise to US$1260/oz by year-end and then decline to US$1230 by Q2 2018. It is largely an upside surprise in inflation that will drive the price of gold higher. Rising interest rates will cap gains. Downside pressure on gold will be limited by the gradual nature of rate increases.
(click to enlarge)
Fed tightening continues…
We believe that the Federal Reserve (Fed) will raise interest rates once more in 2017 and reduce the size of its balance sheet by allowing securities it holds to mature without reinvesting proceeds. The Fed will continue to tighten policy in 2018 with a combination of a rate increase and further balance sheet reduction in the first half of the year.
US nominal 10-year yields are likely to rise to 2.8% by the end of this year and 3.2% by mid 2018 from 2.4% at the moment as a result of Fed tightening. We expect the yield curve to flatten less than in normal rate-tightening cycles because part of the tightening is targeted at the longer end of the curve (i.e. the balance sheet shrinking due to the Fed not reinvesting maturing bonds).
…but real interest rates to remain subdued
However, we believe that inflation will rise above 2%, dampening the increase in real interest rates. Strength in the labour market has not translated in higher wages yet, but we believe it will do. The Congressional Budget Office’s estimate of the long-term natural rate of unemployment is 4.7%. With the current unemployment rate at 4.4%, we should start to see inflation rise. We expect CPI inflation of 2.3% by year-end and 2.5% by Q2 2018.
US Dollar to appreciate
Rising US interest rates and widening interest rate differentials are likely to push the trade-weighted dollar up by 3% by year-end and 6% by Q2 2018. A US Dollar appreciation will be negative for the gold price.
Speculative positioning to remain elevated by historic standards
Investment in gold is often a gauge of investor anxiety. While we think that some of the key risks around the rise of populism in Europe have eased, a number of other risks are present and investors are likely to seek hedges in the form of gold. Some of these risks include (but are obviously not limited to):
Continued sabre rattling between nuclear powers of US and North Korea
Rising tensions in the Middle East as Qatar fails to bow to its neighbours demands
A surge in trade protectionism as US follows through with recent threats
To be clear, we don’t expect a full-scale war as a base case scenario, but the presence of these risks will weigh on investors minds. We expect speculative positioning in gold futures to remain around 120k contracts net long, somewhat higher than the long-term average of 89k, but significantly below the post- Brexit high of 348k in July 2017.
Alternative scenarios
The following table summarises alternative scenarios for gold in Q2 2018.
(click to enlarge)
In the bear case for gold, the Fed becomes more hawkish, driving rates up more aggressively and shrinks its balance sheet quicker. Given typical lags, inflation will not have fallen below 2% by that time. Subdued interest in gold will drive speculative positioning down to 40k contracts net long.
In the bull case for gold, the Fed gets complacent in tightening policy as it waits for further confirmation that the recovery is progressing. Inflation runs higher at 3.1%. Speculative positioning in gold jumps up to 200k contracts net long as investors become concerned about a disorderly unwind after a protracted period of loose policy.
Silver to outperform gold
We expect silver to rise to US$18.70/oz by year-end before easing to US$18.10 by Q2 2018. Silver has a strong relationship with gold with nearly an 80% price correlation with the metal. However, silver has more attributes of a ‘regular’ commodity than gold in that physical demand and supply has more influence on its price.
In our model for silver, an increase in the global purchasing managers indices (PMI) acts as a proxy for industrial demand growth. We have seen that the global PMI has plateaued in recent months after reaching a five-year high earlier this year. We expect a modest decline as emerging market countries continue to place a drag on the global index.
As a proxy for supply we look at mine investment. As 75% of silver comes as a by-product of mining for other metals we look at aggregate mining capex across the top 100 metal miners. Mining capex has been declining sharply. Looking at the top 100 miners, capex has declined by 23% over the past year. Six months ago the year-on-year drop was measured as much as 27%.
As another proxy for supply we use exchange inventory of silver. Increases in exchange inventory indicate that more of the metal is readily available. Silver exchange inventory has been elevated most of this year, but we assume it will come down to levels seen a year-ago after a sustained mining supply deficit in silver.
(click to enlarge)
Relative prices closer to normal
The stronger growth in silver prices should see a correction in the elevated gold-to-silver ratio that we have seen in the past year. From today’s prices, gold is expected to be broadly flat by Q2 2018 while silver will gain close to 13%.
(click to enlarge)
For more information contact:
ETF Securities Research team ETF Securities (UK) Limited T +44 (0) 207 448 4336 E info@etfsecurities.com
Important Information
This communication has been issued and approved for the purpose of section 21 of the Financial Services and Markets Act 2000 by ETF Securities (UK) Limited (“ETFS UK”) which is authorised and regulated by the United Kingdom Financial Conduct Authority (the “FCA”).
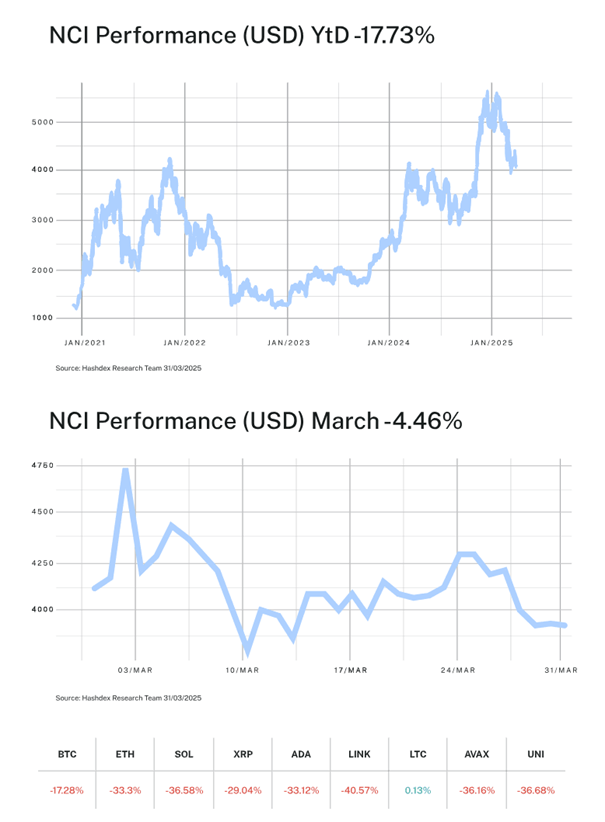
The impact of US tariffs continues to dominate market sentiment and risk assets, including crypto, struggled with this uncertainty throughout the month. The Nasdaq Crypto Index™ (NCI™) fell 4.46% in March as the S&P 500 and Nasdaq 100 dropped 5.63% and 7.61%, respectively.
Despite the macro uncertainty from Washington, US policymakers are continuing to embrace crypto in an unprecedented way, including launching a Bitcoin Strategic Reserve, Digital Asset Stockpile, and engaging in expansive work at the regulatory agencies and in Congress.
Our team spent the last week of the month in Washington, meeting with regulators to share our experiences and views on what’s most important for crypto investors in the US. In his latest Notes from the CIO, Samir Kerbage shares what he learned from these meetings and how investors should be thinking about the new regulatory regime in the US.
As always, we are greatly appreciative of your trust in us and are here to answer any questions you may have.
-Your Partners at Hashdex
Market Review
March was marked by the tariff dispute triggered by the Trump administration. Back-and-forth fiscal policies, threats, and retaliations dominated the month’s agenda. The uncertain macroeconomic environment put investors into a defensive stance and negatively impacted crypto assets. The Nasdaq Crypto Index™ (NCI™) closed the month down -4.46% after a period of high volatility. Major market indices, the S&P 500 and Nasdaq-100, also recorded steep declines of -5.63% and -7.61%, respectively. These concurrent drawdowns across equities and crypto underscored March’s broad market caution, as trade war uncertainty prompted investors to flee risk assets.
During times of uncertainty, it is common to observe increased correlation among different classes of risk assets. This pattern played out in March: the 6-month rolling correlation of monthly returns between the NCI™ and the Nasdaq-100 surged to roughly 0.91 (see chart below), its highest level since 2021, indicating that crypto assets were moving almost in lockstep with tech stocks. This spike in correlation confirms that crypto was behaving like a high-beta extension of the tech sector—an amplified version of the Nasdaq-100. The lack of clarity in the global landscape leads investors to reduce their risk exposure and seek protection, a movement known in financial markets as “risk-off” allocation.
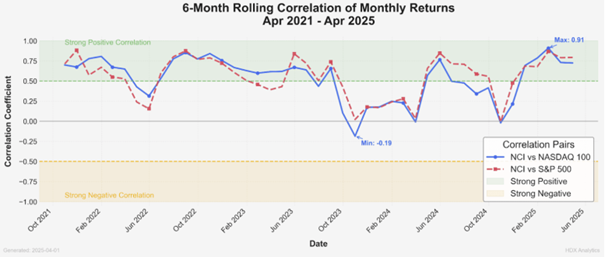
6-Month Rolling Correlation of Monthly Returns between the Nasdaq Crypto Index and Nasdaq-100 (Apr 2021–Apr 2025).
The chart illustrates how this correlation has been increasing since the American elections in November 2024 and spiked to approximately 0.91 in the most recent period—a multi-year high. This visual evidence reinforces the view that crypto assets have been moving closely in tandem with tech stocks, effectively acting as a high-beta version of the Nasdaq-100 during the March risk-off phase.
Following this trend, risk reduction was evident within the crypto asset class. Among the NCI’s constituents, Bitcoin (BTC) posted a decline of -1.93%, withstanding the downturn far better than other constituents such as Ether (ETH, -17.4%) and Litecoin (LTC, -34.6%). BTC’s relatively mild drop in this sell-off aligns with the idea that it increasingly trades like a high-beta proxy for large-cap tech. It still declined, but less severely, whereas smaller-cap crypto assets behaved more like speculative growth stocks and suffered outsized losses. The only exception to the negative results was Cardano (ADA), which surprised with a positive return of 3.88% despite no significant protocol developments during the month.
Thematic indices also faced a challenging environment. As highlighted in previous letters, smaller capitalization assets tend to suffer more during periods of market stress, mirroring how speculative small-cap stocks are hit hardest in equity sell-offs. The biggest negative highlight was the Digital Culture Index, which dropped -17.45%, followed by the Decentralized Finance (DeFi) and Smart Contract Platform (Web3) indices, which fell -16.73% and -12.07%, respectively. The Vinter Hashdex Risk Parity Momentum Index recorded a negative result of -8.26% but outperformed the three other thematic indices, benefiting from its high allocation in BTC and TRX (which gained 4.68%). The heavy weighting in BTC – the more resilient large-cap crypto – helped cushion this index, underscoring the relevance of the momentum factor in a well-diversified strategy during times of market stress.
The market remains on the lookout for the outcome of the fiscal policy discussions, hoping for a reduction in uncertainties and an end to the tariff war. That would likely mark the moment when investors regain their appetite for risk assets, including crypto assets. The U.S. government has also signaled interest in advancing the crypto agenda, a development that could drive the asset class to a new level of adoption. We remain confident in our positive outlook for the rest of the year and the long term.
Top Stories
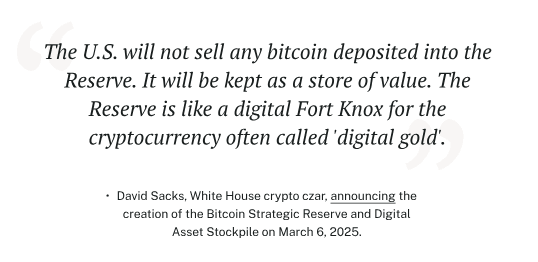
US creates Bitcoin Strategic Reserve and Digital Asset Stockpile
The Bitcoin Reserve will be capitalized with BTC owned by the Department of Treasury, which could further increase via new budget-neutral acquisitions. The stockpile will also include assets owned by the Treasury. This marks a major milestone, with the US government starting to integrate major crypto assets and continues the new administration’s work to lead the global crypto economy.
Stablecoins surpass $230 billion in market value
The total stablecoins market capitalization surpassed $230 billion amid institutional demand for dollar-backed digital assets. This showcases one of the most successful applications for crypto technology enhancing traditional financial payments. It could also pave the way for new use cases that require a strong and reliable global payment system.
FDIC eases banks’ ability to engage in crypto activities
The FDIC has rescinded previous guidelines which prevented financial institutions from engaging with crypto activities without prior sign-off. By removing bureaucratic hurdles, banks may more readily over crypto-related services, potentially leading to broader adoption and integration of digital assets into the financial system.
Invesco BulletShares 2028 EUR Corporate Bond UCITSETF EUR Acc (BSE8 ETF) med ISIN IE00079EUF59, försöker följa Bloomberg 2028 Maturity EUR Corporate Bond Screened-index. Bloomberg 2028 Maturity EUR Corporate Bond Screened Index följer företagsobligationer denominerade i EUR. Indexet speglar inte ett konstant löptidsintervall (som är fallet med de flesta andra obligationsindex). Istället ingår endast obligationer som förfaller under det angivna året (här: 2028) i indexet. Indexet består av ESG (environmental, social and governance) screenade företagsobligationer. Betyg: Investment Grade. Löptid: december 2028 (Denna ETF kommer att stängas efteråt).
Den börshandlade fondens TER (total cost ratio) uppgår till 0,10 % p.a. Invesco BulletShares 2028 EUR Corporate Bond UCITSETF EUR Acc är den billigaste och största ETF som följer Bloomberg 2028 Maturity EUR Corporate Bond Screened index. ETFen replikerar det underliggande indexets prestanda genom samplingsteknik (köper ett urval av de mest relevanta indexbeståndsdelarna). Ränteintäkterna (kupongerna) i ETFen ackumuleras och återinvesteras.
Invesco BulletShares 2028 EUR Corporate Bond UCITSETF EUR Accär en mycket liten ETF med tillgångar på 6 miljoner euro under förvaltning. Denna ETF lanserades den 18 juni 2024 och har sin hemvist i Irland.
Produktbeskrivning
Invesco BulletShares 2028 EUR Corporate Bond UCITSETFAcc syftar till att tillhandahålla den totala avkastningen för Bloomberg 2028 Maturity EUR Corporate Bond Screened Index (”Referensindexet”), minus avgifternas inverkan. Fonden har en fast löptid och kommer att upphöra på Förfallodagen.
Referensindexet är utformat för att återspegla resultatet för EUR-denominerade, investeringsklassade, fast ränta, skattepliktiga skuldebrev emitterade av företagsemittenter. För att vara kvalificerade för inkludering måste företagsvärdepapper ha minst 300 miljoner euro i nominellt utestående belopp och en effektiv löptid på eller mellan 1 januari 2028 och 31 december 2028.
Värdepapper är uteslutna om emittenter: 1) är inblandade i kontroversiella vapen, handeldvapen, militära kontrakt, oljesand, termiskt kol eller tobak; 2) inte har en kontroversnivå enligt definitionen av Sustainalytics eller har en Sustainalytics-kontroversnivå högre än 4; 3) anses inte följa principerna i FN:s Global Compact; eller 4) kommer från tillväxtmarknader.
Portföljförvaltarna strävar efter att uppnå fondens mål genom att tillämpa en urvalsstrategi, som inkluderar användning av kvantitativ analys, för att välja en andel av värdepapperen från referensindexet som representerar hela indexets egenskaper, med hjälp av faktorer som index- vägd genomsnittlig varaktighet, industrisektorer, landvikter och kreditkvalitet. När en företagsobligation som innehas av fonden når förfallodag kommer kontanterna som fonden tar emot att användas för att investera i kortfristiga EUR-denominerade skulder.
ETFen förvaltas passivt.
En investering i denna fond är ett förvärv av andelar i en passivt förvaltad indexföljande fond snarare än i de underliggande tillgångarna som ägs av fonden.
”Förfallodag”: den andra onsdagen i december 2026 eller sådant annat datum som bestäms av styrelseledamöterna och meddelas aktieägarna.
Det betyder att det går att handla andelar i denna ETF genom de flesta svenska banker och Internetmäklare, till exempel DEGIRO, Nordnet, Aktieinvest och Avanza.
Det senaste veckan var den värsta veckan för världens aktiemarknader sedan covid-lockdown-kollapsen i mars 2020. Det var dessutom den värsta vecka för amerikanska aktier sedan covid-lockdown-kollapsen i mars 2020.
Det amerikanska referensindexet NASDAQ gick tillsammans med i Russell 2000, ett amerikanskt aktiemarknadsindex för småbolag i björnmarknadens territorium när dessa båda index fallit med över 20 procent från sina toppnoteringar. Samtidigt föll amerikanska Dow Jones med 2 200 punkter under fredagen.
Den grupp av företag som kallas för Mag 7 och har drivit börsuppgången på den amerikanska aktiemarknaden, tappade 1,4 biljoner dollar i börsvärde under veckan – det mest någonsin.
Fredagen den 4 april såh den högsta volymsessionen i historien på den amerikanska aktiemarknaden mätt som det totala antalet omsatta aktier på alla börser.
Det amerikanska VIX-indexet, känt som ”fear and greed-indexet” såg sin största veckorörelse sedan februari 2020. Det var också den värsta veckan för USAskreditmarknader sedan covid-lockdown-krisen, till och med värre än under SVB-bankkrisen.
Oljepriset kraschade med 11 procent under veckan, det största fallet sedan mars 2023 (SVB-kris / tillväxtskräck). Samtidigt rapporterade guldpriset den andra nedgångsvecka i år. Fredagen kursfall var den värsta dagen sedan november 2024. Priset på koppar såg sitt största fall sedan Lehman-kraschen i oktober 2008. Kryptovalutan Bitcoin rapporterade små vinster under veckan.