
Nyheter
A Star-Spangled April for Moats
For the Month Ending April 30, 2016 A Star-Spangled April for Moats
Performance Overview
Moat-rated companies continued their strong start to 2016 in April. U.S.-oriented Morningstar® Wide Moat Focus IndexSM (MWMFTR) topped the S&P 500® Index (5.20% vs. 0.39%) in April and widened the gap in relative performance year-to-date (12.05% vs. 1.74%). On the international front, Morningstar® Global ex-US Moat Focus IndexSM (MGEUMFUN) lagged the MSCI All Country World Index ex USA in April (1.43% vs. 2.63%), but maintained relative outperformance year-to-date (4.09% vs. 2.25%).
U.S. Domestic Moats: Healthcare Rotation Pays Off
St. Jude Medical, Inc. (STJ US) was the big winner among domestic moat-rated companies in April. Late in the month Abbott Laboratories (ABT US) announced its intent to buy STJ US in a deal that is expected to close in the coming fourth quarter. As part of its quarterly review, the MWMFTR Index rotated into several healthcare companies, including STJ US. According to Morningstar, the healthcare sector offered a number of attractive valuation opportunities in March, some of which contributed to MWMFTR’s strong performance in April. Drug manufacturer Allergan plc (AGN US), however, provided no such boost to results. A U.S. Department of Treasury tax ruling squashed any hope for its planned merger with Pfizer, pushing AGN US lower for the month.
International Moats: Oh, Canada
MGEUMFUN’s exposure to financials companies, particularly Canadian banks, contributed to positive performance in April. Only three of the 24 financials companies in the Index posted negative returns last month. Additionally, Russian operator Mobile Telesystems (MTSS RM) has been on a roll since announcing solid fourth quarter results in March. Strains on performance came largely from some of the Index’s consumer discretionary constituents, such as Macau gaming firm Sands China (1928 HK) and Chinese car manufacturer Dongfeng Motor Group Co. (489 HK).
Shooting for the Stars
VanEck Vectors™ Morningstar Wide Moat ETF (MOAT), which seeks to track MWMFTR, received a 5-star Morningstar Rating™ as of April 30, 2016.

Overall Morningstar Rating™ among 1,374 large blend funds as of April 30, 2016.
Moat Investing

Moat Investing provides key insights and performance trends impacting global moat investing based on Morningstar equity research. U.S.-focused MOAT and internationally focused MOTI offer investors global exposure to Morningstar’s moat methodology and valuation principals.
Important Disclosure
For each fund with at least a three-year history, Morningstar calculates a Morningstar Rating based on a Morningstar Risk-Adjusted Return measure that accounts for variation in a fund’s monthly performance (including the effects of sales charges, loads, and redemption fees), placing more emphasis on downward variations and rewarding consistent performance. The top 10% of funds in each category receive 5 stars, the next 22.5% receive 4 stars, the next 35% receive 3 stars, the next 22.5% receive 2 stars and the bottom 10% receive 1 star. (Each share class is counted as a fraction of one fund within this scale and rated separately, which may cause slight variations in the distribution percentages.) The Overall Morningstar Rating for a fund is derived from a weighted average of the performance figures associated with its three-, five- and ten-year (if applicable) Morningstar Rating metrics. VanEck Vectors Morningstar Wide Moat ETF was rated against 1,374 U.S.-domiciled large blend funds for the 3-year period and received 5 stars. Past performance is no guarantee of future results.
©2016 Morningstar, Inc. All Rights Reserved. The information contained herein: (1) is proprietary to Morningstar; (2) may not be copied or distributed; and (3) is not warranted to be accurate, complete or timely. Neither Morningstar nor its content providers are responsible for any damages or losses arising from any use of this information. Past performance is no guarantee of future results.
This commentary is not intended as a recommendation to buy or to sell any of the named securities. Holding will vary for the MOAT and MOTI ETFs and their corresponding Indices.
Index performance is not representative of fund performance. To view fund performance current to the most recent month end, call 800.826.2333 or visit vaneck.com.
An investor cannot invest directly in an index. Returns reflect past performance and do not guarantee future results. Results reflect the reinvestment of dividends and capital gains, if any. Index returns do not represent Fund returns. The Index does not charge management fees or brokerage expenses, nor does the Index lend securities, and no revenues from securities lending were added to the performance shown.
Fair value estimate: the Morningstar analyst’s estimate of what a stock is worth.
Price/Fair Value: ratio of a stock’s trading price to its fair value estimate.
The Morningstar® Wide Moat Focus IndexSM and Morningstar® Global ex-US Moat Focus IndexSM were created and are maintained by Morningstar, Inc. Morningstar, Inc. does not sponsor, endorse, issue, sell, or promote the VanEck Vectors Morningstar Wide Moat ETF or VanEck Vectors Morningstar International Moat ETF and bears no liability with respect to the ETFs or any security. Morningstar® is a registered trademark of Morningstar, Inc. Morningstar Wide Moat Focus Index and Morningstar Global ex-US Moat Focus Index are service marks of Morningstar, Inc.
The Morningstar Wide Moat Focus Index consists of 20 U.S. companies identified as having sustainable, competitive advantages and whose stocks are the most attractively priced, according to Morningstar.
The Morningstar Global ex-US Moat Focus Index consists of 50 companies outside of the U.S. identified as having sustainable, competitive advantages and whose stocks are the most attractively priced, according to Morningstar.
The S&P 500 Index consists of 500 widely held common stocks covering the leading industries of the U.S. economy.
MSCI All Country World Index ex USA captures large and mid cap representation across 22 Developed Markets countries (excluding the U.S.) and 23 Emerging Markets countries.
An investment in the VanEck Vectors Morningstar Wide Moat ETF (MOAT) may be subject to risks which include, among others, fluctuations in value due to market and economic conditions or factors relating to specific issuers. Medium-capitalization companies may be subject to elevated risks. The Fund’s assets may be concentrated in a particular sector and may be subject to more risk than investments in a diverse group of sectors.
An investment in the VanEck Vectors Morningstar International Moat ETF (MOTI) may be subject to risks which include, among others, fluctuations in value due to market and economic conditions or factors relating to specific issuers. Foreign and emerging markets investments are subject to risks, which include changes in economic and political conditions, foreign currency fluctuations, changes in foreign regulations, changes in currency exchange rates, unstable governments, and limited trading capacity which may make these investments volatile in price or difficult to trade. Medium-capitalization companies may be subject to elevated risks. The Fund’s assets may be concentrated in a particular sector and may be subject to more risk than investments in a diverse group of sectors.
Fund shares are not individually redeemable and will be issued and redeemed at their Net Asset Value (NAV) only through certain authorized broker-dealers in large, specified blocks of shares called ”creation units” and otherwise can be bought and sold only through exchange trading. Creation units are issued and redeemed principally in kind. Shares may trade at a premium or discount to their NAV in the secondary market. You will incur brokerage expenses when trading Fund shares in the secondary market. Past performance is no guarantee of future results. Returns for actual Fund investments may differ from what is shown because of differences in timing, the amount invested, and fees and expenses.
Investing involves substantial risk and high volatility, including possible loss of principal. An investor should consider the investment objective, risks, charges and expenses of a Fund carefully before investing. To obtain a prospectus and summary prospectus, which contain this and other information, call 800.826.2333. Please read the prospectus and summary prospectus carefully before investing.


President Trump announced a highly aggressive tariff package—one with broad macroeconomic implications—and global markets reacted sharply. In this environment of heightened volatility, we urge investors to maintain perspective, just as they should when prices are volatile to the upside (e.g., last year’s post-election rally).
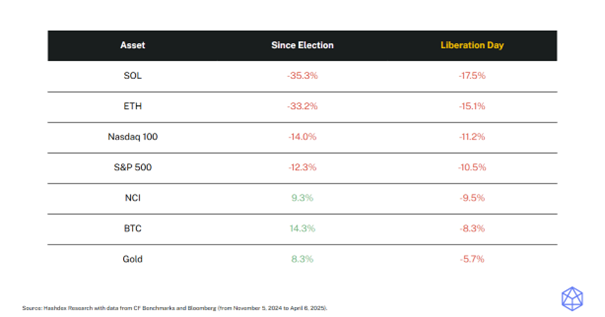
Notably, since the election, bitcoin and the Nasdaq Crypto Index have outperformed gold, the S&P 500, and Nasdaq 100. Even in the wake of the tariffs, only gold has outpaced bitcoin and the NCI—highlighting the relative strength of digital assets amid global market declines.
Market Highlights
Stablecoin legislation advances in US
The House Financial Services Committee voted to advance a monumental bill to regulate stablecoins, the STABLE Act, following the Senate Banking Committee approval of similar legislation earlier this year.
President Trump has said he wants stablecoin legislation approved by Congress before its August recess, reinforcing the new administration’s focus on establishing clear crypto regulation.
Tokenized fund sets dividend benchmark
BlackRock’s BUIDL paid an estimated $4.17 million in monthly dividends during March.
This highlights the potential of crypto to create attractive investment instruments, such as tokenized funds, which stood out this month paying massive dividends and setting a new benchmark for the class.
SEC chair orders review of crypto guidance
Acting SEC Chair Mark T. Uyeda ordered a review of past staff guidance on crypto, including risk warnings and interpretations of the Howey test.
This move, like others before, signals a broader shift toward a more open regulatory approach, potentially strengthening the presence of bitcoin and other digital assets in the US in the near future.
Market Metrics
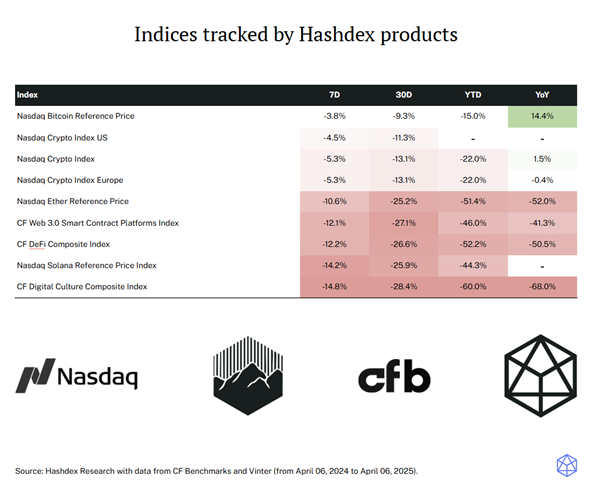
The NCITM constituents had another negative week, with only XRP (-7.0%) and BTC (-3.8%) avoiding double-digit losses. The overall NCITM decline of -5.2% was cushioned by BTC’s relative resilience, as it performed better as a store-of-value asset. However, the drop still reflects a broader risk-off sentiment across all markets, driven by Trump’s tariff policies and growing macroeconomic uncertainties that are prompting investors to reassess their positions.
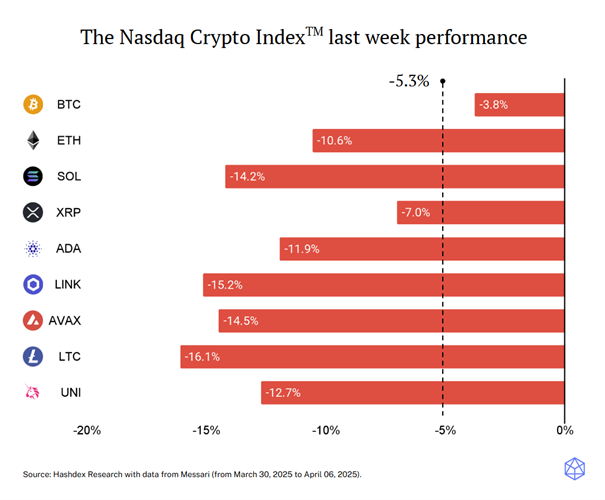
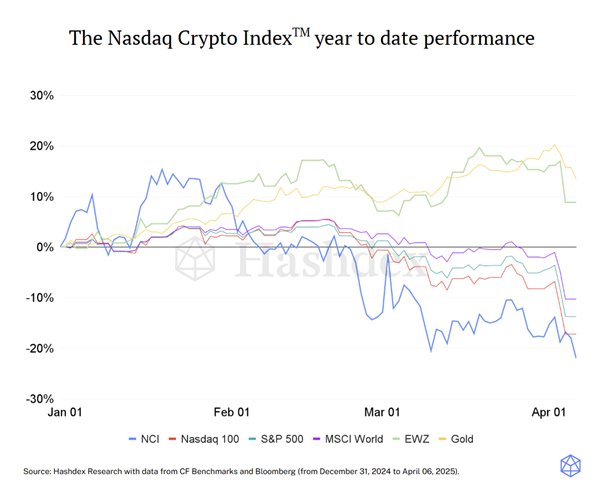
This week, the NCITM fell -5.3%, narrowing the gap with traditional indices such as the Nasdaq 100 (-9.8%) and S&P 500 (-9.1%) which experienced sharper losses following Trump’s tariff announcements. BTC (-3.8%) performed similarly to gold (-3.3%), though gold remains the top-performing asset class year-to-date. The week reinforced the risk-off sentiment, with investors broadly retreating from risk assets. Still, it also highlighted crypto’s growing relevance, as the most volatile asset class managed to outperform traditional markets in a stressed environment.


WEL8 ETF är en satsning på globala finansföretag

Tariffs spark turmoil: BTC holds its ground

JMES ETF en aktivt förvaltad fond från JPMorgan

Världens första europeiska försvars-ETF från ett europeiskt ETF-företag lanseras på Xetra och Euronext Paris

BSE7 ETF investerar i företagsobligationer med förfall 2027

Fonder som ger exponering mot försvarsindustrin

WisdomTree lanserar europeisk försvarsfond.

Warren Buffetts råd om vad man ska göra när börsen kraschar

De bästa börshandlade fonderna för tyska utdelningsaktier

Trumps återkomst får europeiska aktier att rusa
-
 Nyheter2 veckor sedan
Fonder som ger exponering mot försvarsindustrin
-
 Nyheter4 veckor sedan
WisdomTree lanserar europeisk försvarsfond.
-
 Nyheter2 veckor sedan
Warren Buffetts råd om vad man ska göra när börsen kraschar
-
 Nyheter3 veckor sedan
De bästa börshandlade fonderna för tyska utdelningsaktier
-
 Nyheter4 veckor sedan
Trumps återkomst får europeiska aktier att rusa
-

 Nyheter1 vecka sedan
Svenskarna har en ny favorit-ETF
-

 Nyheter1 vecka sedan
Crypto Market Risks & Opportunities: Insights on Bybit Hack, Bitcoin, and Institutional Adoption
-

 Nyheter3 veckor sedan
HANetf lanserar Europa-fokuserad försvars-ETF