Följ oss
the_ad_group(12516);

Nyheter

A closer look at emerging market equities

Publicerad

den

A closer look at emerging market equities Global equities have been rallying in 2017, led by Asian emerging countries and North America to a lesser extent

ETF Securities Portfolio Insights:  A closer look at emerging market equities

Summary

  • Global equities have been rallying in 2017, led by Asian emerging countries and North America to a lesser extent.
  • The IMF expects Asian economies to continue to drive global growth while central banks in advanced economies are gradually reducing their financial support.
  • We believe US equities are overvalued and see greater opportunities within Latin American and Asian equities for 2018.

Global equities have been rallying since the end of 2016 as strong economic data from major advanced and developing countries combined with a decline in perceived political uncertainty has led to a surge of optimism on the global financial market. Extremely accommodative monetary policies in place since the great financial crisis are bearing fruit. 2018 will likely see these accommodative policies gradually dismantled, opening the path to new investment opportunities.

2017 performance

This year has seen global equities rallying since November 2016 as market participants are more confident that global economic growth has returned and will continue. While few risks remain, with the Italian election next year and the ongoing fight against terrorism and North Korea, the populist threat seen in 2016 has faded away. Unemployment is near its lowest in the US and UK with central banks now focussing on dismantling quantitative easing and tackling the inflation issue.

Looking at 2017 performance so far, the MSCI AC World index rose by 22%, driven by the rally of emerging markets (EM) and more specifically, emerging countries from Asia (39%). The developed markets (DM) with North America come second at 19.5%, followed by emerging Latin America at 18.5%. While one would expect volatility to pick up, 2017 saw the market volatility index (VIX) at its lowest level ever, at 9.6 on average, compared to 20 its historical average, suggesting that investors could increase their allocation to equities almost risk free.

Of the top 20 performers, 75% are emerging market countries. Argentina is leading the board with 62.6% year-to-date while China comes fourth (52%) and India eleventh (25.7%).

In its October World Economic Outlook, the International Monetary Fund (IMF) estimated global growth at 3.6% in 2017 and 3.7% in 2018 from 3.2% in 2016 driven by rising industrial activities and business and consumer confidence. Global growth will be mainly driven by EM countries projected at 4.6% in 2017 and 4.9% in 2018. China GDP has been revised upward by 0.2% compared to April, at 6.8% in 2017 and 6.5% in 2018 while India GDP for 2017 was revised down from 7.2% to 6.7%. In Latin America, Argentina is expected to rebound after last year’s recession with growth projected at 2.5% for 2017 and 2018 as consumption and investment recover.

What are the ratios saying?

The cyclically adjusted price to earnings ratio (CAPE) of DM over EM shows that developing countries remain attractive from a valuation point of view. Whilst the MSCI Emerging Market index has returned 30% year-to-date, the below chart suggests there is still scope for further gains in 2018.

In the following chart, the Latin American countries Argentina, Brazil, Colombia, Mexico and Chile, appear to be the most undervalued. Despite prices for these countries rising by 23% on average, the CAPE ratio remains below their respective historical averages driven by lower-than-average real earnings. However, all except Chile saw their real earnings growing this year in absolute terms, suggesting further potential catch-up of their earnings in the near term.

At the other end of the spectrum, US, Japan and few European countries are considered as overvalued. The CAPE ratio for each stands above their historical level due to real earnings having already catched up with its respective historical level and price rally. Further gains would be more difficult to justify.

A closer look at China

Xi Jinping came out of the 19th Congress of the Chinese Communist Party stronger than ever. Elevated to the same level as Mao Zedong, the president of the Republic of China has been given more power than any of his contemporary predecessors and with no one in its close committee potentially qualified to replace him in five years. With Xi having a history of stalling reform, we may see the implementation of short term stimulus, as opposed to long term structural reforms, continue. This should be positive for Chinese equities as the country focuses on sustainable growth, attracting foreign investment and remaining the largest consumers of commodities to meet the need of its economy and population. The outcome has initially been positively received as the MSCI China Index gained 8% one month following the Congress before declining recently as Chinese economic activities continue to show signs of a mild slowdown.

The above chart shows that China CAPE ratio currently stands above its historical level, suggesting that Chinese equities are overvalued. However, the surge of the MSCI China Index price level has been the main driver of the increase in the CAPE ratio. The index real earnings per share have been below its historical average over the past two years but are gradually recovering toward its mean since the beginning of the year. This picture combined with the potential decade length investiture of the “Strongman” suggests further potential upside for Chinese equities in the medium term.

Non-resident capital inflows in EM, mainly China, reached a bottom in 2015, according to the IMF, on concerns over the impact the US taper tantrum could have on EM asset prices and the potential depreciation of the Yuan. Inflows have revived since but is still half of the volume seen at its peak in Q1 2013. The recovery of investor sentiment regarding the global economy should see capital inflows in EM assets increase further in 2018.

Important Information

General

This communication has been issued and approved for the purpose of section 21 of the Financial Services and Markets Act 2000 by ETF Securities (UK) Limited (“ETFS UK”) which is authorised and regulated by the United Kingdom Financial Conduct Authority (the “FCA”).

The information contained in this communication is for your general information only and is neither an offer for sale nor a solicitation of an offer to buy securities. This communication should not be used as the basis for any investment decision. Historical performance is not an indication of future performance and any investments may go down in value.

Fortsätt läsa
Annons
Klicka för att kommentera

Skriv en kommentar

Din e-postadress kommer inte publiceras. Obligatoriska fält är märkta *

Nyheter

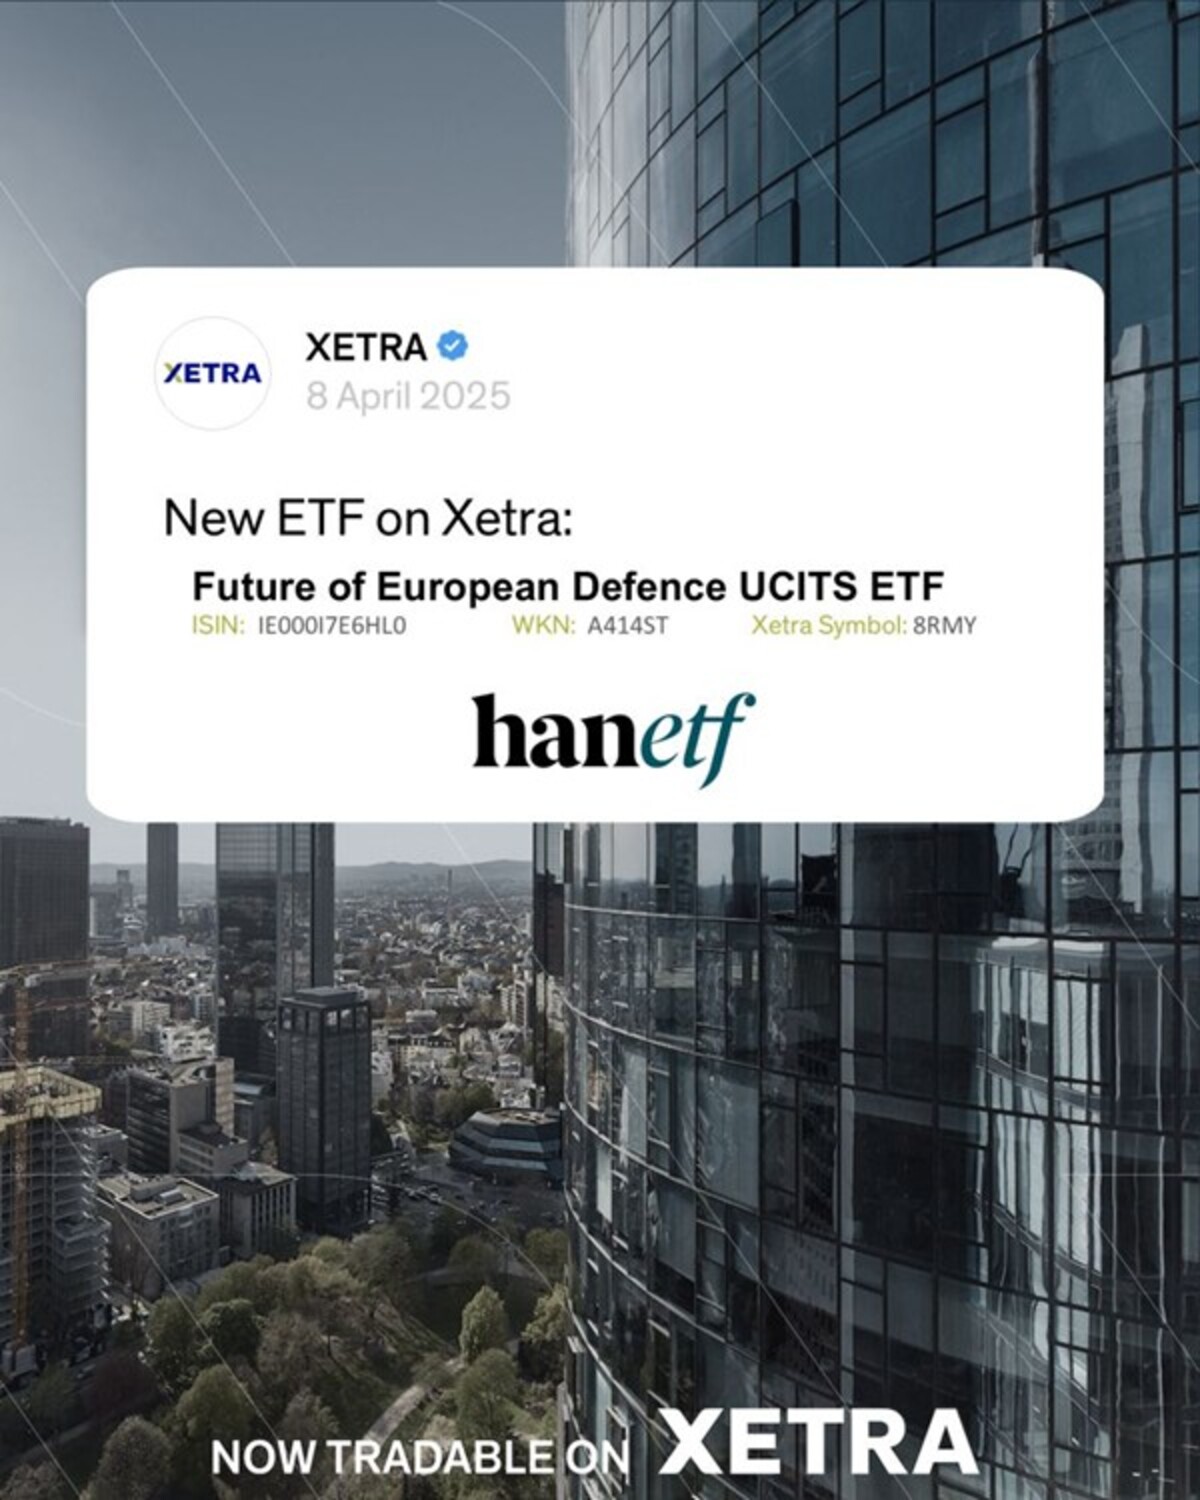
8RMY en ny börshandlad fond från HanETF på Xetra

Publicerad

den

The Future of European Defence UCITS ETF (8RMY) investerar i försvarsföretag som genererar minst 50 procent av sina intäkter från tillverkning och utveckling av militära flygplan, försvarsutrustning eller cybersäkerhetskontrakt med ett NATO+-medlemsland. Endast företag med huvudkontor i ett NATO+-land beaktas, förutom USA.

The Future of European Defence UCITS ETF (8RMY) investerar i försvarsföretag som genererar minst 50 procent av sina intäkter från tillverkning och utveckling av militära flygplan, försvarsutrustning eller cybersäkerhetskontrakt med ett NATO+-medlemsland. Endast företag med huvudkontor i ett NATO+-land beaktas, förutom USA.

Handla 8RMY ETF

Future of European Defence UCITS ETF (ticker: 8RMY) är en europeisk börshandlad fond. Denna fond handlas på flera olika börser, till exempel Deutsche Boerse Xetra och Euronext Paris. Av den anledningen förekommer olika kortnamn på samma börshandlade fond.

Det betyder att det går att handla andelar i denna ETF genom de flesta svenska banker och Internetmäklare, till exempel  NordnetSAVRDEGIRO och Avanza.

Fortsätt läsa

Nyheter

Investera i Polen med börshandlade fonder

Publicerad

den

Det enklaste sättet att investera i Polen är att investera i ett brett marknadsindex. Detta kan göras till låg kostnad genom att använda ETFer som ger exponering mot Warsawabörsen (polska: Giełda Papierów Wartościowych w Warszawie (GPW)).

Det enklaste sättet att investera i Polen är att investera i ett brett marknadsindex. Detta kan göras till låg kostnad genom att använda ETFer som ger exponering mot Warsawabörsen (polska: Giełda Papierów Wartościowych w Warszawie (GPW)).

På den polska aktiemarknaden hittar du två index som spåras av ETFer. Alternativt kan du investera i index på Östeuropa.

De bästa indexen för ETFer för att investera i Polen

För en investering på den polska aktiemarknaden finns det två index tillgängliga som spåras av två ETFer. På MSCI Poland index finns en ETF. På WIG 20-indexet finns en ETF. Den totala kostnadskvoten (TER) för ETFer på dessa index är mellan 0,74 och 1,38 % p.a.

IndexFokusAntal ETFerAntal aktierBeskrivning
MSCI PolandPolen115MSCI Poland-index spårar ledande aktier på den polska marknaden.
WIG 20Polen120WIG 20-indexet följer de 20 största polska aktierna på Warszawabörsen.

De billigaste polska ETFerna efter total kostnadskvot (TER)

I skrivande stund känner vi endast till ETFer för den som vill investera i Polen från Europa, iShares MSCI Poland UCITS ETF USD (Acc) och Expat Poland WIG20 UCITS ETF. De är båda två relativt dyra för att vara ETFer, men Polen är en svår marknad att investera i direkt varför de kan fungera som ett alternativ för den som vill ha exponering mot polska aktier.

NamnFörvaltningskostnad
iShares MSCI Poland UCITS ETF USD (Acc)+0.74% p.a.
Expat Poland WIG20 UCITS ETF+1.38% p.a.

Handla IBCJ ETF

iShares MSCI Poland UCITS ETF USD (Acc) (IBCJ ETF) är en europeisk börshandlad fond. Denna fond handlas på flera olika börser, till exempel Deutsche Boerse Xetra, Euronext Paris och London Stock Exchange. Av den anledningen förekommer olika kortnamn på samma börshandlade fond.

Det betyder att det går att handla andelar i denna ETF genom de flesta svenska banker och Internetmäklare, till exempel  NordnetSAVRDEGIRO och Avanza.

Handla PLX ETF

Expat Poland WIG20 UCITS ETF (PLX ETF) är en europeisk börshandlad fond. Denna fond handlas på flera olika börser, till exempel Deutsche Boerse Xetra.

Det betyder att det går att handla andelar i denna ETF genom de flesta svenska banker och Internetmäklare, till exempel  NordnetSAVRDEGIRO och Avanza.

Fortsätt läsa

Nyheter

BSE6 ETF investerar i företagsobligationer som förfaller 2026

Publicerad

den

Invesco BulletShares 2026 EUR Corporate Bond UCITS ETF EUR Acc (BSE6 ETF) med ISIN IE0004QWOTD5, försöker följa Bloomberg 2026 Maturity EUR Corporate Bond Screened-index. Bloomberg 2026 Maturity EUR Corporate Bond Screened Index följer företagsobligationer denominerade i EUR. Indexet speglar inte ett konstant löptidsintervall (som är fallet med de flesta andra obligationsindex). Istället ingår endast obligationer som förfaller under det angivna året (här: 2026) i indexet. Indexet består av ESG (environmental, social and governance) screenade företagsobligationer. Betyg: Investment Grade. Löptid: december 2026 (Denna ETF kommer att stängas efteråt).

Invesco BulletShares 2026 EUR Corporate Bond UCITS ETF EUR Acc (BSE6 ETF) med ISIN IE0004QWOTD5, försöker följa Bloomberg 2026 Maturity EUR Corporate Bond Screened-index. Bloomberg 2026 Maturity EUR Corporate Bond Screened Index följer företagsobligationer denominerade i EUR. Indexet speglar inte ett konstant löptidsintervall (som är fallet med de flesta andra obligationsindex). Istället ingår endast obligationer som förfaller under det angivna året (här: 2026) i indexet. Indexet består av ESG (environmental, social and governance) screenade företagsobligationer. Betyg: Investment Grade. Löptid: december 2026 (Denna ETF kommer att stängas efteråt).

Den börshandlade fondens TER (total cost ratio) uppgår till 0,10 % p.a. Invesco BulletShares 2026 EUR Corporate Bond UCITS ETF EUR Acc är den billigaste och största ETF som följer Bloomberg 2026 Maturity EUR Corporate Bond Screened index. ETFen replikerar det underliggande indexets prestanda genom samplingsteknik (köper ett urval av de mest relevanta indexbeståndsdelarna). Ränteintäkterna (kupongerna) ackumuleras och återinvesteras.

Invesco BulletShares 2026 EUR Corporate Bond UCITS ETF EUR Acc är en mycket liten ETF med tillgångar på 6 miljoner euro under förvaltning. Denna ETF lanserades den 18 juni 2024 och har sin hemvist i Irland.

Produktbeskrivning

Invesco BulletShares 2026 EUR Corporate Bond UCITS ETF Acc syftar till att tillhandahålla den totala avkastningen för Bloomberg 2026 Maturity EUR Corporate Bond Screened Index (”Referensindexet”), minus påverkan av avgifter. Fonden har en fast löptid och kommer att upphöra på Förfallodagen.

Referensindexet är utformat för att återspegla resultatet för EUR-denominerade, investeringsklassade, fast ränta, skattepliktiga skuldebrev emitterade av företagsemittenter. För att vara kvalificerade för inkludering måste företagsvärdepapper ha minst 300 miljoner euro i nominellt utestående belopp och en effektiv löptid på eller mellan 1 januari 2026 och 31 december 2026.

Värdepapper är uteslutna om emittenter: 1) är inblandade i kontroversiella vapen, handeldvapen, militära kontrakt, oljesand, termiskt kol eller tobak; 2) inte har en kontroversnivå enligt definitionen av Sustainalytics eller har en Sustainalytics-kontroversnivå högre än 4; 3) anses inte följa principerna i FN:s Global Compact; eller 4) kommer från tillväxtmarknader.

Portföljförvaltarna strävar efter att uppnå fondens mål genom att tillämpa en urvalsstrategi, som inkluderar användning av kvantitativ analys, för att välja en andel av värdepapperen från referensindexet som representerar hela indexets egenskaper, med hjälp av faktorer som index- vägd genomsnittlig varaktighet, industrisektorer, landvikter och kreditkvalitet. När en företagsobligation som innehas av fonden når förfallodag kommer kontanterna som fonden tar emot att användas för att investera i kortfristiga EUR-denominerade skulder.

ETFen förvaltas passivt.

En investering i denna fond är ett förvärv av andelar i en passivt förvaltad indexföljande fond snarare än i de underliggande tillgångarna som ägs av fonden.

Förfallodag”: den andra onsdagen i december 2026 eller sådant annat datum som bestäms av styrelseledamöterna och meddelas aktieägarna.

Handla BSE6 ETF

Invesco BulletShares 2026 EUR Corporate Bond UCITS ETF EUR Acc (BSE6 ETF) är en europeisk börshandlad fond. Denna fond handlas på flera olika börser, till exempel Deutsche Boerse Xetra.

Det betyder att det går att handla andelar i denna ETF genom de flesta svenska banker och Internetmäklare, till exempel DEGIRONordnet, Aktieinvest och Avanza.

Börsnotering

BörsValutaKortnamn
XETRAEURBSE6

Största innehav

NamnCUSIPISINKupongräntaVikt %
Danaher Corp 2.1% 30/09/26235851AT9XS21479952992,1002,28%
UBS AG/London 5.5% 20/08/26G315CSLQ1XS25899076535,5001,67%
RCI Banque SA 4.625% 02/10/26F77341P94FR001400KXW44,6251,61%
Societe Generale SA 4.25% 28/09/26F8586UWE8FR001400KZP34,2501,60%
Booking Holdings Inc 4% 15/11/2609857LAU2XS25552182914,0001,59%
Volvo Treasury AB 3.875% 29/08/26W9863RZU9XS26716214023,8751,59%
Deutsche Boerse AG 3.875% 28/09/26D1R73TBG7DE000A351ZR83,8751,59%
Arval Service Lease SA/France 4% 22/09/26F47368BG3FR001400CSG44,0001,59%
Volkswagen Bank GmbH 4.25% 07/01/26D9T638KG6XS26174425254,2501,58%
Cie de Saint-Gobain SA 3.75% 29/11/26F2005MHC3XS27235495283,7501,57%

Innehav kan komma att förändras

Fortsätt läsa

21Shares

Prenumerera på nyheter om ETFer

* indicates required

21Shares

Populära