
Nyheter
Will oil rally in 2016?
Will oil rally in 2016? Capital markets started the year against a backdrop of a strong rise in risk aversion. Over the last few weeks, fears concerning the health of the US economy, the future of Chinese growth and the collapse in oil prices have pushed investors to protect portfolios and continuously sell risky assets.
The price per barrel is suffering from weak global trade and Iran’s return to the group of oil-producing countries, but also from the particularly mild climate since the end of last year. Accordingly, financial markets are reducing risk, taking this fall in the oil price as the self-fulfilling prophecy of a sluggish global economy lacking momentum. Strong correlation is thus building between equities (including those in the eurozone) and energy commodity prices.
Chart 1
Correlation between equity and energy commodity

(Click to enlarge)
Clearly there are devastating consequences for oil-producing countries, as they watch revenue collapse and face investors withdrawing capital in anticipation of lower rates, on the grounds that emerging central banks will have to introduce more accommodative policies to support the clear slowdown in local activity. Here, too, the correlation between emerging market currencies and the price of Brent is increasing, with each additional fall in oil prices translating into a stronger US dollar versus emerging currencies.
Chart 2
Brent & dollar vs. emerging currencies

(Click to enlarge)
Chart 3
Currencies: US Dollar vs. Euro & emerging currencies

(Click to enlarge)
On the stock market this continuous fall in emerging currencies is penalizing equities for which performance depends, to a large extent, on the change in parity versus developed market equities. In fact, the deterioration in current account balances in emerging countries is creating economic difficulties for regions watching the price of their dollar imports rising constantly. The dollar is no longer rising versus the euro but continues to rise versus emerging currencies, which shows that the later are indeed weakening.
Chart 4
Brent spot price & US rig count

(Click to enlarge)
Is there any hope of an end to this phenomenon this year? We believe that oil may have bottomed out, or that even if it falls a bit further, there is light at the end of the tunnel. In fact, Saudi Arabia’s strategy to undermine US shale oil is working. Even if this industry will not disappear thanks to its high flexibility (the rig count is declining [see chart] but deep offshore drilling is under greater threat at these price levels), US banks may demand a higher cost of capital (defaults should at least rise towards 6% in the US high yield energy segment this year) and the regulator may require a more conservative valuation of reserves in the business models of alternative producers.
From here on in, voices has already raised to this effect. Concerted action could resume within OPEC in order to get better control of production. Indeed, at these prices, several countries will be tempted to buy social peace by rebalancing their budgets with an income boost.
So we can start to think about implementing investment strategies for this new situation. Directly purchasing commodities is not the only option. For an indirect play, energy sectors in US and European majors could be considered, break-even inflation points are at their lowest in the US today and could benefit from tensions with a barrel price which will initially return to around $40. Similarly, developed currencies linked to oil, such as the Canadian dollar (see chart), may also offer the opportunity to play this theme of the end of a great bear cycle for energy.
Chart 5
Brent price & Canadian dollar (vs. $)

(Click to enlarge)
Franck Nicolas
Head of – Investment and client solutions
www.nam.natixis.com
Natixis Asset Management
Limited liability company – Share capital €50,434,604.76
Regulated by AMF under no. GP 90-009 RCS Paris n°329 450 738
Registered Office: 21 quai d’Austerlitz – 75634 Paris Cedex 13 – Tel. +33 1 78 40 80 00
This document is intended for professional clients only.


Magnificent 7 aktier värderas 30 gånger högre än för 10 år sedan, vilket överträffar vinsterna från andra historiska manier. Är det ett tecken på AI-hypen är en bubbla?
Nasdaq 100 steg 12x på 10 år innan 2000 Dot-Com Bubble dök upp.
Nikkei 225 steg 10 gånger på ett decennium under den japanska bubblan på 1980-talet.
Dessutom har priset på guld sett en 15-faldig ökning av priset på 1970-talet innan dess topp.
Slutligen steg Nifty Fifty aktiekurser 5x på 1960-talet innan tjurmarknaden tog slut 1969.
Kommer AI att leva upp till de historiskt höga förväntningarna?
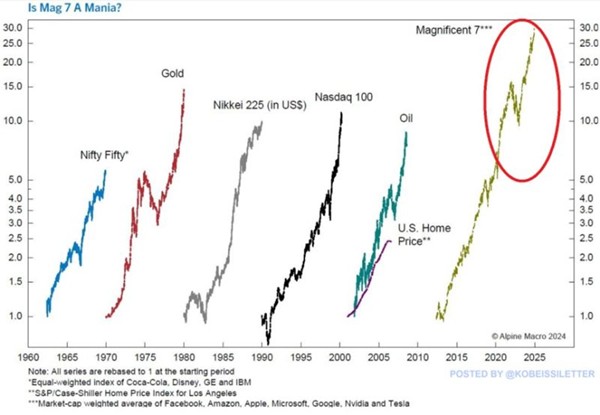
Källa: The Kobeissi Letter


XGSD ETF köper aktierna med högst utdelning i STOXX Global 1800 Index

Är AI-hypen en bubbla eller nästa stora grej?

ETF från AXA IM med tillgång till tillväxtmarknader exklusive Kina

Aktiva ETFer är heta just nu

BS8A ETF köper amerikanska företagsobligationer med förfall 2028

AuAg Funds om gulds motståndskraft mitt i globala tariffer och stark dollar

Tio ETFer för att investera i fastigheter

Hur investera i afrikanska aktier med hjälp av börshandlade fonder?

Hur obligationer kan innebära långsiktig vinst

De mest eftersökta ETFerna i januari 2025
-
 Nyheter2 veckor sedan
AuAg Funds om gulds motståndskraft mitt i globala tariffer och stark dollar
-
 Nyheter2 veckor sedan
Tio ETFer för att investera i fastigheter
-
 Nyheter3 veckor sedan
Hur investera i afrikanska aktier med hjälp av börshandlade fonder?
-
 Nyheter3 veckor sedan
Hur obligationer kan innebära långsiktig vinst
-
 Nyheter1 vecka sedan
De mest eftersökta ETFerna i januari 2025
-

 Nyheter4 veckor sedan
HANetfs Tom Bailey om utsikterna för koppar och uran
-

 Nyheter1 vecka sedan
Fastställd utdelning i XACT Norden Högutdelande 2025
-
 Nyheter2 veckor sedan
Trump 2.0: The Art of the Crypto Deal