
Nyheter
What is behind the rise of global bond yields?

Fixed Income Research – What is behind the rise of global bond yields?
Highlights
- The rise of US yields is driving up yields around the world.
- We expect higher volatility in global rates, amplified by geopolitical risks and commodity price movements.
- Structural headwinds and accommodative foreign monetary policies will likely limit the rise US yields over the medium term.
Since last November, investors’ sentiment has turned into ‘risk-on’ mode, favouring risky assets and equities relative to bonds. The rise in global yields and the steepening of yield curves has fuelled fears about the end of the 35-year bond bull market.
US yields drive up global yields

Since the early 2000s, the rise of global financial integration (i.e. the increase movements of capital between economies) has been reflected in higher co-movement in global yields. The chart below shows that almost 60% of the changes in bond yields of advanced economies (US, UK, Germany, and Japan) may be explained by a common factor.
´
The recent rise of global yields was predominantly driven by the rise of US yields along with cyclical factors (such as inflation, geopolitical risk and market volatility). However, we believe the ongoing accommodative monetary policies in Europe and Japan are likely to keep bond yields low in these regions, limiting the rise of US yields over the medium term.

What is driving US yields higher?
Long-term bonds yields are a function of the expected future short-term interest rates and the bond term premium that investors require to buy long-term bonds rather than roll over a series of shorter maturity bonds (i.e. inflation risk premium). The trend decline in global yields in the past 35 years mostly reflects the trend decline in bond term premium, while expected short-term interest rates fluctuate along with the changes in monetary policies.
Expected short-term rates started to increase in December 2013 when the Fed announced the tapering of its monthly bond purchases. However, US bond term premiums continued to decline and then slipped into negative territory in the first half of 2016 – for the first time in history. Deflation fears fuelled by the 70% drop of energy prices between 2014 and 2015 negatively affected inflation risk premiums, which declined from 0.5% to -0.5%. The sustained rebound in energy prices since February 2016 enabled inflation premiums to bounce back in Q4 2016, leaving both forces – bond term premium and expected short-term rates – trending upward. As a result, US long-term yields started to rise.
We evaluate the current mispricing of the 10yr treasury yield at 10bps tighter than its estimated value, based on the gap between the current 10yr yields and the sum of its two components. Thus, we believe most of the expected three rate hikes from the Fed this year have already been priced into 10yr yields. However, we expect higher rates volatility amplified by elevated volatility in energy prices and geopolitical risks. The MOVE index (an indicator of bond markets volatility) has increased 20% since Q4 2016.
Structural headwinds push yields down
The recent tightening in US financial conditions has been driven by the prospect of a better economic outlook in the US, reflecting current expectations of larger fiscal policy stimulus. In our opinion, the efficiency of the fiscal stimulus and its effects on bond markets will crucially depend on its fiscal neutrality and on its capacity to boost productivity and labour force growth. While the labour force growth has rebounded since 2012 under the accommodative monetary policy of the Fed, US productivity growth remain low from an historical perspective and continue to weigh on the economy.

Historical data reveals a strong positive relationship between investment and labour productivity.

The decline trend of investment in advanced economies can be partly explained by high credit constraints. The Debt Service Ratio (DSR) or the share of income used to service debt has not yet return to the pre-crisis levels, weighing on consumption and investment.
Subdued long-term economic trend limit yields’ rise
The gradual decline in the US GDP growth trend has led to gradual similar decline in the neutral real interest rate (i.e. the federal funds rate that neither stimulates nor restrains economic growth), which, in turn, has caused the decline in long-term interest rates. The US Congressional Budget Office (CBO) forecasts a stable 2% potential real GDP growth – the highest level of real GDP that can be sustained over the long term – for the US economy over the next 10 years. Accordingly, the neutral real interest rate for the US is expected to pick up and move in tandem with the potential real GDP. Although, both remain lower from a historical perspective.

This analysis is consistent with the gradual downward revision of long-run projections from the FOMC. From 2012 to today, the FOMC gradually revised downward its estimates for the long-run potential GDP growth rate and the terminal fed funds rate (or neutral interest rate) from 2.4% to 1.8% and from 4.25% to 3.00% respectively. Fed Chair Yellen reiterated in January1 that the Fed expects to increase Federal Funds rate target a few times a year until, by end of 2019, it is close to its longer-run neutral rate of 3%. Accordingly, we expect the Fed to hike rates three times this year.
We expect the trend rise of the US yields to be gradual over the medium term toward 2019 amid higher volatility. The upside risks to this view would come from a significant and quicker-than-expected rebound in productivity growth and inflation.
For more information contact:
ETF Securities Research team
ETF Securities (UK) Limited
T +44 (0) 207 448 4336
E info@etfsecurities.com
Important Information
The analyses in the above tables are purely for information purposes. They do not reflect the performance of any ETF Securities’ products . The futures and roll returns are not necessarily investable.
General
This communication has been provided by ETF Securities (UK) Limited (“ETFS UK”) which is authorised and regulated by the United Kingdom Financial Conduct Authority (the “FCA”).
This communication is only targeted at qualified or professional investors


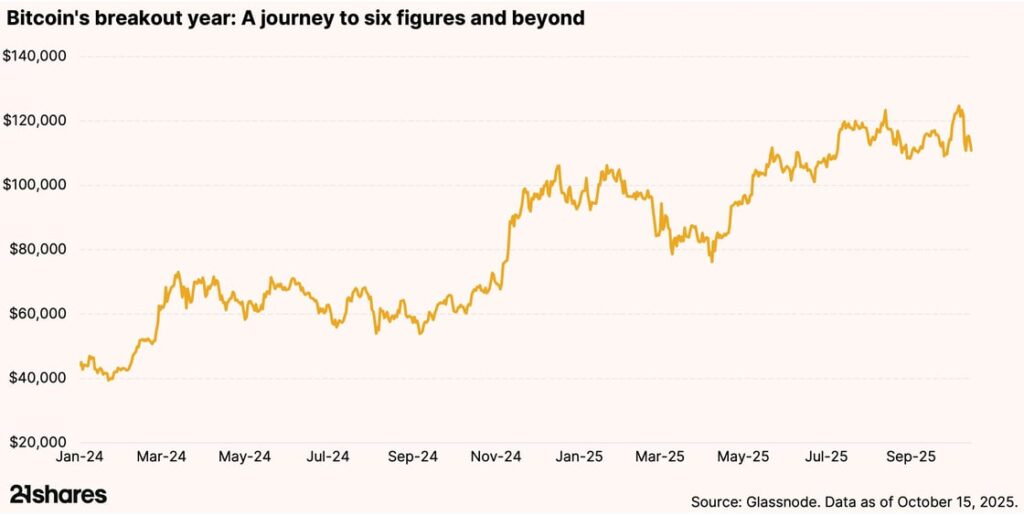
Bitcoin’s record-breaking rally and resilient investor base reveal a maturing market. Despite brief drawdowns, over 90% of holders remain in profit, and institutional inflows continue to absorb volatility. With downside risk compressing, even a modest Bitcoin allocation will meaningfully boost portfolio efficiency across cycles.

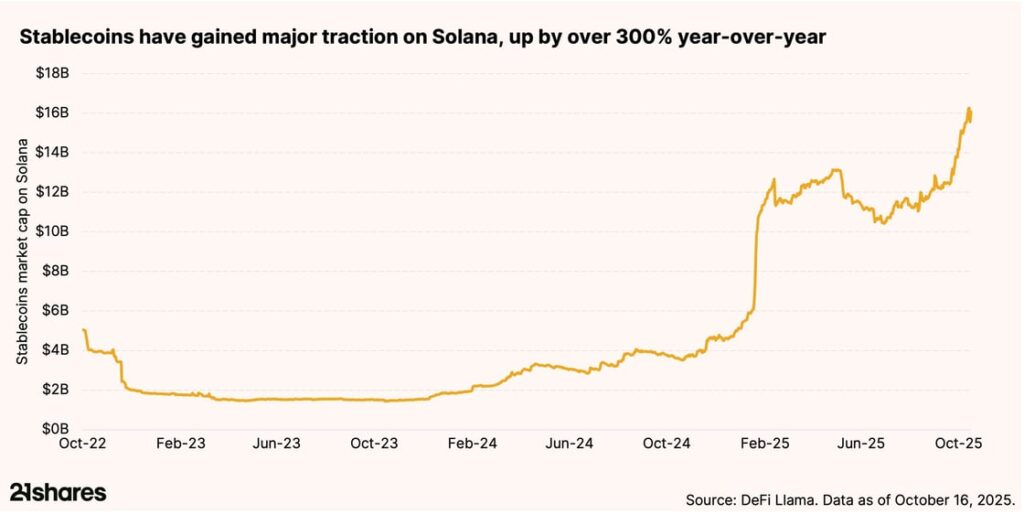
Why is retail finance booming on Solana?
Solana’s low fees and lightning-fast transactions are powering real-world payments. With $16 billion worth of stablecoins traded on the network, Solana is bridging crypto and commerce, driving retail adoption at an unprecedented scale. This is exactly why legacy companies like Shopify and PayPal have chosen to integrate the blockchain into their businesses.


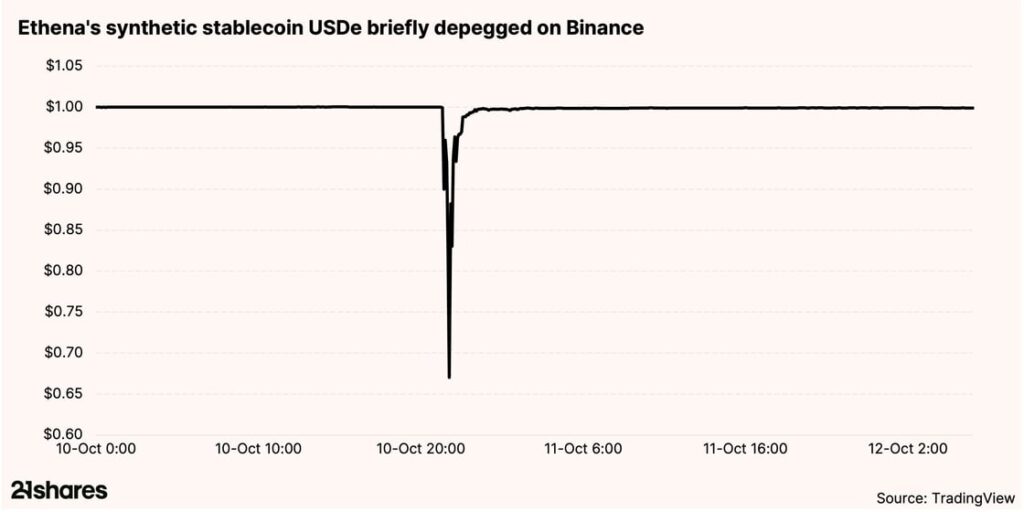
Why did Ethena’s stablecoin remain stable onchain but depegged on Binance?
On October 10, Ethena’s USDe saw a sharp depeg on Binance’s centralized exchange, plunging to $0.65, while staying stable across all decentralized finance platforms. The cause wasn’t a protocol flaw but thin centralized liquidity. The incident highlights how decentralized systems can better withstand volatility, offering transparency and resilience during market stress.

Research Newsletter
Each week the 21Shares Research team will publish our data-driven insights into the crypto asset world through this newsletter. Please direct any comments, questions, and words of feedback to research@21shares.com
Disclaimer
The information provided does not constitute a prospectus or other offering material and does not contain or constitute an offer to sell or a solicitation of any offer to buy securities in any jurisdiction. Some of the information published herein may contain forward-looking statements. Readers are cautioned that any such forward-looking statements are not guarantees of future performance and involve risks and uncertainties and that actual results may differ materially from those in the forward-looking statements as a result of various factors. The information contained herein may not be considered as economic, legal, tax or other advice and users are cautioned to base investment decisions or other decisions solely on the content hereof.


33GI ETF köper bara eurodenominerade företagsobligationer som förfaller 2033

Tre nya börshandlade fonder från Xtrackers

Bitcoin within 15% of its all-time high: Should you still allocate?

HANetfs Hector McNeil förklarar hur ETFer genererar hög avkastning med covered calls

JPEY ETF högavkastande företagsobligationer vautasäkrade till Euro

De bästa lågvolatilitets ETFer på marknaden

Fokus mot en helt ny börshandlad produkt i september 2025

M5TYs senaste utdelningstakt (55 %) belyser covered call-strategins inkomstpotential
Could Bitcoin be the key to your dream house?

Börshandlade fonder för europeiska small caps
-
 Nyheter4 veckor sedan
De bästa lågvolatilitets ETFer på marknaden
-
 Nyheter3 veckor sedan
Fokus mot en helt ny börshandlad produkt i september 2025
-
 Nyheter4 veckor sedan
M5TYs senaste utdelningstakt (55 %) belyser covered call-strategins inkomstpotential
-

 Nyheter4 veckor sedan
Could Bitcoin be the key to your dream house?
-
 Nyheter3 veckor sedan
Börshandlade fonder för europeiska small caps
-

 Nyheter2 veckor sedan
Levler noterar ytterligare fyra börshandlade fonder i Sverige
-
 Nyheter4 veckor sedan
The Investment Case for TLT (Long-Dated Treasury Bonds)
-

 Nyheter3 veckor sedan
Miners Find Their Mojo as Gold Consolidates