
Nyheter
Value Renaissance

ETF Securities Equity Research – Value Renaissance
Highlights
- The rebound of value stocks suggests the style shift is pricing a moderate recovery in earnings.
- Sector selection and sentiment has driven the shift in style bias in favour of growth stocks over the past decade.
- Widest historical Price to Book (P/B) spread confirms Value is trading at a steep discount to Growth.
- Global macro factors support the case for a return to value investing but there are risks on the horizon.
Value investors are anticipating a change in the cycle
The key to long term investment gains is ingrained in retaining a disciplined strategy. The main but contrasting investment approaches are value and growth investing. Value investing involves buying stocks at a discount to market price and such discounts can be identified by using multiples (of earnings, cash flow and book value). Growth investing involves buying companies undergoing above average growth in earnings and are identified by high profitability margins and return on equity. Owing to its inherently higher operating leverage, historically Value outperforms Growth ahead of a turn in the profit cycle (with a lead of about 2 years). As the global macro environment improves, we are seeing emerging signs of value stocks being bid up by investors as they try to capitalise on the recovery in global economic activity. ´

(Click to enlarge)
There has been a bias towards growth investing over the past decade, leading some to question if value investing is dead.
Sector selection held value back
Value oriented indices currently have a higher weighting to finance and energy sectors than growth oriented indices. Technology and consumer discretionary stocks account for the highest weights in growth oriented indices.

(Click to enlarge)
Falling oil prices, and difficulties in the banking sector since the global financial crisis, led to a period of earnings deceleration among the value oriented finance and energy sectors. On the other hand, technology and consumer discretionary stocks posted stronger earnings tilting investor preferences towards growth stocks since 2008. Consequently, sector selection was largely responsible for the recent style bias in favour of growth stocks. We don’t think that there has been a breakdown in the fundamentals of value investing but the style has been unpopular due to sector-specific reasons. During the dot com mania of the late 90’s, value investors suffered greatly as they missed out on the rally of technology stocks whose weighting was nearly 50% of the MSCI World growth index. However, as the bubble deflated, the weight of the technology sector reduced to around 20% and Value came back in favour.
Sentiment has had a part to play in the style shift since 2008, as investors have been exposed to the dominance of central bank policy, negative interest rates, lower commodity prices and weaker expectations of economic growth. In this scenario investors have resorted to investing in growth stocks and capturing yield via bond proxies within a mix of both value (utilities, telecom, real estate) and growth (consumer staples, and healthcare) equity sectors.
Value at a bargain but not for long
Value stocks are trading at their steepest discount in history to Growth. On analysing the P/B ratios of stocks across US, Europe and Japan, we found that the gap between the cheapest part of the global equity market and the most expensive is currently at its widest level since 1986. This suggests value stocks are trading at an unprecedented discount relative to its expensive peers. The last occasions we witnessed spreads come anywhere close were during the technology bubble of the late 90’s and prior to the global financial crisis in 2008.

(Click to enlarge)
Value will benefit from higher rates
Strong US economic data, coupled with Trump’s pro-growth mandate have raised expectations for higher global growth rates accompanied by increasing inflation. The imminent US rate hike in December has become a near certainty and a higher inflation outlook has fuelled the prospects of additional rate hikes by the Fed next year. We expect value to benefit as the rate tightening cycle continues in the US. History shows that, in the 6 to 12-month period following the start of the US rate tightening cycle, Value has outperformed Growth.

(Click to enlarge)
We are currently seeing early signs of Value outpacing Growth as the rhetoric for additional rate hikes in 2017 sets in, similar to 1986, 1999 and 2004.
Macro factors support Value’s reversion to the mean
The trajectory of bonds yields in the US and Europe have a strong relationship with the relative valuation spread of Value versus Growth, based on Price to Earnings (P/E). The recent rise in bond yields sparked by the risk-on environment, subsequent to Trump’s presidential victory, has been closely tracked by the rising performance of value versus growth stocks. We expect this trend to continue to benefit value stocks as they displace the defensive bond-proxy trades towards more cyclically oriented value stocks. In addition, we expect the steepening of the yield curve to benefit financial stocks that are known to represent a large part of the value style.

(Click to enlarge)
Fundamentals intact but risks linger
Despite the prolonged underperformance of value investing since the global financial crisis, we believe the fundamentals remain intact. The historical rotation of investing style bias is reflective of the performance of the main underlying sectors within each style. While Growth and Value are not trading at a significant discount to each other, Value is clearly trading at an unprecedented discount to its historical spread. Investors are picking up on the trend, evident from the sharp reversal in the performance of Value in 2016. Over time we have observed a shift towards value investing to serve as a timely indicator of an initial acceleration in global earnings. We feel the current shift in style is a precursor of a continued recovery.
While improving global macro data is a catalyst for Value, we acknowledge the risk to the scenario remains that the market could be overpricing the rate rising cycle and the recovery in earnings momentum. We also remain extremely cautious of the euphoria surrounding Trump’s victory and remain uncertain of his ability to implement all his pro-growth policies that are subject to raising the US debt ceiling. Also, the reversal of the bond proxy trades skewed towards value sectors such as utilities, telecom and real estate could negatively impact Value’s upside performance. Despite the looming risks, we maintain our stance that growth stocks have run ahead of its course and Value offers an attractive entry point with the potential for a meaningful recovery to the upside.
Important Information
General
This communication has been issued and approved for the purpose of section 21 of the Financial Services and Markets Act 2000 by ETF Securities (UK) Limited (“ETFS UK”) which is authorised and regulated by the United Kingdom Financial Conduct Authority (the “FCA”).


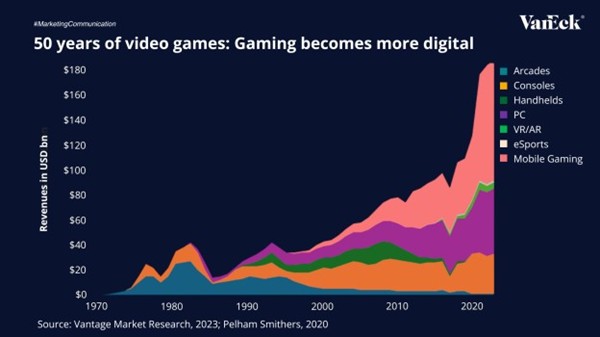
The global gaming industry has evolved into one of the world’s most dynamic entertainment sectors, expected to generate $188.9 billion in 2024 and surpass $200 billion by 2027, outpacing film and music combined.
From arcades to smartphones, the gaming industry has continuously evolved with each technological shift. Today, mobile gaming is a major player the market, currently accounting for the largest share of global revenues. As digital platforms, cloud gaming, and eSports continue to grow, gaming is establishing itself as a core part of the global entertainment economy.
Mobile gaming is leading this transformation, currently accounting for the majority of industry revenues and 40% of all global app downloads. With 5G adoption and 90% smartphone penetration expected by 2030, billions of new players will join the market, making gaming more accessible than ever.
However, the rollout of 5G also carries risks, uneven global infrastructure buildout, high capital costs for carriers, and potential fragmentation across networks could delay or limit the full realization of these benefits.
Source: Vantage Market Research, 2023; Pelham Smithers, 2020
To receive more Gold Investing insights, sign up to our newsletter.
IMPORTANT INFORMATION
This is marketing communication. Please refer to the prospectus of the UCITS and to the KID/KIID before making any final investment decisions. These documents are available in English and the KIDs/KIIDs in local languages and can be obtained free of charge at www.vaneck.com, from VanEck Asset Management B.V. (the “Management Company”) or, where applicable, from the relevant appointed facility agent for your country.


Is Mobile Powering the Future of Gaming?

Fyra nya börshandlade fonder från JP Morgan

AIFS ETF en satsning på infrastruktur för artificiell intelligens

J.P. Morgan Asset Management utökar sitt erbjudande med två nya aktiva ETFer

ISRU ETF köper aktier i stora amerikanska företag

HANetf och Infrastructure Capital Advisors samarbetar för att lansera aktivt förvaltad preferensavkastnings-ETF i Europa

De bästa lågvolatilitets ETFer på marknaden
Time in Bitcoin beats timing Bitcoin

HANetf kommenterar kopparuppgången

Fokus mot en helt ny börshandlad produkt i september 2025
-
 Nyheter4 veckor sedan
HANetf och Infrastructure Capital Advisors samarbetar för att lansera aktivt förvaltad preferensavkastnings-ETF i Europa
-
 Nyheter4 veckor sedan
De bästa lågvolatilitets ETFer på marknaden
-

 Nyheter4 veckor sedan
Time in Bitcoin beats timing Bitcoin
-
 Nyheter4 veckor sedan
HANetf kommenterar kopparuppgången
-
 Nyheter2 veckor sedan
Fokus mot en helt ny börshandlad produkt i september 2025
-

 Nyheter3 veckor sedan
Börshandlade fonder för europeiska small caps
-

 Nyheter3 veckor sedan
M5TYs senaste utdelningstakt (55 %) belyser covered call-strategins inkomstpotential
-

 Nyheter3 veckor sedan
Could Bitcoin be the key to your dream house?