
Nyheter
UB EM Infra och UB Global Infra update – November 2015

UB EM Infra och UB Global Infra update – November 2015. Hittills i november är de bägge fonderna UB EM Infra och UB Global Infra i stort sett oförändrade. Ser man till hela året, har fonderna en positiv avkastning och en risknivå som ökat något under året [jämfört med längre tidsperioder]. Att risken i fonderna har ökat beror på en högre aktiemarknadsrisk som vi har kunnat observera sedan tidig sommar, med Grexit och oroligheter på tillväxtmarknaderna.

Tabell 1. En jämförelse mellan UB Infra och UB EM Infra med respektive jämförelseindex ur ett avkastnings- och riskperspektiv
Källa; Bloomberg och UB Real Assets. Period 2010-11-13—2015-11-13. Risk= volatilitet i % /år
Bägge fonderna har en avsevärt lägre risknivå [se Tabell 1] än motsvarande jämförelse index [högre Sharpe-kvot], vilket vi menar bevisar att ett monopolistiskt angreppsätt att investera i infrastruktur är hållbart både på kort och lång sikt. Speciellt fungerar denna ansats väl på tillväxtmarknader [=UB EM Infra]
UB EM Infra
UB EM Infra [och tillväxtmarknader generellt] hade en stark månad i oktober till följd av bland annat ökad kinesisk stimulans och en uppskjuten amerikansk räntehöjning. Vi har gradvis ökat exponeringen mot Brasilien [ca 6,6% av fonden] men bolag i Kina/Hongkong utgör portföljens största innehav [15.1% resp 37.8%]. Vi ser en stabilisering av aktier på tillväxtmarknader men ser fortfarande frågetecken kring fastlands-Kina. Valutor har en central roll för avkastningen och kommer att ha det den närmaste tiden. Vi ser att fallet i aktier planar ut men det finns fortfarande risk för ytterligare nedgångar. Värderingarna har förstås kommit ned och vi ser en ökad direktavkastning i fonden [3,3% per 30.10.2015].

UB Infra
UB Infra har köpt aktier i främst USA och Europa. USA utgör en central del av våra innehav i fonden [37,9%]. Amerikanska ”utilities” har återhämtat sig från de utförsäljningar som gjordes i våras och det är fortfarande en hög M & A aktivitet i USA. I Europa är jakten på yield fortfarande i fokus där ECB alltjämnt fortsätter sin stimulans. Värderingarna på globala infrastrukturbolag har kommit ned under året och är på mer attraktiva nivåer. Valutor kommer att vara en central del av avkastningen inom sektorn, där vi förväntar oss en måttlig positiv avkastning. Infrastruktur utgör en defensiv komponent i portföljen i en allt mer stökig marknad.

Disclaimer
UB Asset Management Ltd, the UB group or UB Real Asset Management Ltd (hereinafter referred to as UB) has made every effort to carefully research all information in this presentation. The information, on which the conclusions and other information such as e.g. market data, are based on has been obtained from sources which UB believes to be reliable such as, for example, Thomson Reuters, Bloomberg and the relevant specialized press as well as the relevant companies which are potential investments for UB’s investment portfolios. Opinions expressed in this financial analysis are UB’s current opinions as of the issuing date indicated on this presentation. This material does not claim completeness regarding all the information on the financial instruments or markets or developments referred to in it. This material is intended as general information to the recipient and nothing contained in this presentation constitutes investment advice, nor is it to be relied on in an investment decision. On no account should the document be regarded as a substitute for the recipient procuring information for himself/herself or exercising his/her own judgments. It is recommended to discuss possible investment decisions with your customer service officer as differing views and opinions may exist with regard to the mutual funds, stocks or other financial instruments referred to in this document. This document is not a solicitation or an offer to buy or sell the mentioned instruments or investment alternatives. The document may include certain descriptions, statements, estimates, and conclusions underlining potential market and company development. These reflect assumptions, which may turn out to be incorrect. UB and/or its employees accept no liability whatsoever for any direct or consequential loss or damages of any kind arising out of the use of this document or any part of its content. UB and/or its employees may hold, buy or sell positions in any securities mentioned in this document, derivatives thereon or related financial products. UB and/or its employees may underwrite issues for any securities mentioned in this document, derivatives thereon or related financial products or seek to perform capital market or underwriting services.
This material is intended only for the recipients and is not allowed to be redistributed without written permission from UB. The UB funds mentioned in this presentation are managed by UB Fund Management Company Ltd. Key investor information documents (KIIDs) and fund prospectuses and relevant material can be obtained from UB Fund Management Company Ltd in Finnish and in Swedish. Historical performance is not a guarantee of future returns and cannot be used to predict future risk or return characteristics of any fund or portfolio mentioned in this presentation.


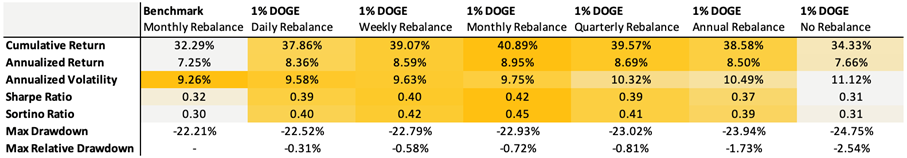
Dogecoin has outperformed other major cryptoassets over the past decade, while also exhibiting a low correlation to crypto and traditional assets. This creates a compelling argument for a portfolio allocation. We tested a Bitcoin-enhanced growth portfolio, which is a traditional 60/40 infused with 3% Bitcoin, and we introduced a modest 1% DOGE allocation. Since most prospective investors likely already hold Bitcoin, this offers a lens into how the two assets can complement each other.
Despite the small portfolio allocation, every approach delivered stronger returns. The benchmark returned 7.25% annually, while DOGE-enhanced portfolios reached as high as 8.95%. Sharpe ratios improved in almost all tests, indicating better risk-adjusted returns. Volatility did slightly tick up, but drawdowns remained largely contained. Even with no rebalancing, the max drawdown only deepened by a few percentage points, underscoring that even a 1% DOGE allocation adds meaningful punch without destabilizing the broader portfolio.
Rebalancing remains essential to capturing upside effectively. Without it, returns can plateau while risk quietly compounds. Monthly or weekly rebalancing offered the best balance, maximizing returns while keeping volatility and drawdowns in check, especially during periods of broader market stress, as we’ve recently seen. Given Dogecoin’s momentum-driven nature, a more strategic approach linked to broader crypto market cycles may offer even greater optimization beyond routine rebalancing.
With the right structure, a 1% allocation to Dogecoin isn’t reckless—it’s rewarding.
Bear Case
Despite strong fundamentals and a rich cultural legacy, Dogecoin’s recent rally, fueled by post-election memecoin mania, may have front-run its true cycle potential. As attention shifts to newer narratives, DOGE risks being seen as ’yesterday’s play,’ potentially underperforming even in a rising market. Still, that wouldn’t signal a flaw in its model, just a pause in a fast-rotating cycle.
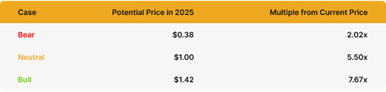
Assuming a continued 10% compounded annual growth rate (CAGR) from its 2021 peak of $0.73, DOGE would be projected to land around $0.38 by 2025—still more than 2x from today’s levels but modest relative to past cycles. More notably, this would mark the first time Dogecoin fails to reach a new all-time high in a full market cycle.
Neutral Case
Dogecoin may not dominate headlines like it did at its peak, but it still holds cultural relevance and widespread recognition. In a scenario where the total crypto market cap peaks at $5 trillion this cycle and DOGE maintains a solid, albeit slightly reduced, market share of 3% instead of its previous 4%, this would result in a market capitalization of approximately $150 billion for DOGE.
At that valuation, DOGE would trade near $1 per coin, a ~5.5x gain from current levels around $0.185. This neutral case assumes Dogecoin retains its stature as the leading memecoin, despite increased competition, with stable adoption and renewed retail interest, but without the same euphoria of the last cycle.
Bull Case
If we take DOGE’s bottom price of $0.007 just before the last bull run began and fast-forward two years to the bottom of the current cycle at $0.0585, that move reflects a CAGR of 189%. If DOGE were to mirror this explosive growth, DOGE would reach approximately $1.42.
In this scenario, Dogecoin benefits from renewed memecoin mania, increasing real-world adoption, and stronger interest fueled by regulatory clarity and potential integration with major platforms like Elon Musk’s X. A full return of retail enthusiasm and broad cultural momentum could reestablish DOGE as the breakout asset of the cycle, potentially even doubling its all-time high.
Research Newsletter
Each week the 21Shares Research team will publish our data-driven insights into the crypto asset world through this newsletter. Please direct any comments, questions, and words of feedback to research@21shares.com
Disclaimer
The information provided does not constitute a prospectus or other offering material and does not contain or constitute an offer to sell or a solicitation of any offer to buy securities in any jurisdiction. Some of the information published herein may contain forward-looking statements. Readers are cautioned that any such forward-looking statements are not guarantees of future performance and involve risks and uncertainties and that actual results may differ materially from those in the forward-looking statements as a result of various factors. The information contained herein may not be considered as economic, legal, tax or other advice and users are cautioned to base investment decisions or other decisions solely on the content hereof.


SPFT ETF är en global satsning på teknikföretag

Dogecoin in a portfolio: A small 1% allocation has a loud bark!

VBTC ETN spårar priset på kryptovalutan Bitcoin

iShares och Franklin Templeton listar nya ETFer på Xetra

BE28 ETF företagsobligationer med förfall 2028 och inget annat

Fonder som ger exponering mot försvarsindustrin
Crypto Market Risks & Opportunities: Insights on Bybit Hack, Bitcoin, and Institutional Adoption

Montrose storsatsning på ETFer fortsätter – lanserar Sveriges första globala ETF med hävstång

Warren Buffetts råd om vad man ska göra när börsen kraschar

Svenskarna har en ny favorit-ETF
-
 Nyheter4 veckor sedan
Fonder som ger exponering mot försvarsindustrin
-

 Nyheter3 veckor sedan
Crypto Market Risks & Opportunities: Insights on Bybit Hack, Bitcoin, and Institutional Adoption
-
 Nyheter2 veckor sedan
Montrose storsatsning på ETFer fortsätter – lanserar Sveriges första globala ETF med hävstång
-
 Nyheter4 veckor sedan
Warren Buffetts råd om vad man ska göra när börsen kraschar
-
 Nyheter3 veckor sedan
Svenskarna har en ny favorit-ETF
-

 Nyheter2 veckor sedan
MONTLEV, Sveriges första globala ETF med hävstång
-

 Nyheter4 veckor sedan
Fastställd utdelning i MONTDIV mars 2025
-

 Nyheter2 veckor sedan
Sju börshandlade fonder som investerar i försvarssektorn