
Nyheter
Time to revisit the commodity market
Recent price corrections bring opportunities Time to revisit the commodity market. Most commodities are trading close or below their marginal cost of production, with platinum, nickel, oil and grains the most striking examples. While in the short-term companies and mines can continue to produce even if prices are trading below marginal costs, it is not sustainable in the long term.
Unprofitable operations will have to be shut down or downsized, reducing production to contain costs. We expect the recent correction in commodity prices to be short-lived and believe commodities are attractively valued at current levels. Most of the factors that have hit commodity prices over the past month are temporary, and we believe the price correction creates tremendous opportunities for medium to longterm investors.
The state of play

Concerns about European and Chinese growth, markets digesting higher US rate expectations and US dollar strength, bumper grain crops, and adjustments to oil supply and demand expectations have been the main drivers of the poor commodity performance in 2014 (Figure 1). We believe a number of the increased supply price drivers will be transitory and that the recent period of softer global growth will prove short-lived.
US dollar strength should not hinder a price rebound as dollar strength is being driven by expectations of improving US demand. As China eases policy to boost growth, the US economy recovers and years of gradually tightening capacity start pushing up inflation, commodities should recover from current beaten down levels.
Metals
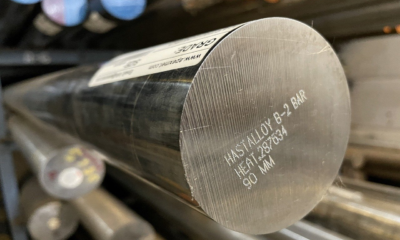
Investors focussing on global risks prompted a volatility surge across asset classes, which resulted in a sell-off across cyclical assets. Global equity benchmarks led the correction, prompting prices of several metals to fall below their marginal cost of production. Prior to the price weakness in September, industrial metals had staged a striking recovery in 2014, with a 6.4% rise in the first eight months of the year. While we believe most metals are attractively priced at current levels, we think platinum, palladium and nickel offer interesting opportunities at the moment.

Platinum and palladium markets were plagued by a 5-month long strike in South Africa at the beginning of the year that took over 1moz of platinum and 700koz of palladium off the market (equivalent to 14% of 2013 total production of platinum and 8% of 2013 total global production of palladium). As palladium is extracted as a by-product of platinum in South Africa and of nickel in Russia, it will only be produced as long as it is convenient to extract platinum and nickel, respectively. At the moment, platinum is trading 9.3% below its marginal cost of production (Figure 2) while nickel is around 18% below its marginal cost of production (Figure 3). Indonesia is the biggest nickel producer with 21% of global supply.
’

The metal ore export ban that began in 2014 remains in place and Chinese producers of nickel pig iron, a lower-quality substitute for refined nickel, have since turned to the Philippines, the 2nd largest global producer with 14% of supply, to keep their industry well supplied.
However, seasonal rains are set to disrupt nickel mining and seaborne transportation of the metal in the Philippines. Disrupted production should start to reduce elevated stockpiles, in turn buoying prices.
While the aluminium price has also fallen below its marginal cost of production and the industry has undertaken considerable steps towards a more balanced market, we believe its price is not yet ripe for a recovery. Despite recent efforts to discipline aluminium supply and the market ex-China being in a deficit, we believe further cuts will be needed to compensate for the build-up in capacity coming from China and for prices to be pushed substantially higher.
Agriculture
While wheat, soybeans and corn are all trading at multi-year lows on the back of expectations for record crops this season, Arabica coffee has rallied over 70% since the beginning of the year on supply concerns.

With grains priced for perfect growing conditions, any small setback in weather in major producing countries or an escalation in trade restrictions in Russia or Ukraine could drive a price rally. The whole grains sector is trading below total cost of production (Figure 4), and because of the seasonality of production, there is likely to be changes in what and how much is grown in coming seasons because sustained weak prices could prompt producers to switch to more profitable crops or use of their land. A decrease in next year’s expected crop should lead to a drawdown of stockpiles and help support prices, which have just begun to stage a rebound.
While the International Coffee Organisation envisages only a slight recovery for coffee in the 2014/2015 season, as a devastating leaf rust disease is likely to prompt switching to other crops, we believe the recent rally was excessive as there is no immediate shortage of coffee and prices remain well above marginal costs of production (Figure 4).
Energy


Weak global demand for oil and distillates combined with ample global supply of crude sent both Brent and WTI prices to the lowest since November 2010 for Brent and June 2012 for WTI. The geopolitical risks in some OPEC countries and the sanctions on Russia have so far very limited impact on global oil supply and failed to provide support to oil prices against market expectations. In the meantime, the OPEC members entered a price war in October, selling their oil at a discount in order to increase market share in Asia, putting further downward pressure on both oil benchmarks. The key to greater support in oil prices lies with OPEC. With oil prices hovering below most major oil producers’ budget break-even levels (Figure 5), we believe it is a matter of time before OPEC start to reduce supply. While the IEA has indicated that most oil produced is still economic at US$80/barrel, the majority of OPEC countries are estimated to require oil prices of at least US$90-US$100/barrel to balance their government budgets. While different oil fields have different breakeven costs, it is generally alleged that US shale oil, which accounts for most of oil production growth over the past few years, has a breakeven price ofUS$60-US$80 (Figure 6).
IMPORTANT INFORMATION
This communication has been issued and approved for the purpose of section 21 of the Financial Services and Markets Act 2000 by ETF Securities (UK) Limited (“ETFS UK”) which is authorised and regulated by the United Kingdom Financial Conduct Authority (“FCA”).


Fem spanska fonder som har ökat med +12% under 2025

ASRP ETF ett spel på medtech företag världen över

Europafokuserade ETPer ser större andel av flödena under första kvartalet

JAAA ETF an aktiv satsning på säkerställda obligationer

Can crypto outperform amidst the current market turmoil?
Crypto Market Risks & Opportunities: Insights on Bybit Hack, Bitcoin, and Institutional Adoption

Montrose storsatsning på ETFer fortsätter – lanserar Sveriges första globala ETF med hävstång

Svenskarna har en ny favorit-ETF

MONTLEV, Sveriges första globala ETF med hävstång

Sju börshandlade fonder som investerar i försvarssektorn
-

 Nyheter4 veckor sedan
Crypto Market Risks & Opportunities: Insights on Bybit Hack, Bitcoin, and Institutional Adoption
-
 Nyheter3 veckor sedan
Montrose storsatsning på ETFer fortsätter – lanserar Sveriges första globala ETF med hävstång
-
 Nyheter4 veckor sedan
Svenskarna har en ny favorit-ETF
-
 Nyheter3 veckor sedan
MONTLEV, Sveriges första globala ETF med hävstång
-
 Nyheter3 veckor sedan
Sju börshandlade fonder som investerar i försvarssektorn
-

 Nyheter3 veckor sedan
Världens första europeiska försvars-ETF från ett europeiskt ETF-företag lanseras på Xetra och Euronext Paris
-

 Nyheter3 veckor sedan
Europeisk försvarsutgiftsboom: Viktiga investeringsmöjligheter mitt i globala förändringar
-

 Nyheter2 veckor sedan
21Shares bildar exklusivt partnerskap med House of Doge för att lansera Dogecoin ETP i Europa