
Nyheter
The Rise and Fall of Ethereum and Bitcoin, Respectively
The biggest winners of last week were Ethereum (+7.88%), Arbitrum (+15.93%), and Uniswap (+7.38%). What happened in crypto this week? Sticky inflation is back in the U.S. and the Eurozone; annual inflation in both economies increased by 3.4% in December. However, the factors differ. Eleven spot Bitcoin exchange-traded funds (ETFs) have been approved in the U.S. However, the asset in question fell by 9.27% over the past week, while its rival, Ethereum, has enjoyed some spotlight with a weekly increase of 7.88%. How did that happen? Let’s make it make sense.
Inflation is Back
On January 10, the vice president of the European Central Bank (ECB), Luis de Guindos, gave a speech about the economic outlook and monetary policy in the euro area, whose annual inflation increased by 3.4% in December, and how the economy’s downturn is expected to continue in 2024. The ECB decided to keep the three key interest rates unchanged. Although it has declined significantly from its peak in March, food inflation remained high at just above 6% in December. As shown in Figure 1, energy inflation remained negative in December, recording the eighth consecutive decline since May 2023.
Figure 1: Euro-Area Inflation by Category

Source: Eurostat, Bloomberg
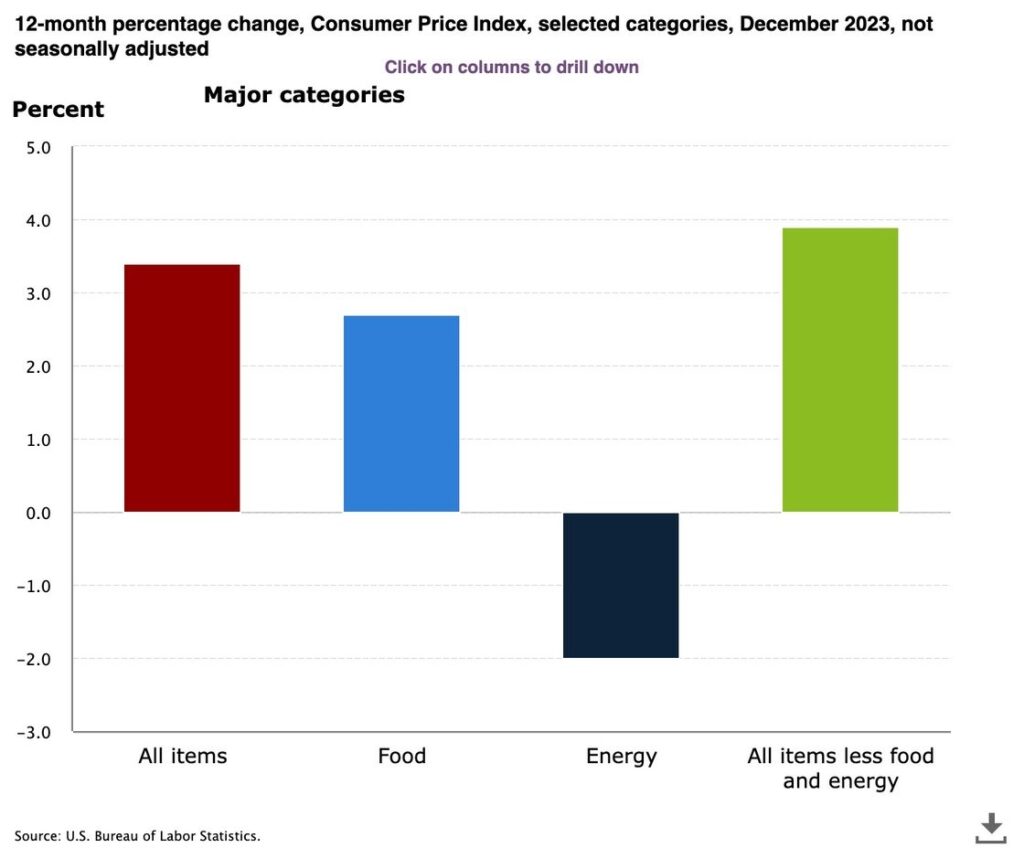
In the U.S., the annual inflation rate also increased by 3.4% in December, the most in three months. The cost of housing, clothes, and cars are some of the primary contributors to the sticky inflation that has dimmed rate-cut expectations. With three rate cuts anticipated for 2024, investors expected the first rate cut to be as early as March. Despite the consumer price index print, some are even expecting a rate cut for each of the seven Fed meetings. Speculation aside, the Fed’s Fund Rates Statement is scheduled for the end of this month.
Finally, a sticky inflation is inherently good news for crypto, namely Bitcoin, as its emerging narrative has been shining brighter as a hedge against currency debasement.
Figure 2: U.S. Inflation by Major Categories

Source: U.S. Bureau of Labor Statistics
A Landmark Moment for Bitcoin
After months of delays, the applications for spot Bitcoin ETF were finally approved, with 11 asset managers getting the regulatory green light to launch their fund products. While spot ETF products have been present in Europe for the past five years, their introduction in the US marks a significant milestone. American markets, valued at $45 trillion in market capitalization, are nearly three times larger than their European counterparts at $13 trillion. This opens the door for much broader participation, solidifying crypto as a credible asset class and propelling it further into the mainstream, where it can seamlessly integrate into the traditional portfolios of the largest asset managers in the world.
Approximately $17.5B has been traded on the products since launch, with total inflows reaching close to $1.2B. That said, Bitcoin moderately declined by ~9% since the ETF launch, which was first triggered by December’s CPI data, showing that inflation was on the rise again and prompting a temporary risk-off response. In addition, as shown in Figure 3, short-term investors seized on the opportunity presented by the hallmark event as they transferred a record amount of BTC (48K) to exchanges – levels last seen almost three years ago. Given that Bitcoin grew by nearly 90% since the initiation of the ETF speculation rally in June 2023, marked by BlackRock’s initial application filing, it is logical to see this level of profit-taking.
Figure 3: Bitcoin Short-Term Holders Transfer to Exchanges Activity
Source: Glassnode
Ethereum Regaining Spotlight
As markets are forward-looking, Ethereum surged by close to 8% week-over-week following the approval of the spot Bitcoin ETFs. Although it’s still quite unclear if Ethereum would receive the same regulatory treatment as Bitcoin, investors may have speculated that Ethereum could be in a favorable position due to the existence of an ETH futures ETF in the U.S. – a reminiscent feature of Bitcoin’s position ahead of the approvals. Beyond the speculation, Ethereum is inching closer toward its network upgrade called the DenCun, which is expected in February. The upgrade should reduce the transaction fees for all scaling solutions built on top of the network, like Optimism and Arbitrum, by about 90%.
Further, the co-founder of Ethereum, Vitalik Buterin, proposed to increase the block gas limit by 33%, from 30M to 40M units, which would improve the network’s throughput. Although it is too early to tell if the proposed improvement will see the light, leading on-chain metrics such as Network-to-Value (NVT) can give a better picture of the network’s valuation. In the figure below, we can see that Ethereum’s NVT ratio is in a downtrend, often an indicator of bullish sentiment and improving fundamentals if the price continues to appreciate in tandem. That implies a higher adoption rate for the network, which can be observed in the increasing daily transactions as they grew from 1.25M to 1.96M over the past week, showing Ethereum’s on-chain ecosystem is experiencing an uptick in usage.
Figure 4: Ethereum’s 30-Day Moving Average Network-to-Value Ratio
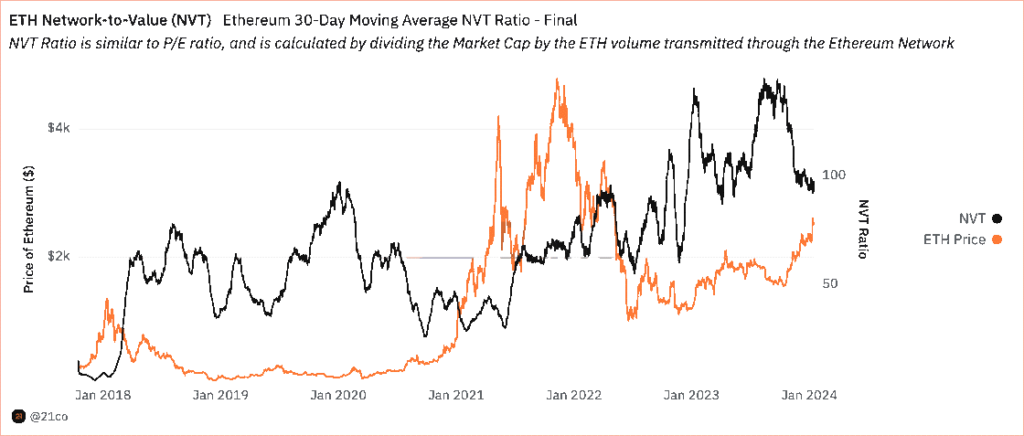
Source: 21co on Dune Analytics
This Week’s Calendar
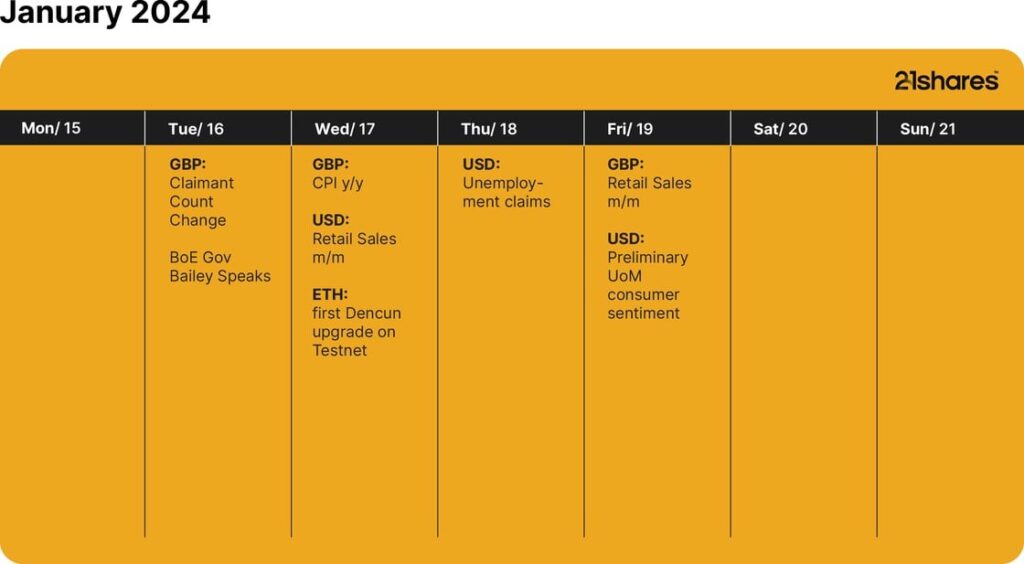
Source: Forex Factory, CoinMarketCal
Research Newsletter
Each week the 21Shares Research team will publish our data-driven insights into the crypto asset world through this newsletter. Please direct any comments, questions, and words of feedback to research@21shares.com
Disclaimer
The information provided does not constitute a prospectus or other offering material and does not contain or constitute an offer to sell or a solicitation of any offer to buy securities in any jurisdiction. Some of the information published herein may contain forward-looking statements. Readers are cautioned that any such forward-looking statements are not guarantees of future performance and involve risks and uncertainties and that actual results may differ materially from those in the forward-looking statements as a result of various factors. The information contained herein may not be considered as economic, legal, tax or other advice and users are cautioned to base investment decisions or other decisions solely on the content hereof.


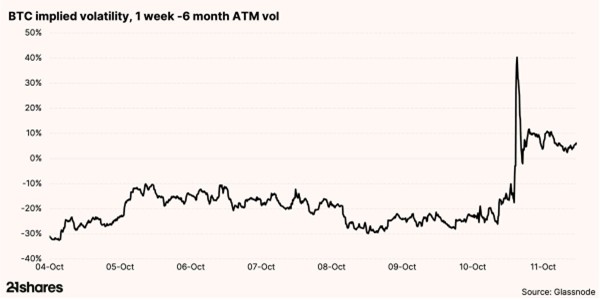
During and after the US market close on Friday, cryptocurrency markets experienced their largest liquidation event on record, with an estimated $19 billion in leveraged positions unwound across futures and perpetual swap markets.

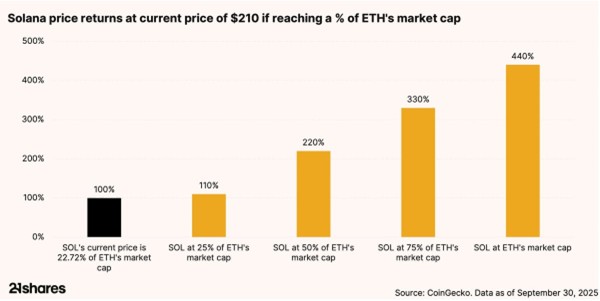
We expect Solana to reach beyond $330. Here’s why
Solana’s growth is underpinned by real fundamentals – measurable cash flows, rising user activity, and expanding economic metrics that rival multibillion dollar growth-tech companies. As Solana transitions from a speculative narrative to a revenue-generating powerhouse, traditional valuation tools like discounted cash flow (DCF) models are becoming increasingly relevant in assessing its long-term potential.


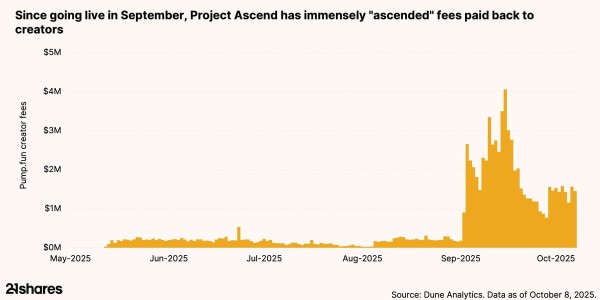
Tokenized attention: Pump.fun and the rise of Creator Capital Markets
The internet’s most valuable commodity is attention – and in 2025, that attention is becoming tokenized. Few projects embody this transformation more vividly than Pump.fun, a Solana-based platform that began as a meme-coin launchpad and has rapidly evolved beyond that use case. Launching Project Ascend in September, Pump.fun introduced Creator Capital Markets (CCM) – a suite of tools that lets streamers and influencers tokenize their audiences.

Research Newsletter
Each week the 21Shares Research team will publish our data-driven insights into the crypto asset world through this newsletter. Please direct any comments, questions, and words of feedback to research@21shares.com
Disclaimer
The information provided does not constitute a prospectus or other offering material and does not contain or constitute an offer to sell or a solicitation of any offer to buy securities in any jurisdiction. Some of the information published herein may contain forward-looking statements. Readers are cautioned that any such forward-looking statements are not guarantees of future performance and involve risks and uncertainties and that actual results may differ materially from those in the forward-looking statements as a result of various factors. The information contained herein may not be considered as economic, legal, tax or other advice and users are cautioned to base investment decisions or other decisions solely on the content hereof.


JEYH ETF är högavkastande obligationer hedgade i euro

Record crypto liquidations amid tariff shock

VALOUR VIRTUAL SEK följer priset på VIRTUAL, Virtuals Protocols egna token

Crypto market update: record liquidations amid tariff shock

Hur investera i Blockchain med hjälp av börshandlade fonder

HANetf och Infrastructure Capital Advisors samarbetar för att lansera aktivt förvaltad preferensavkastnings-ETF i Europa

IN0A ETF spårar S&P 500 med fokus på företag med höga ESG-betyg

YSLV ETP ställer ut köpoptioner på silver för att skapa en löpande avkastning

De bästa lågvolatilitets ETFer på marknaden
PLTY ETP utfärdar optioner mot aktier i Palantir
-
 Nyheter4 veckor sedan
HANetf och Infrastructure Capital Advisors samarbetar för att lansera aktivt förvaltad preferensavkastnings-ETF i Europa
-
 Nyheter4 veckor sedan
IN0A ETF spårar S&P 500 med fokus på företag med höga ESG-betyg
-
 Nyheter4 veckor sedan
YSLV ETP ställer ut köpoptioner på silver för att skapa en löpande avkastning
-
 Nyheter3 veckor sedan
De bästa lågvolatilitets ETFer på marknaden
-

 Nyheter4 veckor sedan
PLTY ETP utfärdar optioner mot aktier i Palantir
-

 Nyheter4 veckor sedan
Time in Bitcoin beats timing Bitcoin
-

 Nyheter4 veckor sedan
Investera i NEAR med en börshandlad produkt
-

 Nyheter4 veckor sedan
HANetf kommenterar kopparuppgången