
Nyheter
The potential benefits of real assets in a portfolio


- Michael Saylor’s bold Bitcoin bet and Strategy’s risk analysis
- Bitcoin price technical analysis: Where are the liquidation levels?
- What are real-world assets and why do we need tokenization?
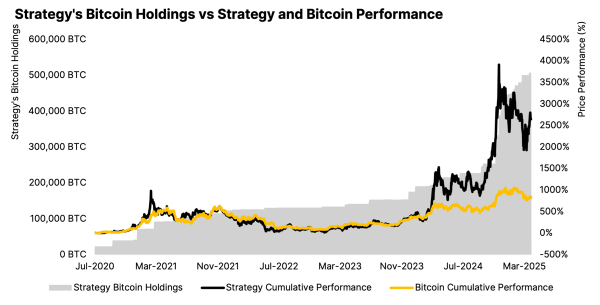
Michael Saylor’s bold Bitcoin bet and Strategy’s risk analysis
Strategy (formerly MicroStrategy) has amassed a staggering $43 billion in Bitcoin, positioning itself at the forefront of the corporate “reserve race.” Under the leadership of Bitcoin maximalist Michael Saylor, the company now boasts an $84 billion market cap. But with such an aggressive strategy, how sustainable is its approach—and what risks lie ahead? We break it down in today’s analysis.

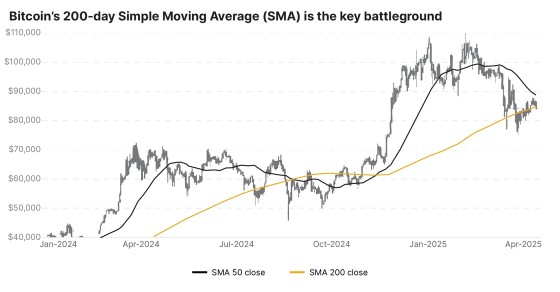
Bitcoin price technical analysis: Where are the liquidation levels?
A drop below $72,000 could flush longs, while a breakout above $90,000 may squeeze shorts. One key positive indicator is that Bitcoin continues to print higher lows since March 10, which preserves a bullish market structure in our view. Dive into our technical analysis.


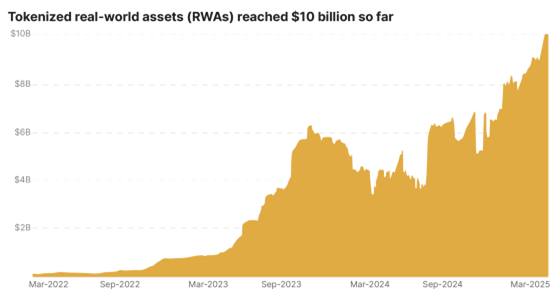
What are real-world assets and why do we need tokenization?
Imagine owning a slice of a skyscraper or a piece of fine art with just a few clicks. Tokenization, the act of converting ownership rights to real-world assets (RWAs) into tradable tokens, has surpassed $10 billion in on-chain value, unlocking global 24/7 access to once-exclusive markets with liquidity, efficiency, and yield. Find out how it works.

Research Newsletter
Each week the 21Shares Research team will publish our data-driven insights into the crypto asset world through this newsletter. Please direct any comments, questions, and words of feedback to research@21shares.com
Disclaimer
The information provided does not constitute a prospectus or other offering material and does not contain or constitute an offer to sell or a solicitation of any offer to buy securities in any jurisdiction. Some of the information published herein may contain forward-looking statements. Readers are cautioned that any such forward-looking statements are not guarantees of future performance and involve risks and uncertainties and that actual results may differ materially from those in the forward-looking statements as a result of various factors. The information contained herein may not be considered as economic, legal, tax or other advice and users are cautioned to base investment decisions or other decisions solely on the content hereof.

Since President Trump appointed Mark Uyeda as acting SEC chair two months ago, many investigations into crypto businesses have been dropped, as the SEC moves away from regulation by enforcement and works to create a framework for digital assets. As regulations become clearer and news flow turns more positive, crypto prices—which dropped sharply this week—should begin to better reflect the new regulatory landscape in the US.
We believe this regulatory shift could ultimately help trigger the next leg of the current bull run, as investors better understand the significance of regulatory clarity and seek to acquire bitcoin and altcoins at what we believe are currently very favorable levels.
Market Highlights
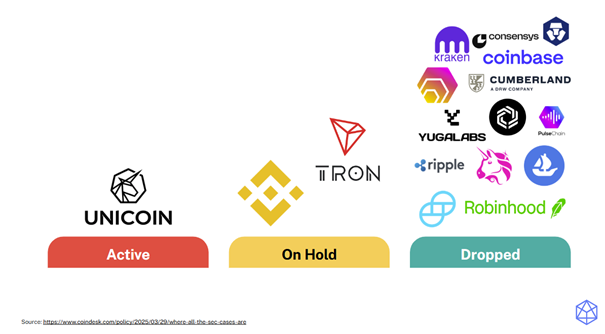
SEC Dismisses Crypto Enforcement Actions
The SEC dropped its enforcement actions against crypto-related companies Kraken, Consensys, and Cumberland DRW.
This indicates a shift in SEC’s regulatory approach, favoring clearer guidelines over enforcement actions. Such a pivot could foster a more predictable environment, encouraging innovation within the sector.
Banks to Engage in Crypto Activities
The FDIC has rescinded previous guidelines which prevented financial institutions from engaging with crypto activities without prior sign-off.
By removing bureaucratic hurdles, banks may more readily offer crypto-related services, potentially leading to broader adoption and integration of digital assets.
Bitcoin ETFs Inflow Streak Surpassed $1 Billion
US spot Bitcoin ETFs have recorded a 10-day inflow streak exceeding $1 billion marking the longest such streak in 2025.
This underscores growing institutional and retail investor confidence in Bitcoin as an asset class that helps increase market stability and possibly paving the way for the approval of other crypto-based financial products.
Market Metrics
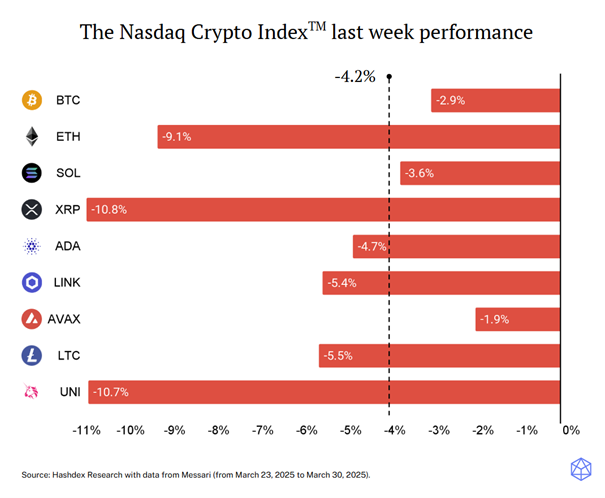
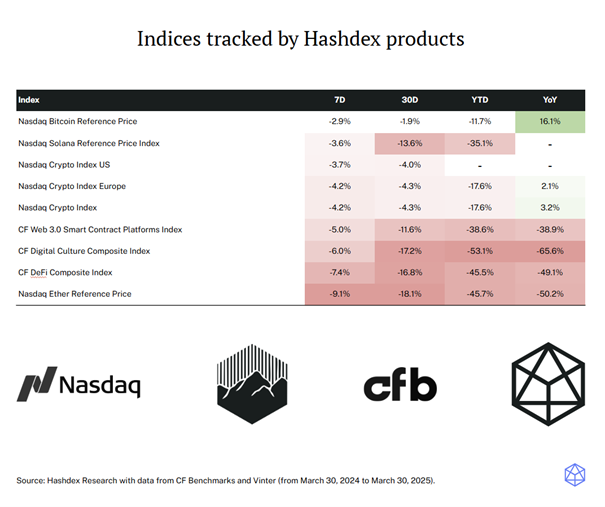
All NCITM constituents had negative performance last week, with XRP (-10.8%) and UNI (-10.7%) seeing the steepest declines. ETH also experienced a sharp drop (-9.1%), contributing to NCITM’s underperformance relative to BTC (-2.9%). The NCITM -4.2% decline reflects a broader risk-off sentiment in the crypto market, as investors reassess their positions amid ongoing macroeconomic uncertainties.
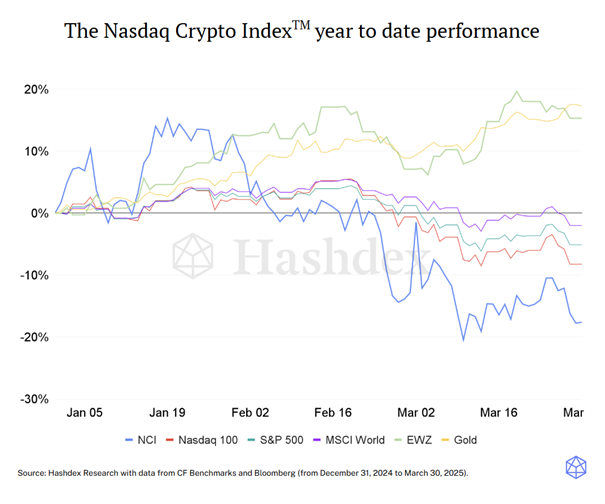
NCITM (-4.2%) extended its underperformance last week, deepening year-to-date losses. Traditional indices like the S&P 500 (-1.5%) and Nasdaq 100 (-2.4%) saw smaller declines. The gap between crypto and other risk assets continues to widen, while gold has emerged as the top performer in 2025, gaining nearly 20% amid ongoing macroeconomic uncertainties. This trend highlights a growing risk-off sentiment, with investors shifting toward defensive assets and away from high-volatility investments.

Michael Saylor’s bold Bitcoin bet and Strategy’s risk analysis

BSE0 ETF köper bara företagsobligationer med förfall 2030

US regulatory shift provides a beacon for optimism

BCFP ETF en ackumulerande fond som investerar i Nasdaq-100
21Shares ringer i klockan på Nasdaq Stockholm

Fonder som ger exponering mot försvarsindustrin

WisdomTree lanserar europeisk försvarsfond.

Warren Buffetts råd om vad man ska göra när börsen kraschar

Trumps återkomst får europeiska aktier att rusa

SAVR Global by Vanguard: Ett billigt alternativ till globala indexfonder
-
 Nyheter1 vecka sedan
Fonder som ger exponering mot försvarsindustrin
-
 Nyheter3 veckor sedan
WisdomTree lanserar europeisk försvarsfond.
-
 Nyheter1 vecka sedan
Warren Buffetts råd om vad man ska göra när börsen kraschar
-
 Nyheter3 veckor sedan
Trumps återkomst får europeiska aktier att rusa
-
 Nyheter4 veckor sedan
SAVR Global by Vanguard: Ett billigt alternativ till globala indexfonder
-

 Nyheter2 veckor sedan
De bästa börshandlade fonderna för tyska utdelningsaktier
-
 Nyheter4 veckor sedan
Utdelning i XACT Norden Högutdelande mars 2025
-
 Nyheter1 vecka sedan
En av de mest nedladdade finansapparna i Sverige