Nyheter
The Layer 2 Boom: Ethereum’s Secret Weapon for Scalability
Publicerad
11 månader sedanden
Ethereum, trading 25% below its all-time high, recently rebounded from its summer sell-off. Despite this recovery, the leading decentralized global app store continues to face growing competition from Solana and other rivals while losing users to networks built on top of its own infrastructure. Yet, there’s more to the story than meets the eye.
Figure 1 – Ethereum’s Price Performance Since Inception

Source: 21Shares, Coingecko
Network congestion, during the booms of decentralized finance (DeFi) and non-fungible tokens (NFTs), drove Ethereum’s transaction fees to be infamously high. For example, the median gas fee climbed to as high as $13.92 in 2023. This highlighted Ethereum’s scalability limitations and spurred the development of Layer 2 (L2) solutions, sidechains, and major upgrades like the Ethereum Merge to reduce costs and improve accessibility. As a result, Ethereum’s current median gas fee is 78% lower, at $2.95, while its most expensive L2 Linea’s median gas fee is currently at $0.063.
Moreover, the implementation of EIP-4844 last March, also known as Proto-Danksharding, introduced a significant upgrade to Ethereum by enabling the use of “blob space,” a novel scalability solution designed to reduce network congestion and transaction costs. Blob space refers to dedicated storage for large data blobs that do not require full validation by Ethereum nodes, making it ideal for rollups and other L2 solutions. While the upgrade resulted in reducing the fees L2s send to Ethereum, it simultaneously unlocked new levels of scalability, making the network more efficient and accessible for developers and users. In fact, Ethereum’s blob space is already nearing its target capacity, as illustrated in Figure 2 below, signaling a potential resurgence in network revenue.
Figure 2 – Blob Space – Average Blob Count Per Block

Source: 21Shares, Dune
This concept is further substantiated by the increasing rent payments to Ethereum, as illustrated in Figure 3 below. The surge in fees stems from the fact that L2s are in fact approaching their capacity limits, necessitating higher payments for data storage on the network.
Figure 3 – Rent Paid Back to Ethereum by L2s

Source: 21Shares, GrowThePie
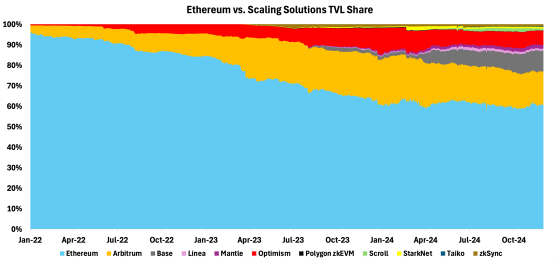
On the regulatory front, significant changes are looming for Ethereum. Gary Gensler’s imminent departure from the SEC, combined with potential policy shifts under President-elect Trump’s administration, could dramatically transform the regulatory landscape for cryptoassets. Ethereum is uniquely positioned to benefit from this transition, given its status as the dominant DeFi ecosystem, however, as shown in Figure 4, its TVL of $70B is under threat by the L2 networks atop.
Figure 4 – Ethereum vs. Scaling Solutions TVL Share
Source: 21Shares, GrowThePie
Despite the challenges faced this year, Ethereum’s stronghold reinforces its potential to thrive in this evolving environment. This shift also coincides with increased interest in Ethereum ETFs, driving record net inflows of nearly $380M on November 29, surpassing Bitcoin ETFs, which saw approximately $270M.
Figure 5 – Spot Bitcoin vs. Ethereum Net ETF Inflows

Source: 21Shares, Glassnode
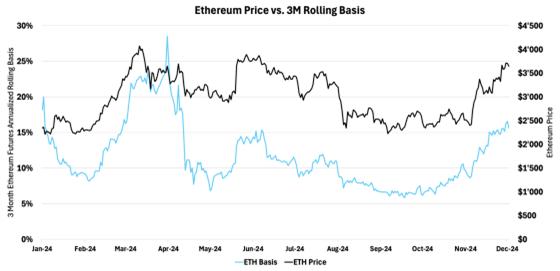
The July 2024 launch of spot Ethereum ETFs has unlocked new opportunities for investors, especially in the realm of basis trading with Ethereum futures contracts. This strategy capitalizes on the price convergence between futures and spot markets, offering a way to effectively manage risks tied to Ethereum’s price volatility. As of writing this report, the basis trade of Ethereum is 15.63% on a 3-month rolling basis, indicating a contango or a positive basis, which reflects a bullish sentiment around Ethereum’s price performance in the future. The current contango highlights that demand for future Ethereum contracts is higher than for spot Ethereum, further pushing the basis higher and signaling confidence in the future value of the pioneer smart-contract platform.
Figure 6 – Futures 3-Month Annualized Rolling Basis Indicates a Contango
Source: 21Shares, Glassnode
So, what is the relationship between Ethereum and its scaling solutions?
Scaling solutions offer the scalability Ethereum needs to operate as a global settlement layer, while Ethereum provides the foundation that supports their adoption. Given this symbiotic relationship, their performance and price movements could reflect one another. However, as gateways to affordable and efficient Ethereum usage, scaling solutions may be poised to capture heightened attention and enthusiasm during periods of ecosystem-wide interest.
As seen in Figure 7, the performance data confirms this notion. Scaling solutions significantly outperformed Ethereum since the rally began in November. StarkNet leads the pack, followed by Polygon at 88.18%, and Arbitrum close behind at 83.90%. Ethereum, in comparison, recorded a still impressive but more subdued return. This divergence underscores the growing investor interest in the latter tail of the ecosystem as it continues to expand.
Figure 7 – Scaling Solutions vs. Ethereum Price Performance

Source: 21Shares, Coingecko. Data from 1 November 2024 – 2 December 2024
However, not all of these assets move in lockstep with Ethereum. Looking at Figure 8, the price trajectories of Optimism, Arbitrum, and Polygon reveal distinct patterns. Optimism and Arbitrum mirror Ethereum’s movements with amplified peaks and troughs, signaling a tighter connection. This close linkage makes sense, as both directly operate as true L2s on Ethereum, leveraging its security and infrastructure. Polygon, on the other hand, follows a more independent path, diverging notably from Ethereum’s rhythm—a dynamic likely tied to its role as a side-chain rather than a pure L2, as well as its more established presence in the market. However, that’s due to change as Polygon fully morphes into a ZK-based rollup, making it more aligned with Ethereum.
Ethereum maintains the smoothest growth curve, reinforcing its position as a more established asset. By contrast, Arbitrum and Optimism’s divergence hints at greater volatility but also the potential for a more attractive risk-reward profile.
Figure 8 – Scaling Solutions vs. Ethereum Price Performance Over Time
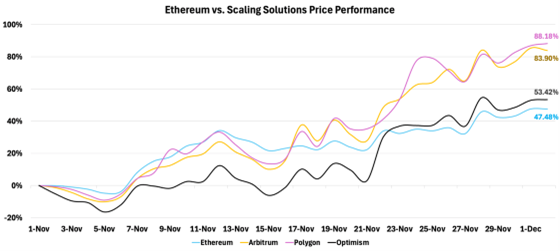
Source: 21Shares, Coingecko. Data from 1 November 2024 – 2 December 2024
To fully understand the relationship between Ethereum and its ecosystem, we turn to their beta to Ethereum, which measures the sensitivity of an asset’s price movements to another. Values above 1 indicate amplified responsiveness while values below 1 signal reduced sensitivity.
As shown in Figure 9, Optimism and StarkNet, with betas over 140%, exhibit highly amplified price movements relative to Ethereum. This implies they can deliver stronger returns during bullish periods but may come with heightened risk in downturns. In contrast, Polygon has a beta below 1, suggesting lowered volatility, aligning with its more mature status as a side-chain and its relatively independent behavior within the ecosystem.
Figure 9 – Scaling Solutions Betas to Ethereum

Source: 21Shares, Coingecko. Data from 1 November 2024 – 2 December 2024
Figure 10 offers a deeper perspective on this relationship. Optimism and Arbitrum display a strong and amplified correlation with Ethereum, as seen in the tight clustering of their data points around their trendlines. This consistency suggests that their price movements are closely tied to Ethereum’s performance, making it more predictable.
Polygon, by contrast, offers a distinct relationship reflected in the wider dispersion of its returns. This variability suggests that Polygon’s price is more influenced by external factors, such as network-specific developments, rather than being predominantly driven by Ethereum’s performance, a dynamic consistent with its relatively standalone nature. While this independence makes Polygon less reliable as a proxy, it may appeal to those seeking more uncorrelated returns while remaining tied to the broader Ethereum ecosystem.
Figure 10 – Scaling Solutions Returns vs. Ethereum
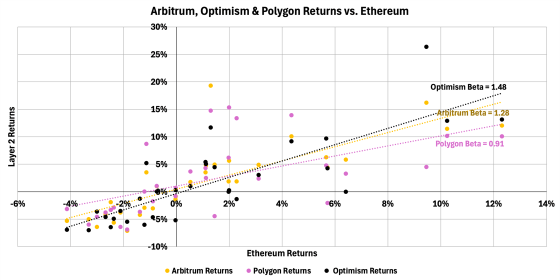
Source: 21Shares, Coingecko. Data from 1 November 2024 – 2 December 2024
Ethereum and its Different Scaling Approaches
- Sidechains
The 2018 CryptoKitties-induced congestion crisis, with $100+ fees, spurred Ethereum’s scaling efforts. Sidechains emerged as first-gen solutions, operating independently but anchoring to Ethereum for security. However, these are now outdated due to misalignment with Ethereum’s security and revenue model. This report focuses on subsequent scaling solutions, particularly true L2s, which better align with Ethereum’s ecosystem and security.
- Optimistic and Zero-Knowledge (ZK) Based Rollups
Optimism and StarkNet pioneered optimistic and ZK rollups, respectively, in 2021, offering faster Ethereum scaling solutions. Optimistic rollups assume transaction validity unless challenged, while ZK rollups provide immediate finality through mathematical proofs.
That said, most L2 networks use a single sequencer for transaction processing, which is efficient but introduces centralization risks. Ethereum currently classifies these as ”stage 0 decentralization,” but Vitalik Buterin advocates for advancing to stage 1, aiming to:
- Reduce reliance on centralized security councils for implementing upgrades
- Enable open transaction validity challenges against centralized sequencers
Optimism and Arbitrum have implemented stage 1 decentralization features, extending to networks like Base. Finally, optimistic and ZK rollups dominate user activity in the Ethereum ecosystem, as depicted below in Figure 11.
Figure 11 – Ethereum vs. Scaling Solutions Share of Daily Transactions
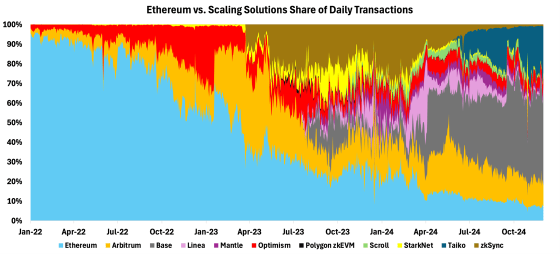
Source: 21Shares, GrowThePie
- Based Rollups
Finally, the latest iteration of rollups are known as Based rollups. In short, they are considered as a hybrid between Optimistic and ZK-based rollups, with the main difference being that they leverage Ethereum’s validator set rather than rely on a centralized sequencer. As based rollups directly utilize Ethereum’s validator set for transaction ordering, rather than using separate sequencers akin to optimistic and ZK rollups, this dynamic enhances security but demands more Ethereum resources. The approach aligns the economics of based-rollup networks like Taiko with Ethereum’s, directing more value to Layer 1, as seen previously in figure 3. While more expensive, it offers a simpler architecture, potentially increasing Ethereum’s value through greater demand for block space.
Nevertheless, the rapid expansion of L2s aimed at scaling Ethereum has led to a diverse ecosystem with over 100 networks. While this approach has resulted in offboarding a significant amount of DeFi activity to the new execution layer, as seen below in Figure 12, this degree of proliferation has also resulted in ecosystem fragmentation. Thus, the current state of the ecosystem has challenged users’ perceptions of a unified Ethereum experience and significantly dispersed liquidity across the L2 landscape.
Figure 12: L2 DEX Activity
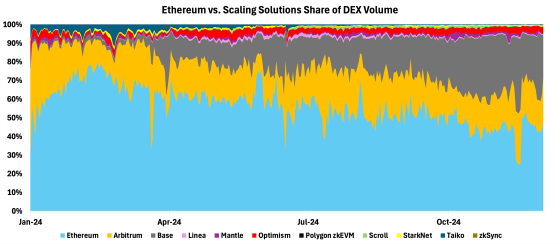
Source: 21Shares, GrowThePie
The table below provides a summary of Ethereum’s scaling solutions, highlighting how their architectures contribute to varying technological outcomes.
Figure 13 – Ethereum’s Scaling Solution Data Comparison

Source: 21Shares, GrowThePie, TokenTerminal, Dune
So, what’s the solution for L2 fragmentation?
Several key innovations are emerging to foster a more cohesive Ethereum ecosystem. While this complex topic merits a dedicated exploration, we’ll concentrate on two fundamental primitives aimed at mitigating ecosystem fragmentation:
The first is Polygon AggLayer, which is expected to go live before the end of the year. For a deeper understanding, check out our previous editions, Issue 236 and Issue 242. To recap, it’s a cross-chain protocol that allows independent chains to share liquidity, users, and states, creating a seamless network of sovereign blockchains. In short, it’ll allow users to access liquidity from multiple sources seamlessly across the Ethereum ecosystem as if they were using a single chain.
Another highly anticipated solution being adopted right now is cross-chain intents. Put simply, they refer to a simplified way for users to execute transactions across different blockchain networks. Users specify their desired outcome (like swapping tokens) without needing to understand the complex process behind it. This approach allows third-party solvers to optimize the execution, potentially reducing costs and improving efficiency while improving the user experience and addressing the fragmentation of liquidity.
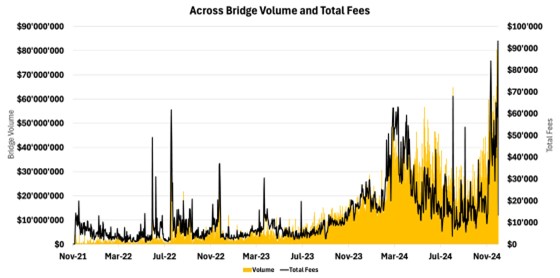
From this angle, Uniswap collaborated with Across Protocol — the trailblazer in cross-chain intent-based bridging — to introduce a new standard: ERC 7638. This innovation comes at a crucial time, as evidenced by Across’ surging popularity, as seen in Figure 14 below. Users are increasingly seeking a streamlined approach to cross-chain transactions, eager to sidestep the traditional complexities associated with blockchain bridges.
Figure 14 – Across Bridge Volume and Total Fees
Source: 21Shares, Dune
Nevertheless, this is consequential as It introduces a common framework for expressing and executing user intents across multiple blockchains, such as swaps, staking, and lending. This has led many of the leading L2s, such as Arbitrum, Optimism, Scroll, Linea, Polygon, Mantle, and Taiko, to announce support for the new standard. As such, we believe the adoption of this solution will accelerate the migration of users to the on-chain world as it becomes easier to interact with different ecosystems.
So, where’s the sector headed?
We are witnessing a notable rise in sector-specific L2s as Ethereum scaling solutions evolve to address the unique needs of distinct industries and applications. These L2s are tailored to optimize performance, cost, and user experience for specific use cases, setting them apart from general-purpose solutions like Arbitrum or Optimism. By focusing on sectors such as DeFi, gaming, or AI, sector-specific L2s offer greater customization to meet the unique demands of these applications—whether it’s faster transaction speeds for gaming, enhanced liquidity optimization for DeFi, or efficient data processing for AI workloads.
Unichain
Unichain is a DeFi-focused L2 scaling solution for Ethereum, reducing gas fees by 95% and enabling near-instant transactions. As part of the Optimism Superchain, it leverages advanced cross-chain functionality, including ERC-7683 and LayerZero, to simplify multi-chain trading and ensure seamless liquidity access. Unichain introduces a decentralized validation network and incentive system for token holders and liquidity providers. While aiming to become the premier DeFi network and tackle liquidity fragmentation, its success depends on effectively incentivizing liquidity migration. For a deeper dive, please check our previous breakdown in Issue 246.
Immutable
Immutable is a leading blockchain gaming platform offering an end-to-end solution for over 330 games. At its core, Immutable X, an L2 scaling solution, uses ZK-rollup technology to enable fast, gas-free transactions on Ethereum. It leverages Ethereum’s security while reducing costs, allowing players to own valuable in-game NFTs. Processing up to 9,000 transactions per second, it solves scalability issues and provides developer-friendly tools. Immutable X’s shared global order book ensures asset visibility across all marketplaces, enhancing liquidity and usability for the entire ecosystem.
As sector-specific L2s like Unichain and Immutable continue to emerge, they underline the growing importance of tailored solutions in unlocking the full potential of Ethereum’s diverse ecosystem. Building on this trend, upcoming Layer 2s are set to push scalability and innovation even further.
Upcoming L2s: MegaETH
MegaETH is a high-performance L2 solution for Ethereum, designed to significantly enhance scalability and user experience. As the first real-time EVM engine, it achieves 100,000 transactions per second with sub-millisecond latency on the testnet. MegaETH’s advanced architecture offloads computation from Ethereum’s main chain while maintaining security and decentralization. By enabling real-time transaction processing and improved efficiency, MegaETH aims to transform Ethereum into a mainstream technology platform, addressing long-standing scalability issues. Its launch is scheduled for Q1 2025, positioning it as a cornerstone for Ethereum’s future growth and adoption.
Legacy Players Enter the Room
Finally, legacy players are also entering the L2 space, with Sony paving the way through the launch of its own network, Soneium, signaling a broader shift toward Web3 adoption. This trend paves the way for other Web2 companies like Robinhood and PayPal, as well as TradFi institutions such as banks and payment giants like Visa, to explore their own L2 initiatives.
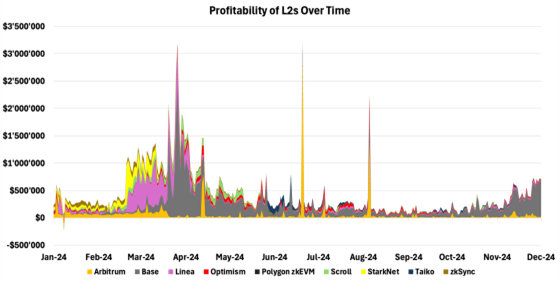
The growing interest from legacy institutions further highlights Ethereum’s potential. Crypto-native firms like Coinbase have already demonstrated the revenue-generating capabilities of L2 solutions with their Base network, which generated nearly $90 million in revenue and amassed over $3.6 billion in TVL, making it the 6th largest chain by TVL. Inspired by these successes, traditional companies will likely explore launching their own Layer 2 solutions to tap into new revenue streams, improve user experiences, and solidify their positions in the evolving Web3 ecosystem.
Figure 15 – Profit Comparison of Ethereum and its Layer 2s
Source: 21Shares, GrowThePie
Ethereum’s Layer 2 expansion has improved scalability but has led to fragmentation, dispersing liquidity, and complicating user experience. Solutions like Polygon’s AggLayer and cross-chain intents aim to unify the ecosystem, while sector-specific Layer 2s (e.g., Unichain for DeFi, Immutable for gaming) offer tailored solutions leveraging Ethereum’s security guarantees. These innovations address fragmentation, enhance interoperability, and strengthen Ethereum’s position as the primary global settlement layer while echoing its relentless innovation and growing institutional interest. Finally, we anticipate that L2s will continue to perform strongly in the upcoming weeks, driven by renewed user enthusiasm and growing institutional interest in Ethereum and its ecosystem.
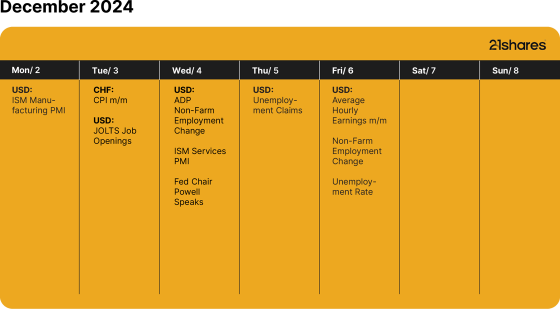
What’s happening this week?
Research Newsletter
Each week the 21Shares Research team will publish our data-driven insights into the crypto asset world through this newsletter. Please direct any comments, questions, and words of feedback to research@21shares.com
Disclaimer
The information provided does not constitute a prospectus or other offering material and does not contain or constitute an offer to sell or a solicitation of any offer to buy securities in any jurisdiction. Some of the information published herein may contain forward-looking statements. Readers are cautioned that any such forward-looking statements are not guarantees of future performance and involve risks and uncertainties and that actual results may differ materially from those in the forward-looking statements as a result of various factors. The information contained herein may not be considered as economic, legal, tax or other advice and users are cautioned to base investment decisions or other decisions solely on the content hereof.
Du kanske gillar
-


FalconX förvärvar den ledande ETP-leverantören 21shares, vilket accelererar konvergensen av digitala tillgångar och traditionell finans
-


Bitcoin within 15% of its all-time high: Should you still allocate?
-

Globala krypto-ETPer förvaltade tillgångar når 250 miljarder dollar
-


Record crypto liquidations amid tariff shock
-

Crypto market update: record liquidations amid tariff shock
-

UK to drive more Bitcoin and Ethereum demand
Nyheter
Europas ETP-marknad bryter 3-biljoners dollar-tröskeln
Publicerad
26 minuter sedanden
24 oktober, 2025
Europas ETP-marknad, marknaden för börshandlade produkter som ETFer och ETPer, har passerat en historisk tröskel och överstigit 3 biljoner dollar i tillgångar för första gången. Ökningen drevs av kraftiga inflöden till ETFer, som steg till 2,87 biljoner dollar – en ökning med 10 procent enbart under tredje kvartalet.
En stor del av tillväxten kom från kärnaktie-ETFer, som nu överstiger 1,3 biljoner dollar i tillgångar, då investerare fortsätter att föredra bred, diversifierad exponering. Räntebärande ETFer var också fortsatt efterfrågade och drog in nästan 20 miljarder dollar då investerare sökte stabilitet mitt i skiftande ränteförväntningar.
Men den mest slående trenden detta kvartal kom från marknadens kanter: aktiva och optionsbaserade ETF:er noterade exceptionell momentum. Flödena till aktiva ETFer mer än fördubblades jämfört med andra kvartalet, och tillgångarna i optionsbaserade ETFer ökade med 30 procent.
Samtidigt ökade efterfrågan på guld, guldgruv-ETFer med 67 procent, och försvars-ETFer bidrog med ytterligare 1,82 miljarder dollar. Det europeiska ETF-ekosystemet fortsätter att breddas, med sex nya emittenter som kom in på marknaden under tredje kvartalet – vilket innebär att det totala antalet varumärken uppgår till 144, varav cirka 18 procent samarbetar med HANetf.
Läs hela Exchange-Traded Europe Q3-rapporten för djupare insikter i flödena, trenderna och investerarnas teman som driver Europas rekordbrytande ETP-landskap.
Källa för all data: ETFBook; HANetf research. Data per den 30 september 2025.
Nyheter
ISRD ETF investerar i dollardenominerade företagsobligationer
Publicerad
1 timme sedanden
24 oktober, 2025
Amundi Label ISR Credit USD UCITS ETF Acc (ISRD ETF) med ISIN FR001400SDQ1, är en aktivt förvaltad börshandlad fond.
ETFen investerar i företagsobligationer denominerade i USD med investment grade-värde och förbättrar samtidigt miljömässiga, sociala och styrningsmässiga (ESG) kriterier i förhållande till Bloomberg US Corporate Bond Index (referensindexet).
Den börshandlade fondens totala kostnadskvot (TER) uppgår till 0,25 % per år. Ränteintäkterna (kupongerna) i ETFen ackumuleras och återinvesteras.
Denna ETF lanserades den 27 november 2024 och har sitt säte i Frankrike.
Investeringsmål
Amundi Label ISR Credit USD UCITS ETF Acc syftar till att få exponering mot företagsobligationer med fast ränta och investeringsgrad i amerikanska dollar, samtidigt som de miljömässiga, sociala och styrningsmässiga (”ESG”) kriterierna (”fondstyrningskriterier”) förbättras i portföljens värdepappersurval och analysprocess i förhållande till Bloomberg US Corporate Bond Index (”referensvärdet”). Denna fond förvaltas aktivt.
Handla ISRD ETF
Amundi Label ISR Credit USD UCITS ETF Acc (ISRD ETF) är en europeisk börshandlad fond som handlas på Euronext Paris.
Euronext Paris är en marknad som få svenska banker och nätmäklare erbjuder access till, men DEGIRO gör det.
Börsnoteringar
| Börs | Valuta | Kortnamn |
| Euronext Paris | EUR | ISRD |
Nyheter
HANetf lanserar Middlefield Canadian Enhanced Income UCITS ETF vilket ger europeiska investerare tillgångar inom aktivt förvaltad kanadensisk utdelning
Publicerad
21 timmar sedanden
23 oktober, 2025
- HANetf och Middlefield har lanserat Middlefield Canadian Enhanced Income UCITS ETF (ticker: ASWF) i Europa.
- ETFen är Europas första aktivt förvaltade kanadensiska aktie-ETF, utformad för att ge exponering mot Kanadas ledande naturresurssektorer genom att investera i attraktivt värderade kanadensiska large cap-företag med utdelningstillväxt.
- Förvaltas av Middlefields oberoende investeringsteam, med över 45 års expertis inom kanadensisk och brittisk aktie-investering. Middlefield är en specialistförvaltare med dokumenterad erfarenhet av att bygga portföljer som genererar motståndskraftiga, växande utdelningsnivåer.
HANetf, Europas första och ledande white-label UCITS ETF och ETC-plattform, [1] tillsammans med Middlefield, är glada att kunna tillkännage lanseringen av Middlefield Canadian Enhanced Income UCITS ETF (ticker: ASWF).
MCTC kommer att noteras med ~80 miljoner pund i förvaltat kapital, som ett resultat av världens första rollover av en brittisk sluten investeringsfond – den prisbelönta Middlefield Canadian Income Trust, som lanserades på Londonbörsen 2006.
ETFen, som är noterad på Londonbörsen, Deutsche Borse Xetra, Borsa Italiana och Euronext Dublin, är den första aktivt förvaltade, kanadensiska aktiefokuserade ETFen som görs tillgänglig för europeiska investerare.
ASWF är unik eftersom den gör det möjligt för investerare att få exponering mot Kanadas ledande utdelningstillväxtföretag i ETF-format. Fonden förvaltas aktivt av Middlefields oberoende team och är för närvarande inriktad på stora, högkvalitativa företag inom energiproduktion och pipelines, finans och fastigheter.
Kanadensiska aktier erbjuder potentiellt en attraktiv långsiktig möjlighet och handlas för närvarande till attraktiva värderingar i förhållande till sina konkurrenter i USA och globalt. Kombinationen av växande utdelningar och diskonterade värderingar har potential att leverera mycket konkurrenskraftig framtida totalavkastning.
Detta stöds av den pågående normaliseringen av räntorna, den ökande efterfrågan på avkastning och en förnyad affärsvänlig kanadensisk federal regering som fokuserar på att sänka skatter och regleringar samt stora infrastrukturinvesteringar.
Storbritanniens första investeringsfondomvandling
Allt eftersom ETF-marknaden började få investerarnas intresse i Kanada har Middlefield omvandlat flera av sina kanadensiska slutna fonder till ETFer noterade på Toronto Stock Exchange under de senaste 10 åren. ETF-strukturen ger investerare bättre likviditet samt minskade rabatter på substansvärdet och en minskning av köp- och säljkurserna.
Som ett resultat av samråd med Middlefield Canadian Income Trusts större aktieägare, och mot bakgrund av fondens fokus på utdelningstillväxtaktier med större börsvärde, fastställdes det att en omvandling till en UCITS-ETF var en naturlig utveckling av fondens struktur och skulle gynna aktieägarna genom att ge en stramare köp- och säljkurs och en lägre totalkostnadskvot.
Dean Orrico, VD och koncernchef för Middlefield, kommenterade: ”Kanadensiska utdelningsföretag har konsekvent levererat solida intäkter och attraktiv avkastning över flera cykler. Under senare år har efterfrågan på Kanadas rikliga naturresurser ökat och högkvalitativa kanadensiska utdelningstillväxtföretag är väl positionerade för att generera solid totalavkastning. Vi anser att en UCITS ETF är det mest effektiva sättet att ge denna möjlighet och strategi till brittiska och europeiska investerare, och denna lansering gör det möjligt för oss att kombinera Middlefields fyra decenniers erfarenhet med den transparens och tillgänglighet som investerare förväntar sig idag.”
Hector McNeil, medgrundare och VD för HANetf, kommenterade: ”Denna lansering markerar den 15:e aktiva ETFen på HANetf-plattformen. Den europeiska marknaden för aktiva ETFer har upplevt en snabb tillväxt, med en total förvaltningstillgångar som ökade med 68 % förra året (för att nå 55,43 miljarder dollar) och 60 % redan år 2025 (för att nå 83,33 miljarder dollar). HANetf förväntar sig fortsatt tillväxt inom denna sektor och strävar efter att bli ledande inom att erbjuda Europas bredaste utbud av aktiva strategier.”
Om Middlefield
Middlefield grundades 1979 och är en specialiserad förvaltare av aktier och avkastning med 45 års erfarenhet av att leverera utdelningsfokuserade investeringsstrategier för kunder runt om i världen. Middlefield har sitt huvudkontor i Toronto och ett kontor i London. De förvaltar strategier inom fastigheter, sjukvård, infrastruktur, energi, innovation och diversifierad avkastning. Företaget har byggt upp ett rykte för att kombinera djup sektorexpertis med disciplinerad aktiv förvaltning, med målet att ge investerare motståndskraftig avkastning och långsiktig tillväxt över flera marknadscykler.
Middlefield har en dokumenterad meritlista av att leverera prisbelönta investeringsstrategier för ETFer och avkastningsfokuserade mandat. År 2024 rankades tre av deras ETFer bland de 10 bäst presterande kanadensiska ETFerna av Morningstar, vilket förstärkte deras expertis inom utdelningsorienterade investeringar. Middlefield Canadian Income Trust utsågs till Best North America Equities Trust 2023 av Citywire, medan flera strategier har fått FundGrade A+® Ratings och Refinitiv Lipper Fund Awards, vilket understryker konsekvent prestanda och innovation över hela marknadscyklerna.
Middlefield Canadian Enhanced Income UCITS ETF (ticker: ASWF)
ISIN: IE000P1G9TM6
TER: 0.95%

Europas ETP-marknad bryter 3-biljoners dollar-tröskeln

ISRD ETF investerar i dollardenominerade företagsobligationer

HANetf lanserar Middlefield Canadian Enhanced Income UCITS ETF vilket ger europeiska investerare tillgångar inom aktivt förvaltad kanadensisk utdelning

GinsGlobal Tech Megatrend ETF lägger till kvantberäknings- och försvarsteknik mitt i global innovationsboom

JESE ETF investerar i Europa och filterar enligt ESG

Fokus mot en helt ny börshandlad produkt i september 2025

M5TYs senaste utdelningstakt (55 %) belyser covered call-strategins inkomstpotential

Börshandlade fonder för europeiska small caps

Miners Find Their Mojo as Gold Consolidates

Levler noterar ytterligare fyra börshandlade fonder i Sverige
Populära
-

 Nyheter3 veckor sedan
Fokus mot en helt ny börshandlad produkt i september 2025
-

 Nyheter4 veckor sedan
M5TYs senaste utdelningstakt (55 %) belyser covered call-strategins inkomstpotential
-

 Nyheter4 veckor sedan
Börshandlade fonder för europeiska small caps
-

 Nyheter4 veckor sedan
Miners Find Their Mojo as Gold Consolidates
-
 Nyheter2 veckor sedan
Levler noterar ytterligare fyra börshandlade fonder i Sverige
-

 Nyheter4 veckor sedan
State Street och Blackstone lanserar aktivt förvaltade CLO-ETFer i Europa
-

 Nyheter4 veckor sedan
Kärnkraftsavtal mellan Storbritannien och USA väcker förhoppningar om uranboom
-

 Nyheter4 veckor sedan
XMGA ETF spårar amerikanska aktier men exkluderar de största företagen


