
Nyheter
The Biggest Battle-Test for Stablecoins
May ended with the market cap of the entire cryptoassets market resisting at $1.38T down from $1.82T since April. Between panic sellers and ”hodlers,” returning to the fundamentals has been our main thesis that resonates especially during challenging times. In this monthly review, we will delve deeper into the macroeconomic factors driving these drops and showcase some valuable onchain metrics indicating healthy fundamentals. We will also shed light on Terra’s collapse, what led to it, and the repercussions that followed. Moreover, this report will cover the month’s most significant developments on the regulatory landscape, DeFi, and the wider metaverse.
Our Research Team has been exploring onchain indicators such as the Net Unrealized Profit/Loss (NUPL), revealing that investors who bought Bitcoin 1-2 years ago represent over 30% of the selling pressure. In the last bear market, they were representing over 40%. In this section, we’ll walk you through a few indicators our team found insightful this month.
Correlation Matrix
In Figure 1, we can observe that the correlation coefficient between BTC, ETH, and equities, namely the S&P 500 (SPY) and Nasdaq (QQQ), has been increasing consistently over the years. Simultaneously, Gold’s (GLD) correlation to these assets has decreased from very low to negative.
Figure 1 – Asset Correlation Matrix (Multiple Time Horizons)
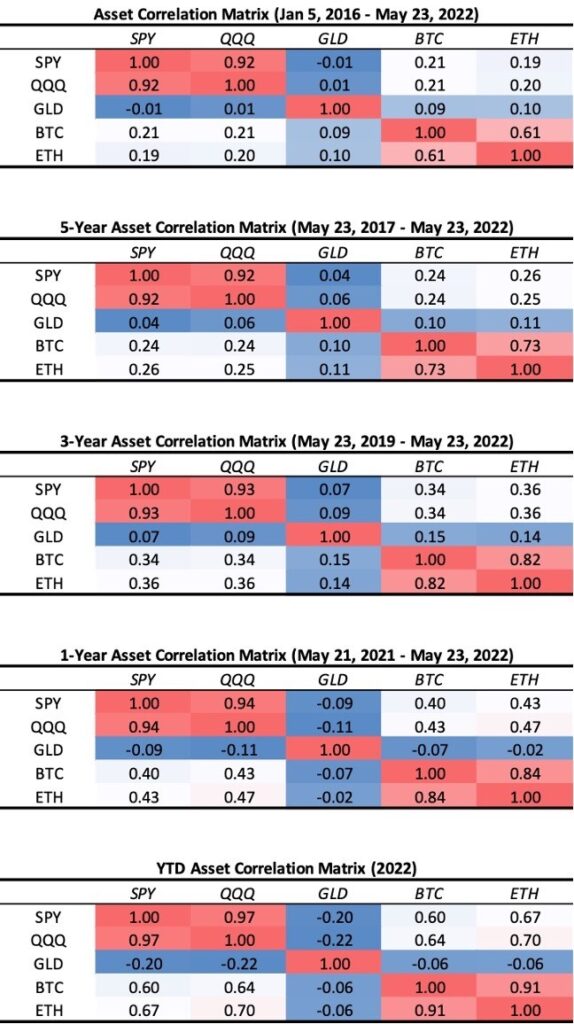
The red color means higher correlation among assets, blue color means lower or negative correlation among assets. Lower or negatively correlated assets have diversification benefits that could improve portfolio risk-adjusted returns.
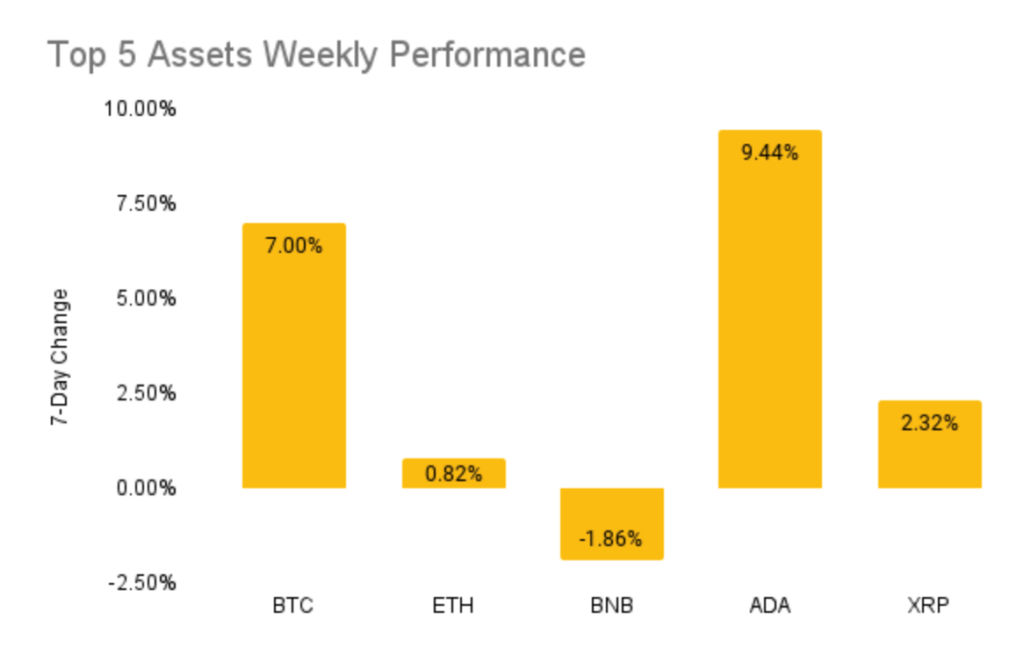
Weekly Returns
The returns of the top five cryptoassets over the last week were as follows — BTC (7%), ETH (0.82%), BNB (-1.86%), ADA(9.44%), XRP (2.32%)
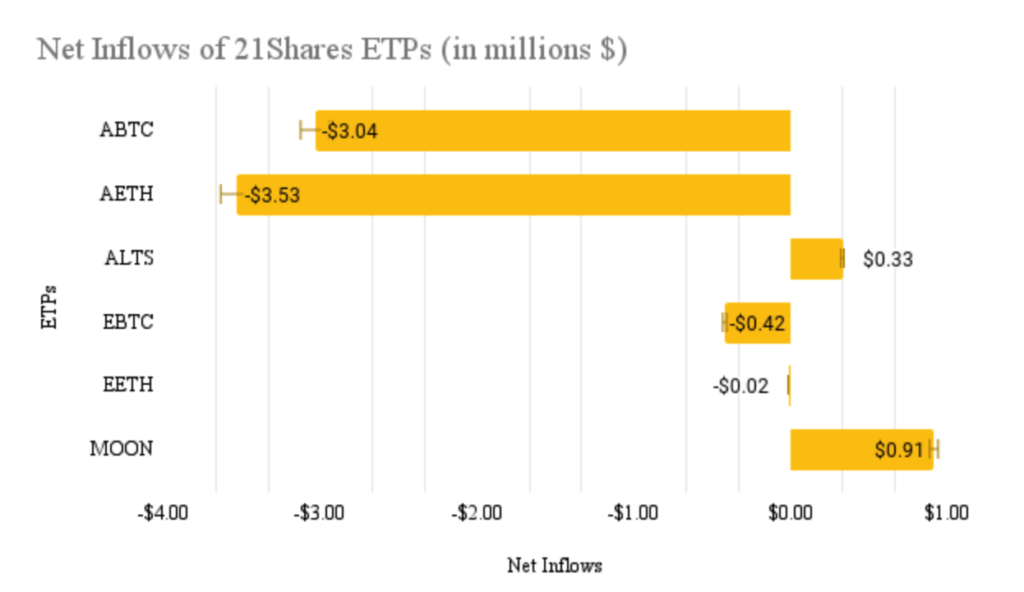
Net Inflows per 21Shares ETP
The net outflows of our ETPs amounted to $6.75M in the past week. Find the breakdown of the inflows and outflows per ETP below.
State of Crypto is Out!
We are thrilled to share that our 6th edition of State of Crypto has finally seen the light; this time around we discuss the portfolio allocation of cryptoassets. The report overviews industry happenings over the past few months and provides data on optimizing portfolio allocation for various risk profiles and portfolio strategies based on crypto-native indicators, sourced from the blockchain.
Get your ex
Research Newsletter
Each week the 21Shares Research team will publish our data-driven insights into the crypto asset world through this newsletter. Please direct any comments, questions, and words of feedback to research@21shares.com
Disclaimer
The information provided does not constitute a prospectus or other offering material and does not contain or constitute an offer to sell or a solicitation of any offer to buy securities in any jurisdiction. Some of the information published herein may contain forward-looking statements. Readers are cautioned that any such forward-looking statements are not guarantees of future performance and involve risks and uncertainties and that actual results may differ materially from those in the forward-looking statements as a result of various factors. The information contained herein may not be considered as economic, legal, tax or other advice and users are cautioned to base investment decisions or other decisions solely on the content hereof.


In a world where financial value is traditionally tied to cash flows, utility, or cutting-edge technology, Dogecoin stands as a bold exception.
Launched in 2013 as a lighthearted experiment, Dogecoin began as a meme, a Shiba Inu with a quirky caption. But over time, it has grown into something far greater: a symbol of internet-native value. What started as a playful jab at the seriousness of finance has become a global phenomenon, proving that in the digital age, emotion, culture, and community can be just as powerful as a balance sheet.
DOGE is an emotion
Dogecoin isn’t your typical crypto asset. It doesn’t boast a groundbreaking protocol or a meticulously engineered roadmap. Instead, it thrives on something more intangible yet undeniably potent: relevance.
Memes are the internet’s lifeblood, serving as carriers of humor, identity, and connection. Dogecoin took this ephemeral currency of the web and turned it into a lasting asset, not by chasing trends but by embedding itself in the fabric of online culture. While most memecoins have flared up and faded away, Dogecoin has endured, evolving into digital folklore that resonates worldwide.
At the core of this phenomenon is Dogecoin’s community: vibrant, irreverent, global, and fiercely loyal—a self-sustaining digital tribe that truly matters in a decentralized world.
Dogecoin’s power is in its people
This community creates attention, which brings liquidity; builds a sense of belonging, which drives retention; and inspires advocacy, which fuels growth. In a world where attention is scarce and sentiment shapes capital flows, this grassroots network isn’t just a feature—it’s the engine.
DOGE’s value lies in its ability to rally people around a shared, lighthearted ethos, turning a meme into a movement that challenges us to rethink what ”value” means in a hyper-connected world.
With that said, let’s meet Dogecoin, the original memecoin that’s rewriting the rules.
Doge is becoming more mainstream
With a jaw-dropping return of over 130,000%, or 127% annualized over the last decade, Dogecoin stands as the best-performing top 25 cryptocurrency of the past 10 years and has rapidly grown into a $30 billion asset embraced by millions.
Fueled by fast, low-cost transactions, a vibrant grassroots community, and growing mainstream acceptance, including from Tesla, AMC, and Newegg, Dogecoin continues to reinforce its retail appeal and real-world utility.
After reaching its all-time high in May 2021, Dogecoin’s network has continued to grow. The total number of wallet addresses has nearly doubled from 44 million to over 84 million in less than four years, showcasing Dogecoin’s rapid adoption and growing mainstream recognition.
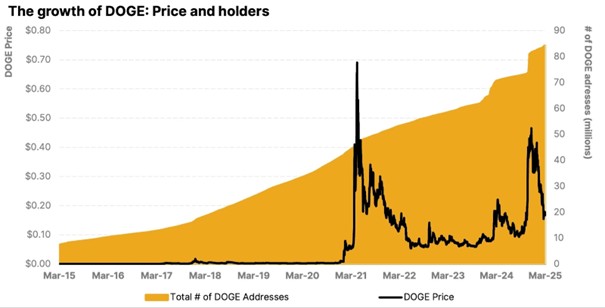
With millions of holders worldwide, Dogecoin’s ascent as the original memecoin has cemented its place as both a cultural icon and a widely used entry point into crypto. Its approachable, community-led ethos has onboarded countless first-time investors into the digital asset space.
Now, with the launch of traditional financial products, Dogecoin enters a new chapter, available through a regulated, institutionally-backed investment vehicle offering secure, transparent access to a more traditional generation of investors as they get acquainted with the oldest dog on the blockchain.
Research Newsletter
Each week the 21Shares Research team will publish our data-driven insights into the crypto asset world through this newsletter. Please direct any comments, questions, and words of feedback to research@21shares.com
Disclaimer
The information provided does not constitute a prospectus or other offering material and does not contain or constitute an offer to sell or a solicitation of any offer to buy securities in any jurisdiction. Some of the information published herein may contain forward-looking statements. Readers are cautioned that any such forward-looking statements are not guarantees of future performance and involve risks and uncertainties and that actual results may differ materially from those in the forward-looking statements as a result of various factors. The information contained herein may not be considered as economic, legal, tax or other advice and users are cautioned to base investment decisions or other decisions solely on the content hereof.


Hur investerar jag i ETFer som fokuserar på breda vallgravar?

WELL ETF för den som tror på den globala IT-sektorn

Dogecoin, the meme that made it

VSUI ETN spårar priset på kryptovalutan SUI

Stablecoins: The real powerhouse of crypto

Fonder som ger exponering mot försvarsindustrin
Crypto Market Risks & Opportunities: Insights on Bybit Hack, Bitcoin, and Institutional Adoption

Montrose storsatsning på ETFer fortsätter – lanserar Sveriges första globala ETF med hävstång

Warren Buffetts råd om vad man ska göra när börsen kraschar

Svenskarna har en ny favorit-ETF
-
 Nyheter4 veckor sedan
Fonder som ger exponering mot försvarsindustrin
-

 Nyheter3 veckor sedan
Crypto Market Risks & Opportunities: Insights on Bybit Hack, Bitcoin, and Institutional Adoption
-
 Nyheter2 veckor sedan
Montrose storsatsning på ETFer fortsätter – lanserar Sveriges första globala ETF med hävstång
-
 Nyheter4 veckor sedan
Warren Buffetts råd om vad man ska göra när börsen kraschar
-
 Nyheter3 veckor sedan
Svenskarna har en ny favorit-ETF
-

 Nyheter2 veckor sedan
MONTLEV, Sveriges första globala ETF med hävstång
-

 Nyheter4 veckor sedan
Fastställd utdelning i MONTDIV mars 2025
-

 Nyheter2 veckor sedan
Sju börshandlade fonder som investerar i försvarssektorn