
Nyheter
Telegram Troubles: The Ripple Effects on TON
• Telegram was accused of allegedly facilitating 12 criminal violations.
• Toncoin, the Telegram-associated token, plunged by ~25% immediately after the news.
• Telegram’s sticky user base and network effects are the biggest catalysts for TON.
• Telegram is likely to persist despite its setbacks, similar to other social media platforms.
Pavel Durov, the founder of the popular encrypted messaging app Telegram, was arrested on August 24 in Paris as part of preliminary investigations into the platform’s alleged role in facilitating 12 criminal violations. In response, The Open Network’s (TON) native token, Toncoin, plummeted by 25% since the arrest to a low of $5.11 in fear of what the escalation of this investigation may bring.
Figure 1 – TON Weekend Price Performance
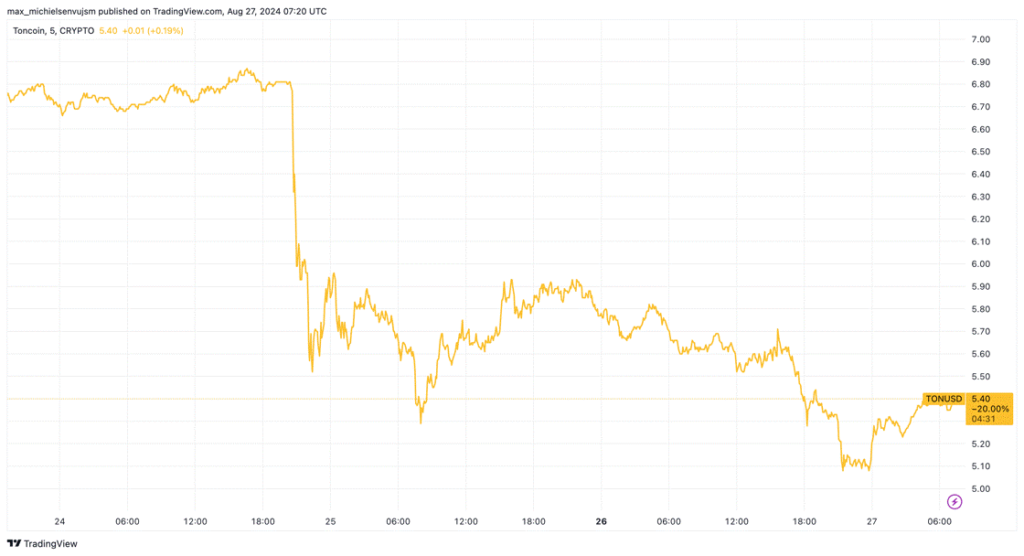
Source: TradingView
Although French President Emmanuel Macron clarified that the arrest was not political, Telegram has a long history of denying governmental access to its user base. In 2013, Russian authorities demanded Telegram take down online communities of Russian opposition activists and hand over personal data of users who took part in the popular uprising in Ukraine that ousted a pro-Kremlin president. Pavel said he turned down these demands and left the country afterward.
As we wait for more details about the investigation, we will dig in to learn more about the ecosystem surrounding TON and what to expect based on their on-chain metrics tracking the blockchain’s performance since the start of the year.
Quick recap: What is TON, and how is it related to Telegram?
The Open Network (TON) is a layer-one blockchain originally developed by Telegram. The project faced significant challenges, particularly with U.S. regulators over alleged violations of federal securities laws. As a result, in May 2020, Telegram suspended its support for TON, clearing the path for the TON Foundation to take over in 2021.
Although they function independently, Telegram and TON benefit from their symbiotic relationship. Founded in 2013, Telegram is now among the top 10 social media platforms with about 900M monthly active users. TON leverages this user base and, in turn, provides Telegram with the crypto railways it needs to unlock its full potential from an encrypted messaging platform into a Super App. Aside from its user-friendliness, which plays a key role in TON’s adoption rate, Telegram is also favored for its privacy guardrails, which have since drawn some legal concerns.
What does that mean for TON, in the short and long term?
• Not codependent: While they have a close relationship, TON and Telegram operate independently from their respective headquarters in Zug, Switzerland, and Dubai, UAE. Furthermore, both companies inked a strategic partnership in 2023, further distinguishing their relationship. The recent sell-off in TON following Durov’s arrest could reflect a short-term overreaction driven by market sentiment rather than a fundamental issue with TON itself.
For instance, decentralized exchange (DEX) transaction volume peaked at $167M following Pavel’s arrest, which could indicate people trading out of TON and moving onto other assets. Nevertheless, before Telegram’s potential troubles, TON’s decentralized exchange (DEX) transaction volume demonstrated a robust upward trend, as shown in Figure 2. The growth in transaction volume suggests that users and developers continue to engage actively with the network, indicating confidence in its long-term potential.
Figure 2: TON DEX Transaction Volume
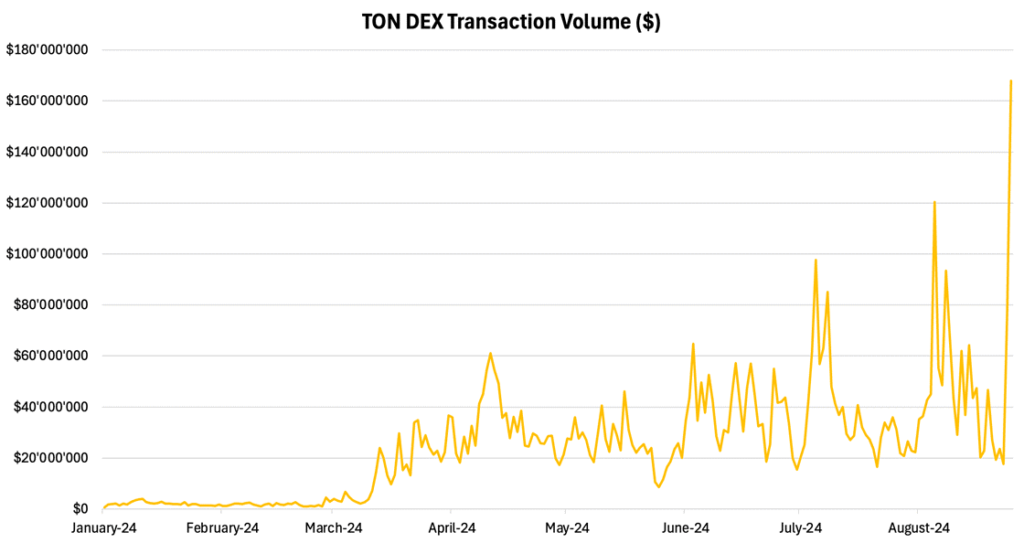
Source: Artemis, 21Shares
• Privacy policy: If Telegram alters its encryption to allow governments to have backdoor access to user messages, then we could see an exodus of users from the platform, which could affect TON’s total addressable market in the long run.
One of the reasons for Telegram’s adoption rate is the app’s privacy-centric infrastructure, which aligns with the crypto community’s ethos of maintaining privacy. For instance, Resistance Dog, REDO, a TON-based memecoin championing the fight against digital censorship, jumped by 70% following Pavel’s arrest. Although the project itself isn’t a privacy solution, the surge can be seen as a proxy for the growing hunger for secure, privacy-oriented platforms, especially in response to emerging threats to user privacy. In recent years, meme coins have generally evolved into proxy bets on the underlying network as they catalyze retail attention.
• Unsolved technical mysteries: To uncover the full story, we need to identify where the TON code base is hosted and who controls it, which would require access to classified information within both organizations. We know from TON’s explorer that its 350 validators are distributed geographically between the U.S., Europe, and Latin America. However, there are some bottlenecks to solving these mysteries, as it’s also currently unclear how many validators Telegram controls.
These details would shed light on the project’s governance and its resilience to external pressures, such as the arrest of key figures like Pavel. Understanding the decentralization of TON’s development and control will help clarify whether the recent market reactions are justified or simply driven by uncertainty. The extent to which the project is insulated from individual influences will be crucial for assessing its long-term stability.
So far, Telegram has responded to its CEO’s arrest by saying that it’s compliant with EU regulations, including the Digital Services Act, arguing that its content moderation “is within industry standards and constantly improving.”
Does TON have cause for concern?
On a fundamental level, TON has outshone several of the bigger crypto players by leveraging several user-friendly features and access to an existing addressable market, Telegram’s vast user base of 900M.
Despite the current troubles, it has been a historic year for TON, up 138% year-to-date.
Figure 3: TON Price Performance Year-to-Date
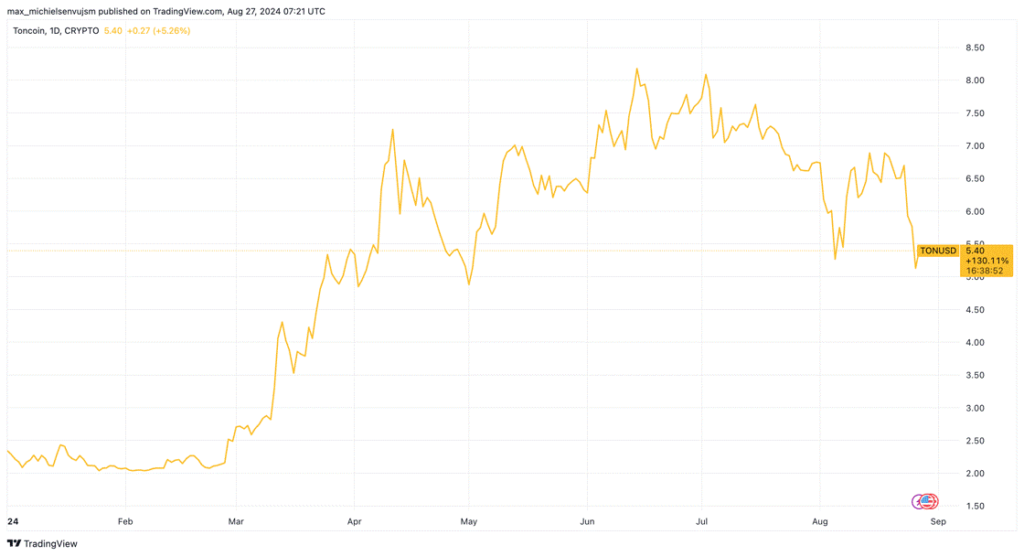
Source: TradingView
This is mirrored in the tremendous growth in Total Value Locked (TVL), a crypto-proxy for assets under management, which started the year at a mere $13.5M and reached a peak of $776M on July 20 this year.
Figure 4: TON Total Value Locked
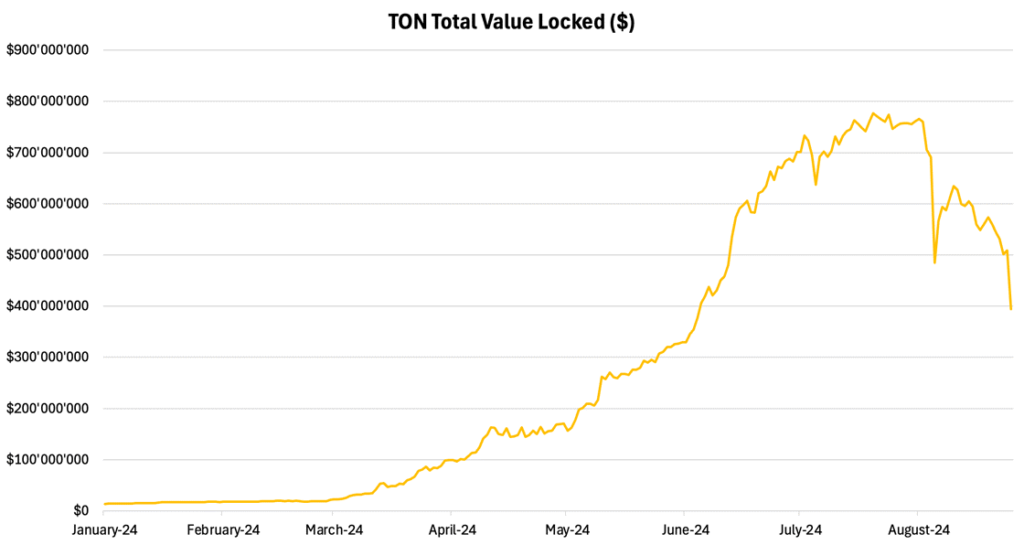
Source: Artemis, 21Shares
While TVL is currently down to around $400M, this is still up 2820% this year, and the current retracement is largely due to the aforementioned price hit TON recently took.
A significant portion of TON’s TVL is concentrated in its DeFi sector, particularly in liquid staking. Tonstakers boast the highest liquid staking rate across all chains, signaling strong user engagement in TON’s DeFi ecosystem. This high participation rate not only highlights the attractiveness of TON’s DeFi applications but also underscores the growing confidence and interest in the platform’s potential for generating yield.
Beyond Finance
However, TON is not just about DeFi. Looking beyond this sector, TON’s ecosystem of Mini Apps has a TVL of approximately $69M, with the top 20 boasting $50M.
Figure 5: Total Value Locked across Telegram Mini App Ecosystem
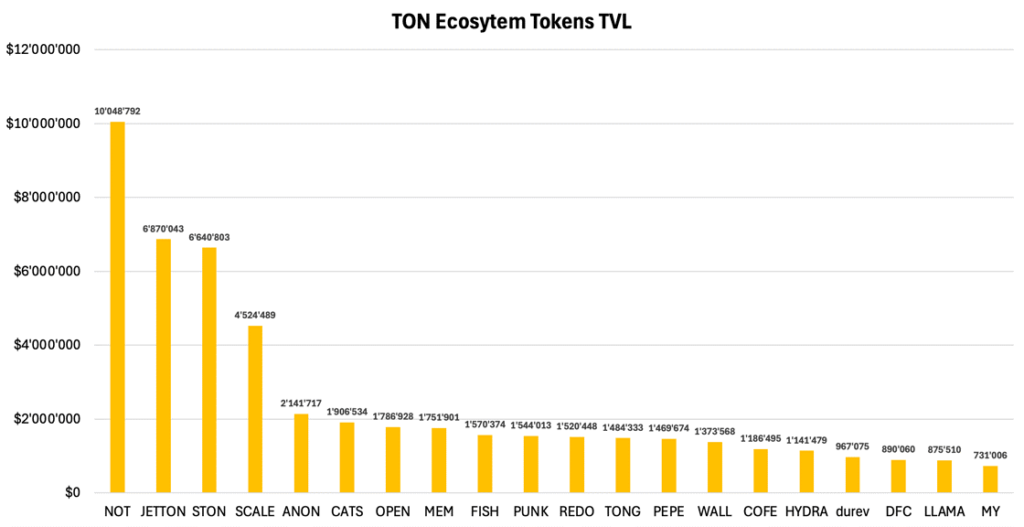
Source: Artemis, 21Shares
Data: from July 10 to August 7, 2024 (Season 5 of The Open League Competition)
While this sector is not as large as TON’s DeFi landscape, it consists of decentralized applications (dApps) that leverage TON’s user-friendly features, making it easier for users to engage with other services. These Mini Apps are crucial for lowering barriers to entry and retaining user attention while driving further activity on the network.
For instance, Hamster Kombat, a tap-to-earn game, recently onboarded nearly 250M users in just three months, making it the third fastest-growing application ever! This level of traction speaks on TON’s ability to host activity beyond the DeFi sector, and may serve as a prime example of the platform’s potential to further develop its GameFi suite, and continue to onboard the next generation of crypto users.
The substantial number of off-chain users highlights the strong retention of the Mini App ecosystem. Many of these apps rely on off-chain components, a trend likely to increase as web3 games focus on sustainable cost management. This metric effectively reflects genuine demand and engagement, showcasing the successful integration between Telegram and TON.
Figure 6: Total Number of off-chain users across Telegram Mini App ecosystem
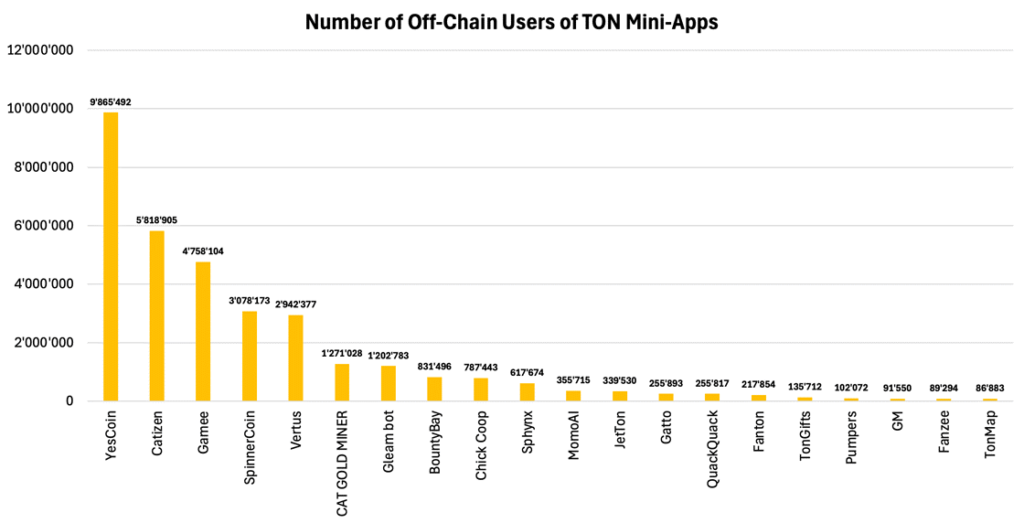
Source: Artemis, 21Shares
Data: from July 10 to August 7, 2024 (Season 5 of The Open League Competition)
Similarly, TON’s growing attention is further highlighted in surpassing Ethereum’s mainnet daily active users, currently housing almost 500K daily users, 33% more than the smart-contract platform giant. Furthermore, compared to Ethereum scaling solutions, TON only comes second to Base regarding active addresses! This is noteworthy as Base, like TON, leverages a large, existing user base (through Coinbase), underscoring the effectiveness of tapping into an active and existing market.
Figure 7: Daily Active Addresses TON vs. Ethereum and Scaling Solutions
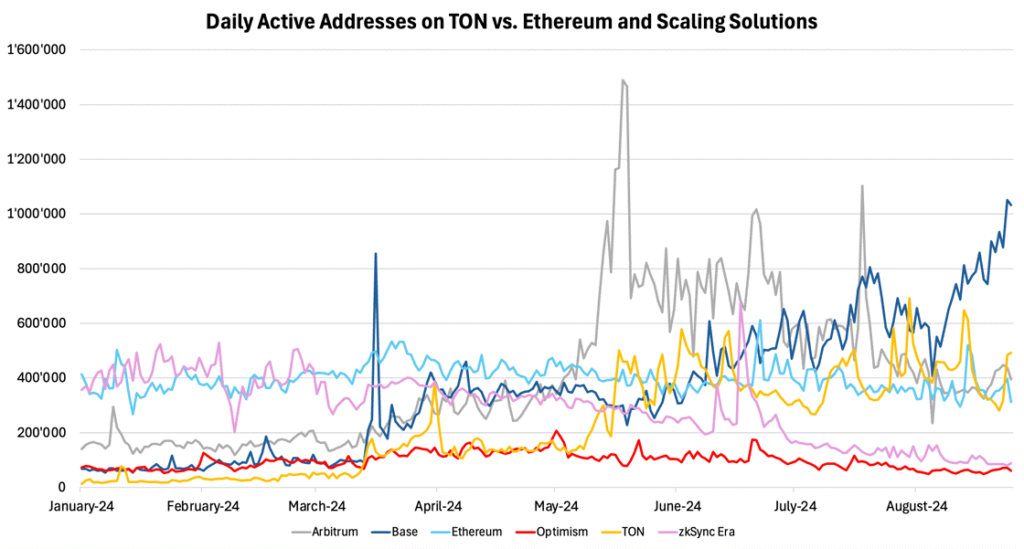
Source: Artemis, 21Shares
Daily transactions have surged over the past eight months, rising from under 500K to nearly 2M. This growth stemmed from key developments that boosted network utilization, including introducing ad-revenue sharing on TON, deploying USDT, and enabling Philippine citizens to make social security contributions using USDT on TON—a novel use case. Currently, TON’s stablecoin market cap is $620M, driven largely by USDT, which is set to unlock TON’s DeFi potential. On August 13th, the network processed over $1.2B, its highest single-day volume ever.
Figure 8: Daily Transactions on TON vs. Ethereum and Scaling Solutions
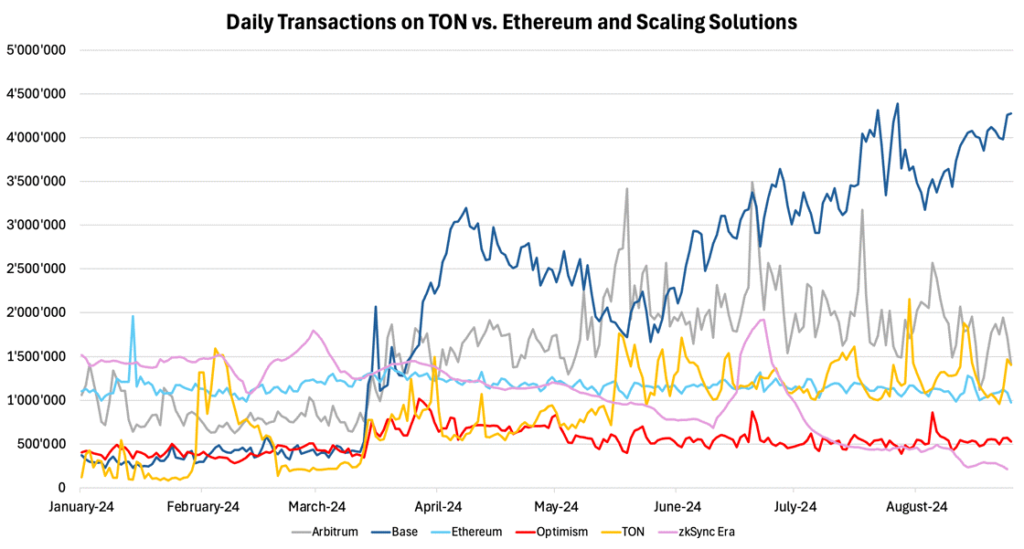
Source: Artemis, 21Shares
Despite TON’s explosive growth this year, it demonstrated remarkable scalability. While comparable networks struggle with rising fees as adoption increases, TON maintained an average transaction cost below $0.10. This stands in contrast to networks like Cardano, which routinely maintained higher fees despite significantly less adoption and fewer applications. Even when activity surged, it reached just shy of $0.45. While that is more expensive than the leanest blockchains like Sui and Solana, it’s important to remember that TON’s main opportunities lie in onboarding a host of new crypto entrants from Web2. These entities prioritize a user-friendly and familiar process, which TON offers, as opposed to a mere $0.05 cheaper transaction costs.
Figure 9: Comparison of Transaction Fees Between L1s
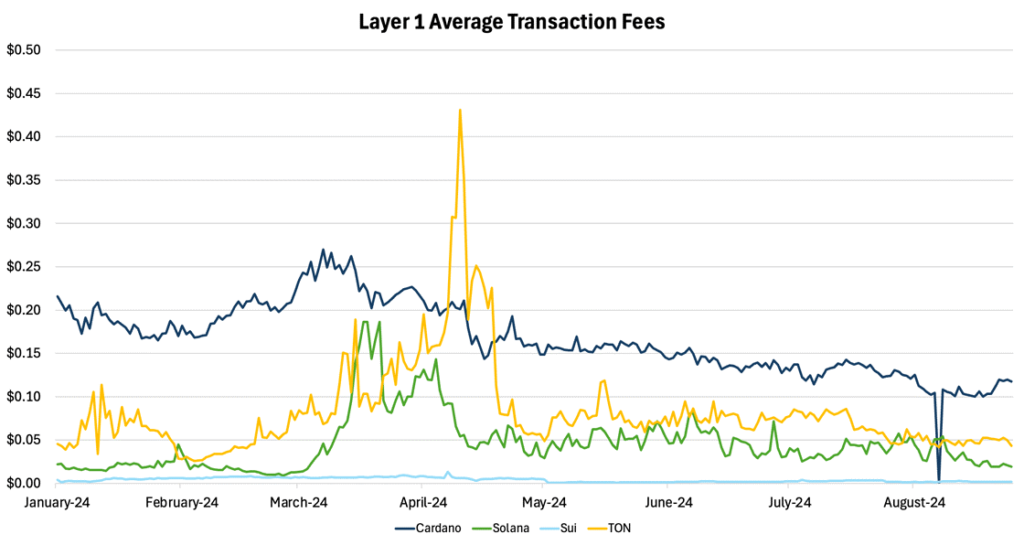
Source: Artemis, 21Shares
While the Telegram situation is certainly significant and may impact TON’s addressable market, it’s important to recognize that TON operates independently and has demonstrated impressive growth this year. The network’s robust adoption, driven by its approach to becoming a Super App supported by user-friendly features and a diverse ecosystem, positions it well to continue onboarding a new wave of crypto users.
In recent years, social media platforms have faced backlash over free speech and security issues, yet they continue to retain a loyal user base due to strong network effects. Similarly, Telegram is likely to maintain its high user engagement and popularity, even if policy changes occur, as its user stickiness remains robust.
For investors interested in leveraging the recent correction, the following ETPs are available on the European market, offering investors exposure to TON.
Figure 10 – 21Shares TONN ETP
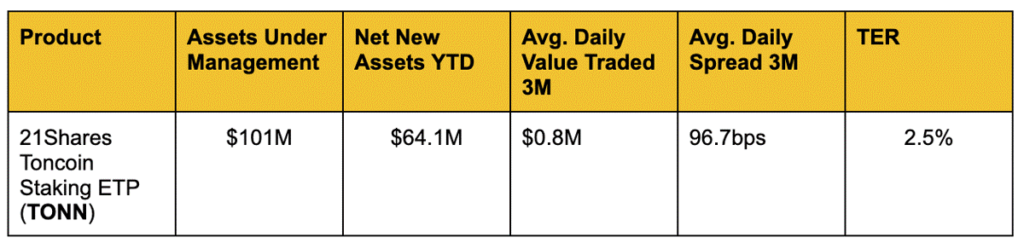
Source: Bloomberg, Data as of August 26, 2024.
Avg. Daily Spread YTD (bps): refers to the best daily average bid/ask spread this year across European exchanges.
Bookmarks
• Learn more about The Open Network from our investment thesis.
• Read about TON’s Meteoric Rise in one of our previous newsletters.
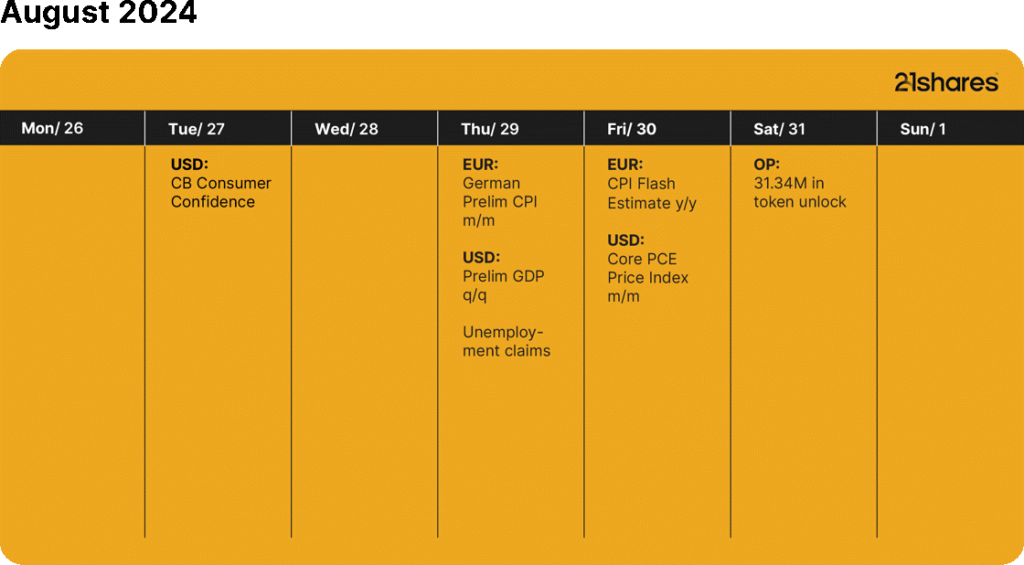
Source: Forex Factory, 21Shares
Research Newsletter
Each week the 21Shares Research team will publish our data-driven insights into the crypto asset world through this newsletter. Please direct any comments, questions, and words of feedback to research@21shares.com
Disclaimer
The information provided does not constitute a prospectus or other offering material and does not contain or constitute an offer to sell or a solicitation of any offer to buy securities in any jurisdiction. Some of the information published herein may contain forward-looking statements. Readers are cautioned that any such forward-looking statements are not guarantees of future performance and involve risks and uncertainties and that actual results may differ materially from those in the forward-looking statements as a result of various factors. The information contained herein may not be considered as economic, legal, tax or other advice and users are cautioned to base investment decisions or other decisions solely on the content hereof.


HANetf får tillväxtkapitalinvestering från Citi

CHSD ETF satsar på korta japanska statsobligationer

ETF-noteringar på Xetra och Börse Frankfurt

FTMA ETF skyddar investerarna mot nedgång i S&P500

Market Snapshot: Gold’s Resilience Defies Risk-On Rally

De bästa ETFer som investerar i europeiska utdelningsaktier

YieldMax® lanserar sin andra produkt för europeiska investerare

Big News for Nuclear Energy—What It Means for Investors

Nya börshandlade produkter på Xetra

3EDS ETN ger tre gånger den negativa avkastningen på flyg- och försvarsindustrin
-
 Nyheter2 veckor sedan
De bästa ETFer som investerar i europeiska utdelningsaktier
-
 Nyheter3 veckor sedan
YieldMax® lanserar sin andra produkt för europeiska investerare
-
 Nyheter3 veckor sedan
Big News for Nuclear Energy—What It Means for Investors
-
 Nyheter4 veckor sedan
Nya börshandlade produkter på Xetra
-
 Nyheter3 veckor sedan
3EDS ETN ger tre gånger den negativa avkastningen på flyg- och försvarsindustrin
-
 Nyheter2 veckor sedan
Nordea Asset Management lanserar nya ETFer på Xetra
-

 Nyheter2 veckor sedan
Svenska investerare — 21Shares Nasdaq Stockholm-sortiment har just blivit starkare
-

 Nyheter4 veckor sedan
HANetfs VD Hector McNeil kommenterar FCAs kryptonyheter