
Nyheter
Stablecoin Synergy: Bridging Traditional and Decentralized Finance
Stablecoins have swiftly become the backbone of the crypto world, driving 50% of all on-chain activity. Bridging the gap between volatile cryptoassets and fiat, they provide stability and a trusted medium for transactions. Seamlessly integrated into platforms like Stripe and PayPal, they empower users to engage with crypto without technical know-how. With fast, low-cost payments, stablecoins are revolutionizing remittances and cross-border transactions, especially in regions facing currency challenges, like 70% of the African continent. Their unique appeal to crypto veterans and newcomers fuels widespread adoption, positioning them as a key driver in the evolution of finance.
What Are Stablecoins?
Stablecoins are cryptoassets designed to maintain a stable value, usually pegged 1:1 to a commodity like gold or a fiat currency like the dollar. This design makes them ideal for everyday transactions and remittances.
• Fiat-collateralized: backed by fiat currencies, they represent the wholesome of this segment’s adoption. (Examples: Tether’s USDT and Circle’s USDC)
• Crypto-collateralized: backed by crypto, and to account for their volatility, they are often overcollateralized. (Example: MakerDAO’s DAI)
• Algorithmic: backed by algorithms and smart contracts to maintain their peg without any reserves. Instead, the peg is maintained by programmed mint and burn mechanisms. (Example: Aave’s GHO)
How Do Stablecoins Collateralize Their Assets?
Stablecoins maintain a peg through specific collateralization strategies and market mechanisms designed to defend against price fluctuations.
Fiat-Collateralized Stablecoins
USDT and USDC are issued by centralized entities like Tether and Circle and are backed mostly by fiat reserves held in off-chain bank accounts. Tether invests around 15% of its reserves in assets like Bitcoin and secured loans to drive revenue while keeping most of its holdings in cash or equivalents to ensure it can meet redemptions, as outlined in its Transparency Report.
• Operates on a 1:1 model, where each token is backed by an equivalent amount of fiat or cash equivalent (e.g., 1 USDC = $1).
• Issuers can liquidate reserves when needed, ensuring sufficient collateral to cover all outstanding tokens and maintain stability.
• Their straightforward design makes them highly efficient for trading and as collateral in DeFi, where liquidity is essential.
Thanks to their simplicity and reliability, fiat-backed stablecoins dominate the market—USDT and USDC alone boast over $140B, controlling over 90% of the market, as shown in Figure 1.
Figure 1 – Dominance of Fiat-Collateralized Stablecoins
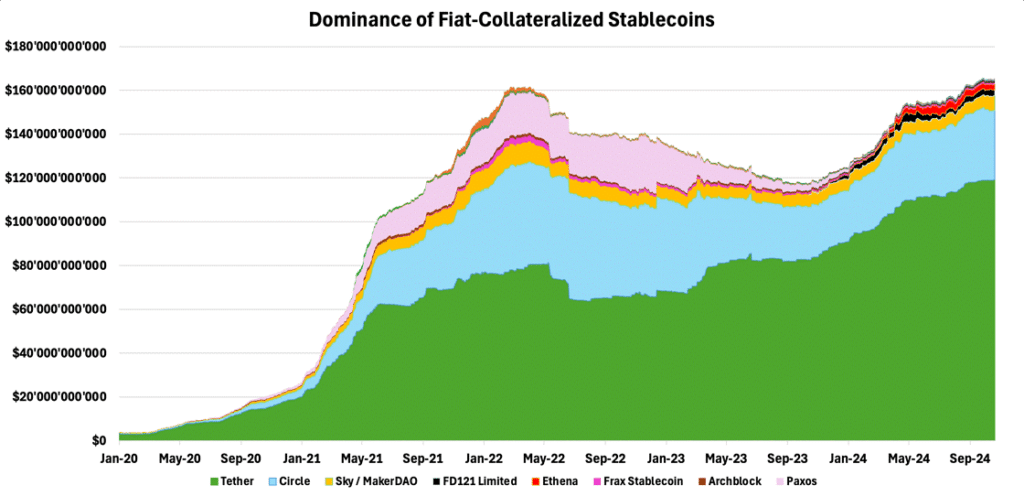
Source: TokenTerminal, 21Shares
Crypto-Collateralized Stablecoins
Often operating without centralized oversight, they rely on smart contracts and cryptoassets as collateral to maintain stability.
• Typically, over-collateralized means users must lock up more value in crypto than the stablecoins they mint, creating a buffer to ensure stability even in volatile markets.
• If collateral falls below the threshold, users forfeit it to the protocol, protecting the peg. Price oracles automatically trigger liquidations to maintain solvency.
• While decentralized, this model requires a robust system of smart contracts. Interactions between smart contracts introduce technological risks that must be carefully managed to prevent potential failures.
A prime example is MakerDAO’s DAI, where users lock up ETH as over-collateralized debt. MakerDAO adjusts interest rates through on-chain governance, balancing supply and demand to maintain the peg. Due to its decentralized nature and internal management, DAI processed over $113B in inflows and outflows last month, as shown in Figure 2.
Figure 2 – Supply Inflow vs. Outflow due to DAI’s Decentralized Operations
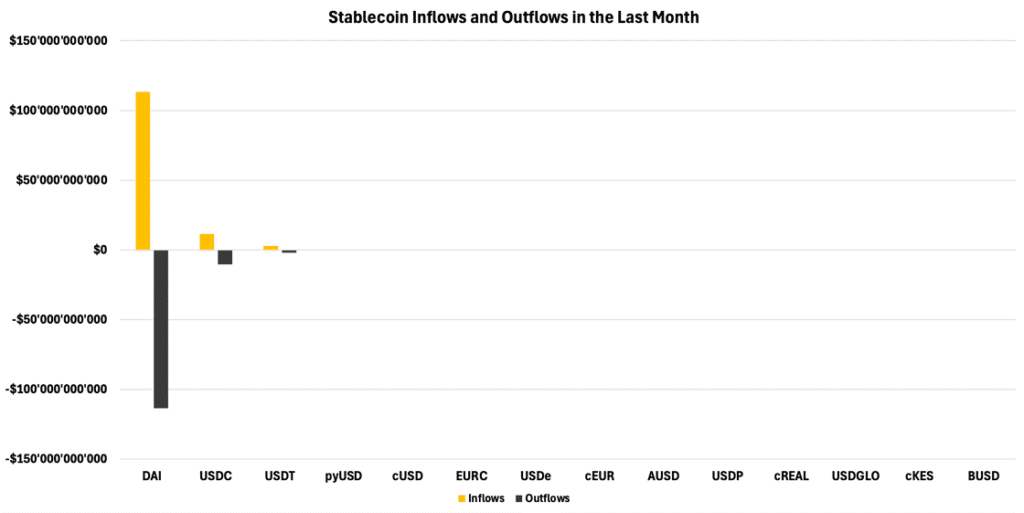
Source: Artemis, 21Shares
Algorithmic Stablecoins
Aiming to maintain stability without using collateral, they rely instead on smart contracts and supply adjustments.
• Protocols like Ampleforth (AMPL) target a CPI-adjusted dollar by adjusting token supply based on price changes. If the price rises above the peg, the supply increases; if it falls below, the supply contracts through a process called rebasing.
• Some designs, like UST, used a second ”bond” token, LUNA, to expand and contract supply.
While innovative, these attempts have proven less reliable than collateral-backed models. Miscalculations or design flaws can lead to Black Swan events, as seen in the UST collapse.
So, How Are They Used?
- Trading / Exchange
Due to their stability, stablecoins have become integral to crypto trading, serving as both a store of value and a medium of exchange. Analyzing the two largest fiat-collateralized stables by market cap echoes this pattern. For USDC, approximately 60% of its supply resides in Externally Owned Accounts (EOAs), with 11% in Centralized Finance (CeFi) platforms, as demonstrated in Figure 3.
Figure 3 – USDC Utilization Across the Crypto Ecosystem
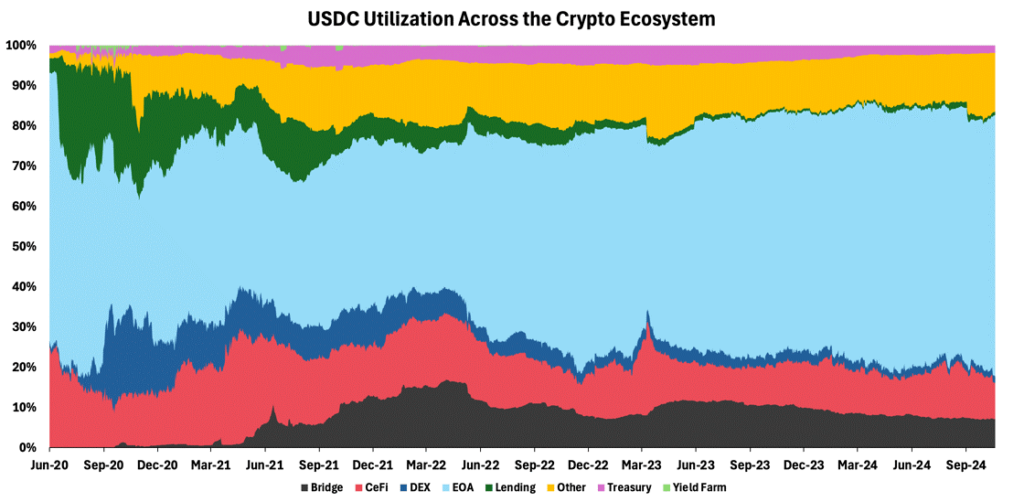
Source: Dune, 21Shares
USDT shows an even stronger trend, with 70% in EOAs and 25% in CeFi platforms, as depicted below. USDT is more popular, as Tether is quicker to deploy to lesser-known blockchains and integrate with a broader swath of centralized platforms.
Figure 4 – USDT Utilization Across the Crypto Ecosystem
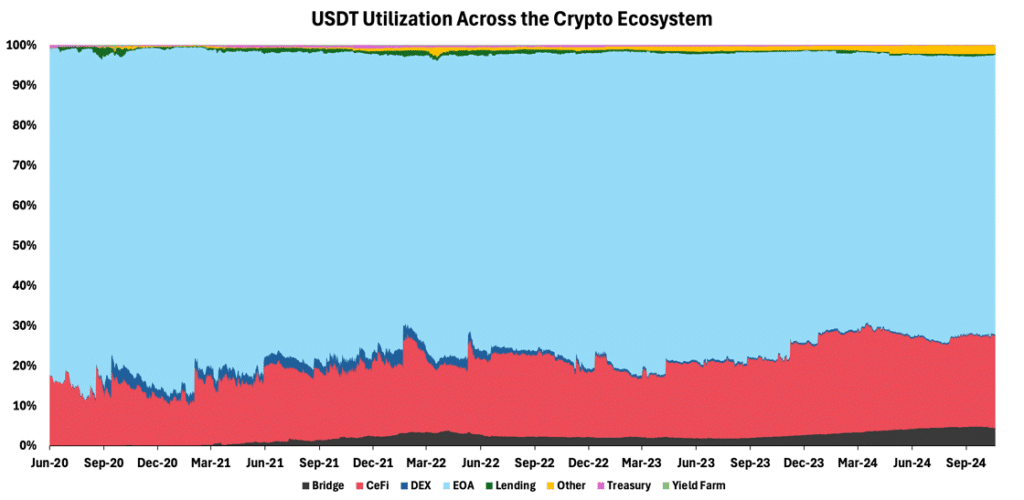
Source: Dune, 21Shares
This distribution underscores stablecoins’ key value: providing stability. EOAs (non-custodial wallets like Metamask and Phantom) often serve as havens where users convert crypto to stable assets. CeFi platforms, including major exchanges like Binance and Coinbase, offer similar conversion options but also facilitate cross-border transactions. This is particularly relevant as they support USDT’s widespread presence on various networks, particularly Tron, which makes it a preferred choice for users in emerging economies across Latin America and Africa. This highlights stablecoins’ dual role in both investment preservation and global financial accessibility.
- DeFi
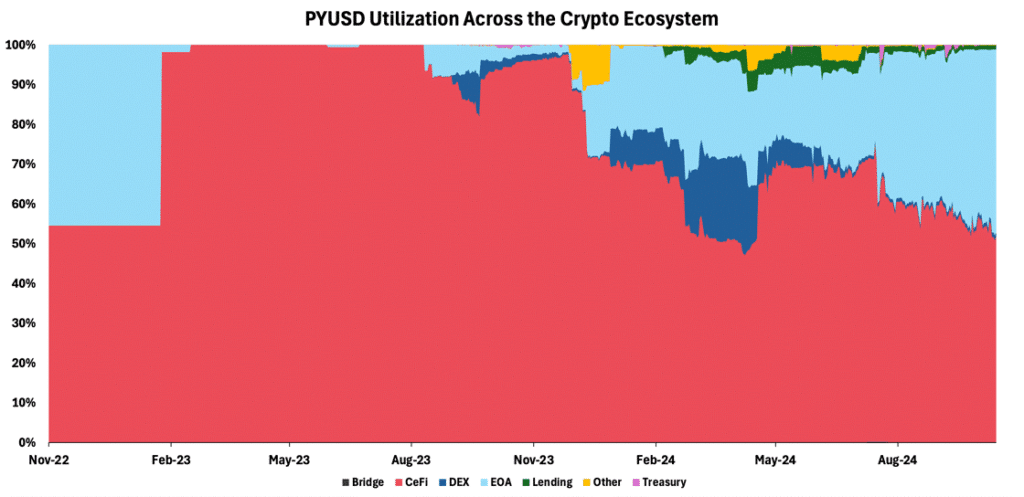
Fiat-collateralized stablecoins, like those from Circle and Tether, often have a limited presence in DeFi compared to decentralized alternatives such as Aave’s GHO or Maker’s DAI. This difference stems from the latter’s incentive strategies, which typically involve distributing native protocol tokens (e.g., AAVE or MKR) to boost adoption. PayPal’s PYUSD, however, stands out as an exception among centralized stablecoins.
In its push into the Solana ecosystem, PayPal partnered with Kamino Finance, offering yields of up to 17% annually on PYUSD deposits—significantly higher than competitors like USDC’s 9% on Solana. This approach initially proved successful, driving PYUSD’s market cap to nearly $1B, with almost 20% of its value distributed across decentralized exchanges (DEXs) as users leveraged it to generate yield by providing liquidity. Yet, when these incentives scaled back, the stablecoin’s market cap declined by almost 40% from the peak in August, highlighting the critical role of yield-driven strategies in shaping the adoption of stablecoin beyond the incumbents.
Figure 5 – PYUSD Utilization Across Crypto Ecosystem
Source: Dune, 21Shares
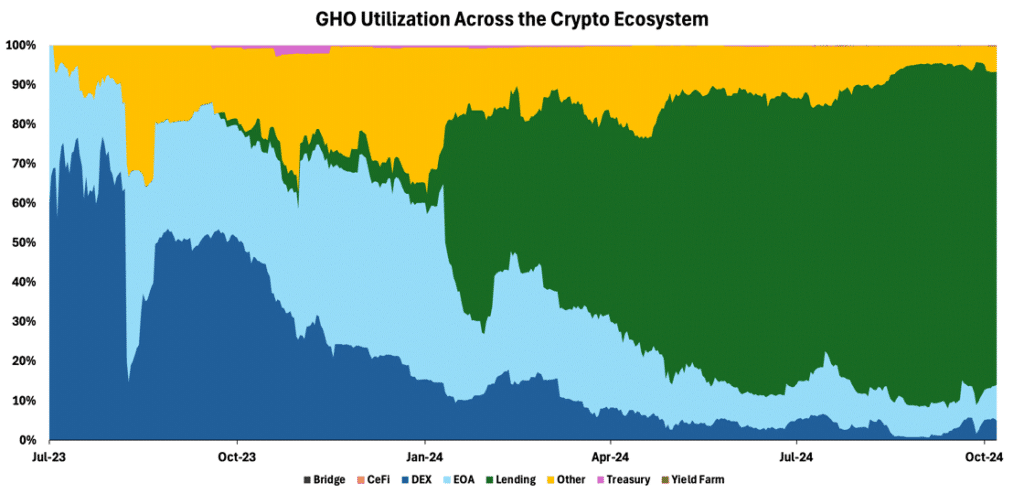
Similarly, GHO, Aave’s over-collateralized stablecoin, gained significant traction in DeFi, largely due to Aave’s strategic incentive structure. Notably, about 80% of GHO’s supply is utilized in lending, with another 5% distributed across DEXs. This distribution aligns with Aave’s strategy to position GHO at the core of its lending market, reinforcing the stablecoin’s role in the broader DeFi ecosystem and driving its adoption.
Figure 6 – GHO Utilization Across Crypto Ecosystem
Source: Dune, 21Shares
To recap, stablecoins’ general utilization makes up about 25% of DeFi, including DEXs, lending, and other types of financial engagement activities, as shown in Figure 7 below.
Figure 7 – Stablecoin Transaction Volume Classified by Type of Financial Activity
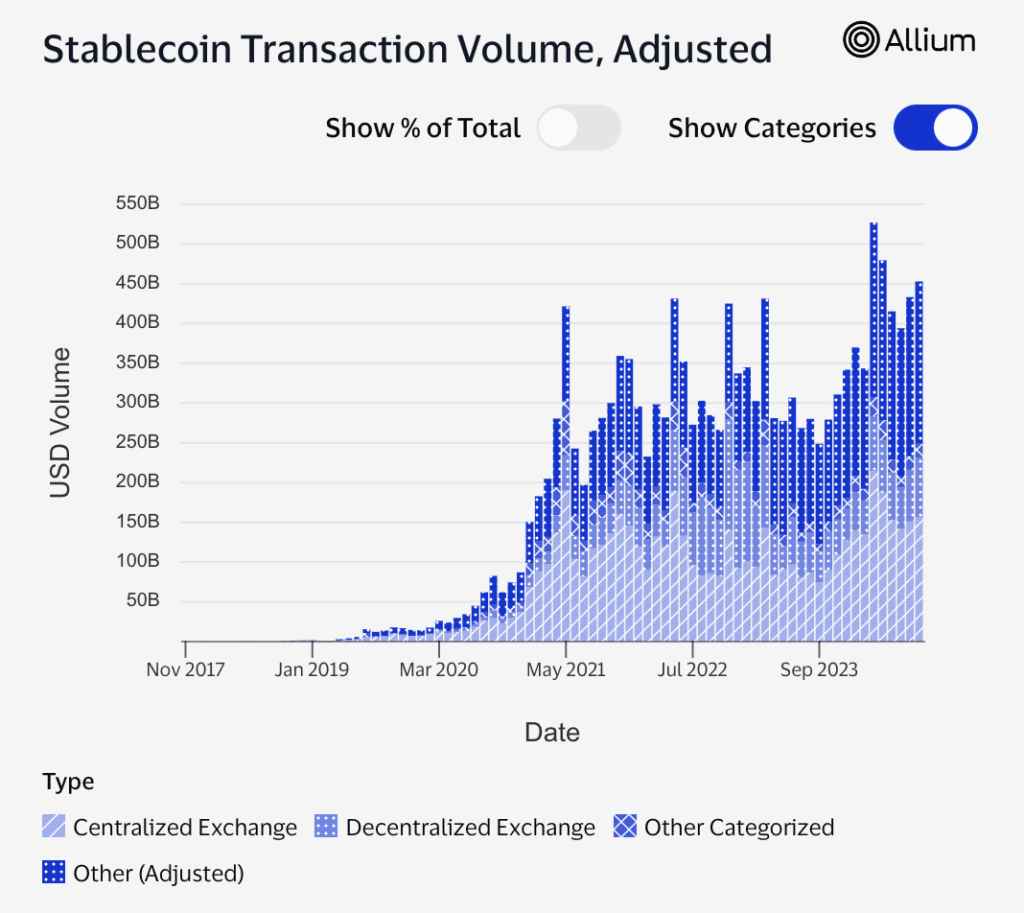
Source: Visa
- Remittance and Payments
As seen below, stablecoins offer a compelling cost advantage for cross-border payments compared to traditional international money transfer services, which charge an average of 6% per transaction.
Figure 8 – Average Remittance Cost by Funding Instrument (% of Transfer)
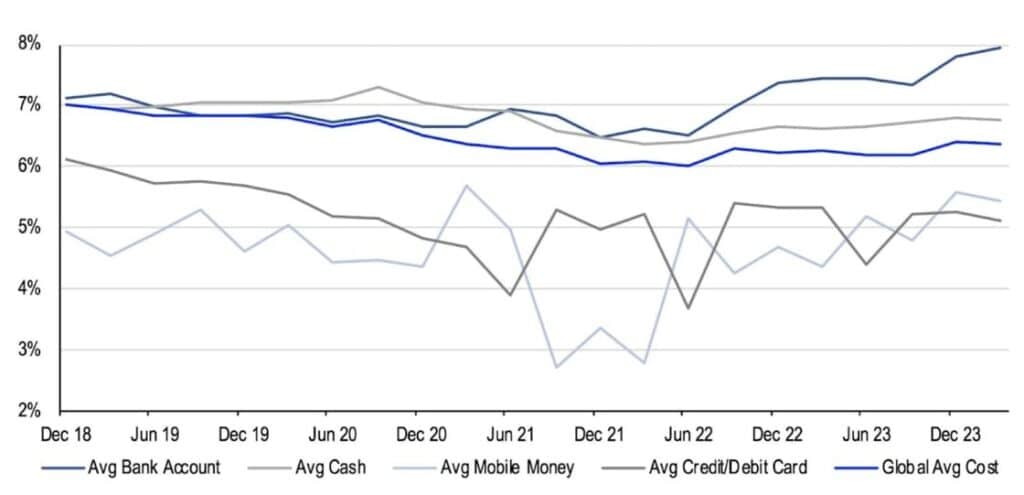
Source: Bloomberg, The World Bank and Coinbase
Transaction fees across blockchain networks vary significantly, ranging from fractions of a cent to several dollars—scalable blockchains like Solana, Fantom, Polygon, and TON offer average fees below one cent. In contrast, older-generation networks such as BNB, Tron, and Ethereum can incur fees from 10 cents to three dollars, as shown in Figure 9. However, Ethereum’s ecosystem has evolved with the introduction of Layer 2 solutions. Platforms like Base, Arbitrum, and Optimism, operating atop Ethereum, have now drastically reduced transaction costs to less than a cent, especially after the Dencun upgrade. This development has significantly enhanced Ethereum’s user cost efficiency.
Figure 9 – Average Transaction Fee of Leading Layer-1 Blockchains
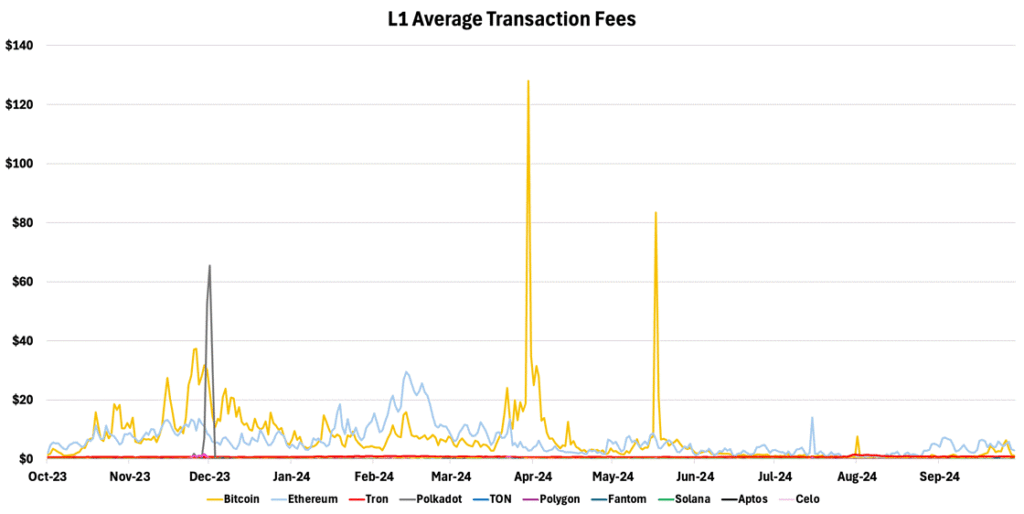
Source: TokenTerminal, 21Shares
As seen, even with higher costs on networks like Ethereum, crypto transactions remain significantly cheaper than traditional payment systems. This cost-effectiveness is reflected in the unfazed growth of stablecoin usage, which has persisted through crypto’s cyclical nature over the past four years. Despite experiencing a bull market from Q3 2020 to late 2021, followed by a bear market from 2022 to Q3 2023, the number of stablecoin senders has continued to rise unabated. Remarkably, monthly stablecoin senders have surged by nearly 600%, as shown below, from approximately 2.3M in October 2020 to 12M today, underscoring the enduring appeal and utility of stablecoins beyond the confines of the crypto ecosystem.
Figure 10 – Monthly Number of Users Sending Stablecoins
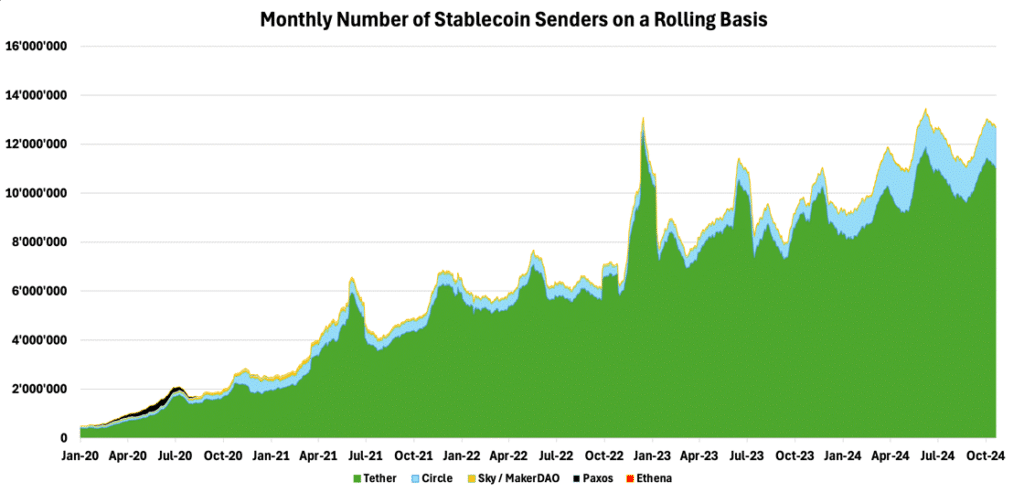
Source: TokenTerminal, 21Shares
The evolving use of stablecoins is also evident in developing economies. A survey of 2,541 adults across Brazil, India, Indonesia, Nigeria, and Turkey, shows that 47% use stablecoins for better savings rates, 43% for improved currency conversion, and 37% to access dollars. Though limited in scope, this data suggests stablecoins are becoming versatile financial tools in emerging markets, addressing a range of economic needs beyond traditional crypto applications.
Figure 11 – Survey Inquiring “What are your primary goals when using stablecoins?”
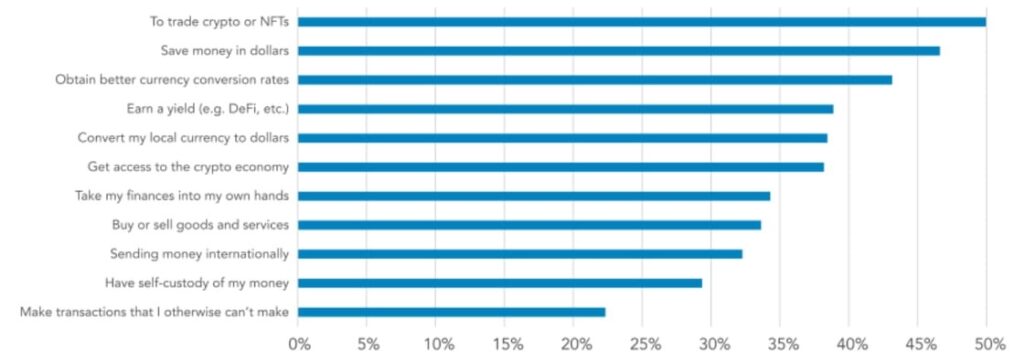
Source: CastleIsland
Stablecoins’ Impact
Tether’s effect on the crypto ecosystem is substantial, with nearly 60M users onboarded, as illustrated in Figure 12. This figure represents over 27% of the industry’s total active user base of 220M – underscoring stablecoins significant role in driving crypto’s adoption.
Figure 12 – Total Amount of Stablecoin Holders
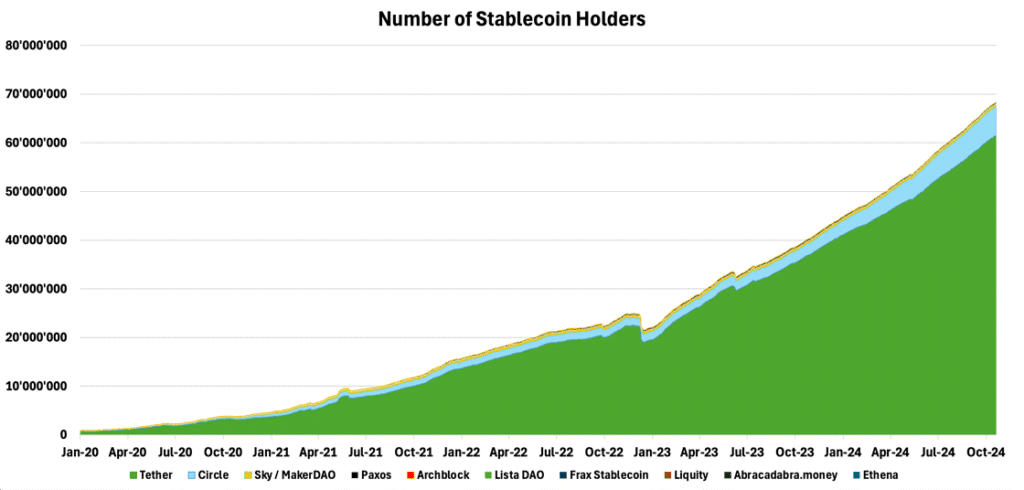
Source: TokenTerminal, 21Shares
USDT is particularly proving to be a crucial driver of network activity. With their current high usage rates, USDT alone paid over $7M in fees across its deployed blockchains on October 21 alone. This substantial fee contribution underscores the vital role stablecoins play in driving the growth of blockchain ecosystems.
In fact, USDT ranks as the third highest gas consumer on Ethereum over the past month, contributing over 5% (2.31K ETH) of the network’s total fees (40.27K ETH), highlighting stablecoins’ vital role in driving the network’s economic activity. On Tron, USDT accounted for 96% of network activity last week. This level of fee generation directly supports network security by compensating validators, underscoring stablecoins’ significant economic impact on blockchain networks.
Figure 13 – Daily Amount of Gas Fees by Stablecoin Issuer
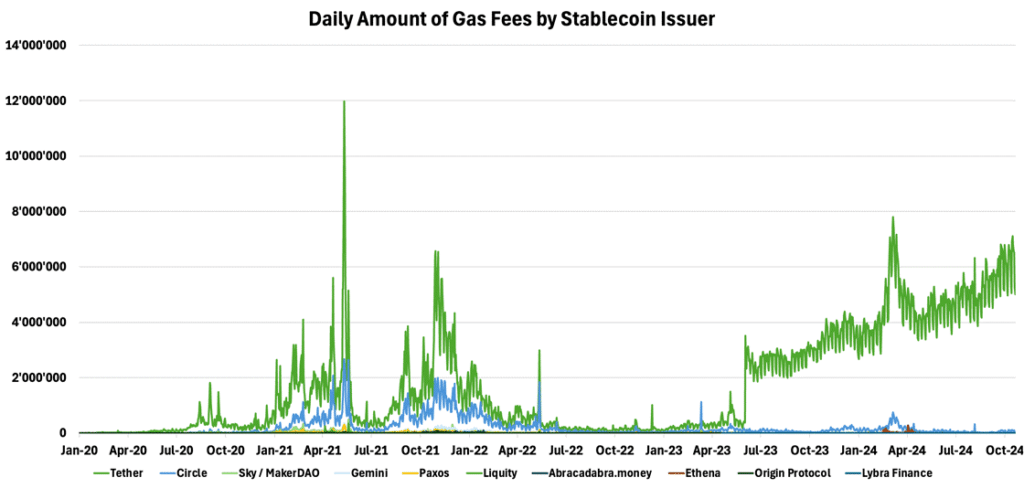
Source: TokenTerminal, 21Shares
The Regulatory Landscape of Stablecoins
Stablecoin issuers are the 18th largest holder of U.S. debt, surpassing Germany and South Korea. As they become more widely adopted, their role could expand to include significant uses like purchasing national debt, further integrating them into the financial system. This growing influence highlights the need for clear regulations such as the Clarity for Payment Stablecoins and the Lummis-Gillibrand Payment Stablecoin Act, introduced last year to ensure security and trust in this evolving sector. As regulatory clarity is prolonged in the U.S., coupled with geopolitics and macro factors, the dominance of dollar-denominated stablecoins could start being overshadowed by inevitable worldwide adoption.
• Europe’s Markets in Crypto Assets (MiCA) Regulation is entering full force on December 30, 2024. The gradual enactment of MiCA started with its “Stablecoin Regime”, which went into effect in July, providing much-needed clarity over stablecoins. Issuers must have a MiCA license for publicly offering or trading asset-referenced tokens or e-money tokens within the European Union, without a transitional period. These restrictions on centralized issuers could lead stablecoins like USDT to be delisted from EU exchanges if Tether does not meet compliance by December 2024. Additionally, to protect its future monetary sovereignty, MiCA mandated some limits on the use of stablecoins pegged to foreign currencies, where issuance has to cease when the daily usage “as a means of exchange within a single currency area is higher than 1M transactions and €200M.”
• Thailand’s oldest bank is launching the island’s first stablecoin: Siam Commercial Bank (SCB), just partnered with fintech company Lightnet to launch Thailand’s first stablecoin for cross-border payments and remittances.
• The UAE’s Central Bank has granted in-principle approval to AED Stablecoin under its Payment Token Service Regulation framework. If fully approved, AED Stablecoin’s AE Coin could serve as a local trading pair for cryptocurrencies in exchanges and decentralized platforms while allowing merchants to accept it for goods and services. This regulatory development comes a few months after Tether announced its plans to launch an AED stablecoin, “creating an optionality towards the U.S. dollar,” as Tether’s CEO said at the time of the announcement.
Risks and Challenges
• Centralization: Fiat-backed stablecoins like USDT and USDC are issued by centralized entities, requiring users to trust custodians to maintain proper reserves. This centralization introduces counterparty risk, where inadequate collateralization could lead to liquidity issues that could ice users out. Additionally, centralization brings vulnerabilities such as regulatory intervention, mismanagement, or freezing of funds.
• Transparency: Essential for maintaining trust in fiat-backed stablecoins, as issuers hold their reserves off-chain, backed by cash or cash equivalents. To address this, issuers like Tether and Circle conduct regular audits, providing documentation of their reserves, as with Tether’s transparency reports, to ensure confidence in their solvency. Transparency is less of an issue for crypto-backed stablecoins since all assets are verifiable on-chain. These protocols often provide dashboards, such as MakerDAO’s DAI Stats Dashboard, which detail collateralization rates, total debt, collateral types, and loan stability.
• De-pegging events: When a stablecoin’s value significantly deviates from its intended peg. The most infamous de-pegging event involved the collapse of UST and LUNA in May 2022, which revealed severe risks tied to algorithmic stablecoins. As mentioned earlier, please check out our breakdown of this event here.
While stablecoins still experience de-pegs from time to time—they become more stable, as shown in Figure 14. This increased stability is driven by a growing influx of liquidity, a reflection of the industry’s maturation, and more battle-tested protocols. Stablecoins are now better equipped to withstand liquidity shocks, thanks to the large reserves built up by issuers or thriving on-chain communities that drive governance.
Figure 14 – Price Stability of Major Stablecoins
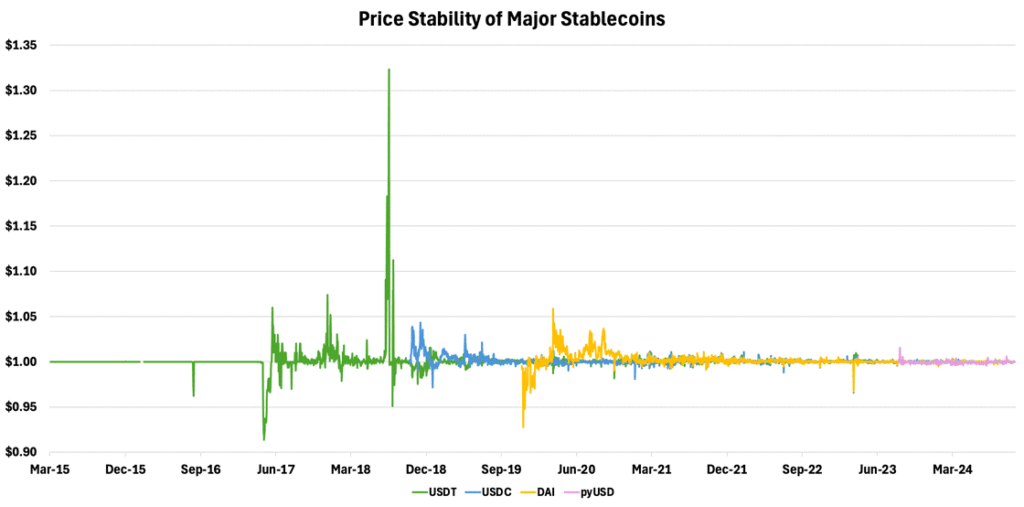
Source: Artemis, 21Shares
Why Now, and Where Do We Go From Here?
We’ve dedicated this report to stablecoins as we believe it’s timely considering the declining central bank interest rates, which will lead investors to chase higher yields. This has already begun to materialize with the total amount of loans on one of crypto’s unsecured lending platforms reaching an all-time high, as illustrated below.
Figure 15 – Total Outstanding Loans Value on Maple Finance
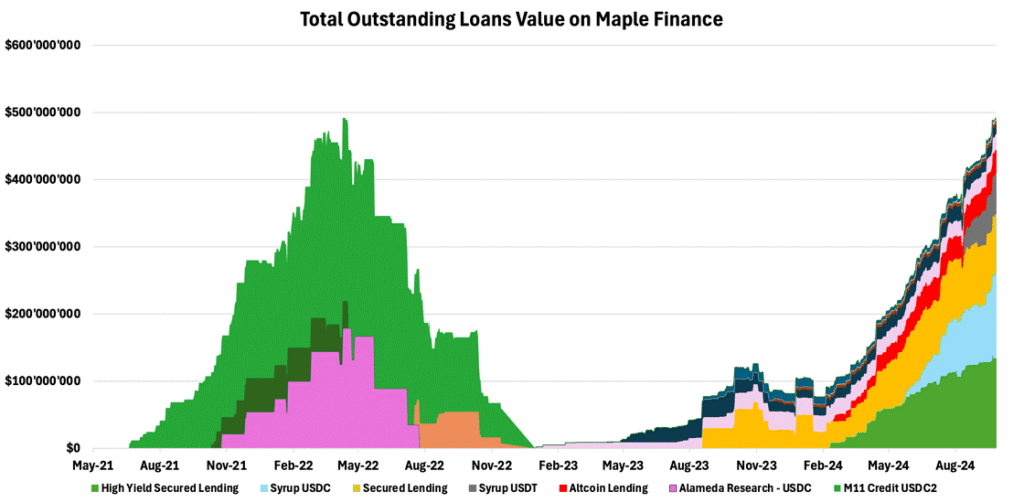
Source: Dune, 21Shares
That said, we believe the stablecoin market is poised for innovation, particularly in yield-generating models. The success of Ondo Finance’s USDY and Angle’s stEUR tokens, which utilize tokenized money market funds to provide daily dividends, is likely to inspire other issuers to adopt similar profit-sharing models. This trend aims to challenge established players like Tether and Circle, who currently retain profits from reinvesting user deposits into government securities. Emerging competitors are likely to leverage revenue-sharing mechanisms to capture market share, potentially reshaping the stablecoin ecosystem and offering users more lucrative alternatives such as Bitgo’s upcoming stablecoin. However, these innovative models may face regulatory scrutiny in the near term, as authorities work to establish clear frameworks that balance innovation with consumer protection and financial stability.
We also anticipate further innovation in delta-neutral strategies inspired by Ethena’s model. Despite unresolved issues around sustaining their strategy during market downturns, upcoming iterations will likely continue to leverage the maturing futures and options markets. The goal is to simplify these complex strategies, making them accessible to retail investors without requiring deep financial knowledge. This evolution aims to capitalize on the growing sophistication of crypto derivatives while democratizing access to advanced financial products.
Finally, we anticipate a potential shift in CBDC development. Central banks have varied motivations for exploring CBDCs, from enhancing financial inclusion to improving payment efficiency, but face complex design choices. Given the simplicity and proven effectiveness of fiat-backed stablecoins—which have facilitated nearly $35T in trading volume over the past decade—central banks may opt to integrate these solutions into traditional financial systems for now. As seen in Canada, Singapore, and the U.K., this pragmatic approach could serve as a temporary measure until consensus on optimal CBDC model designs is reached.
What’s happening this week?

Source: Forex Factory, 21Shares
Research Newsletter
Each week the 21Shares Research team will publish our data-driven insights into the crypto asset world through this newsletter. Please direct any comments, questions, and words of feedback to research@21shares.com
Disclaimer
The information provided does not constitute a prospectus or other offering material and does not contain or constitute an offer to sell or a solicitation of any offer to buy securities in any jurisdiction. Some of the information published herein may contain forward-looking statements. Readers are cautioned that any such forward-looking statements are not guarantees of future performance and involve risks and uncertainties and that actual results may differ materially from those in the forward-looking statements as a result of various factors. The information contained herein may not be considered as economic, legal, tax or other advice and users are cautioned to base investment decisions or other decisions solely on the content hereof.


Europeisk försvars-ETF når 10 miljoner dollar under den första noteringsveckan

Hur investerar jag i ETFer som fokuserar på breda vallgravar?

WELL ETF för den som tror på den globala IT-sektorn

Dogecoin, the meme that made it

VSUI ETN spårar priset på kryptovalutan SUI

Fonder som ger exponering mot försvarsindustrin
Crypto Market Risks & Opportunities: Insights on Bybit Hack, Bitcoin, and Institutional Adoption

Montrose storsatsning på ETFer fortsätter – lanserar Sveriges första globala ETF med hävstång

Warren Buffetts råd om vad man ska göra när börsen kraschar

Svenskarna har en ny favorit-ETF
-
 Nyheter4 veckor sedan
Fonder som ger exponering mot försvarsindustrin
-

 Nyheter3 veckor sedan
Crypto Market Risks & Opportunities: Insights on Bybit Hack, Bitcoin, and Institutional Adoption
-
 Nyheter2 veckor sedan
Montrose storsatsning på ETFer fortsätter – lanserar Sveriges första globala ETF med hävstång
-
 Nyheter4 veckor sedan
Warren Buffetts råd om vad man ska göra när börsen kraschar
-
 Nyheter3 veckor sedan
Svenskarna har en ny favorit-ETF
-

 Nyheter2 veckor sedan
MONTLEV, Sveriges första globala ETF med hävstång
-

 Nyheter4 veckor sedan
Fastställd utdelning i MONTDIV mars 2025
-

 Nyheter2 veckor sedan
Sju börshandlade fonder som investerar i försvarssektorn