
Nyheter
Special Report on the FTX Debacle
It was one of the most shocking weeks in crypto history. On November 2, CoinDesk leaked Alameda’s balance sheet, showing that $5.2 billion of the trading firm’s $14.6 billion of assets (36%) were held in FTT, a token issued by the now-bankrupt FTX crypto exchange.
In light of these revelations, Binance chose to sell a portion of FTT on its books, which spooked investors and prompted a bank run on FTX. By November 8, FTX had halted withdrawals, and the price of FTT had dropped more than 85% since the CoinDesk report came out. After failing to raise capital, on November 11, more than 130 entities tied to FTX.com, FTX US, and Alameda Research filed for bankruptcy, with the Alameda petition listing assets and liabilities of at least $10 billion each.
As of Monday’s close, Bitcoin and Ethereum are down by 19.42% and 20.85% week-over-week, respectively. In addition, among the top cryptoassets within the major categories, the most hurt is Solana, which declined by 52.82% over the same period. In this report, we will walk you through the events of the FTX debacle and what to expect in the coming weeks and months.
Figure 1: Weekly TVL and Price Performance of Major Crypto Categories
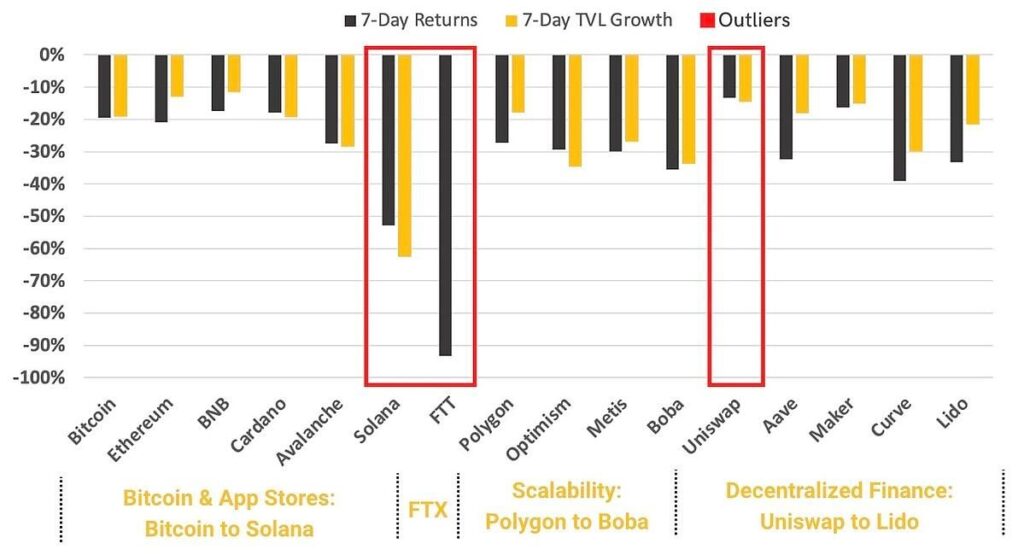
Source: Messari (Close Price) and DeFi Llama, Data as of November 14, 2022
Key takeaways
• More than $1.5 billion in liquidations between November 6-11.
• Ether’s net issuance since the Merge has turned negative.
• FTX US, FTX.com, and Alameda filed for bankruptcy with a multi-billion dollar hole in their balance sheets.
’
• Binance among a number of crypto exchanges to provide proof-of-reserves.
Spot and Derivatives Markets
Figure 2: Total liquidations (longs and shorts) over the past three months
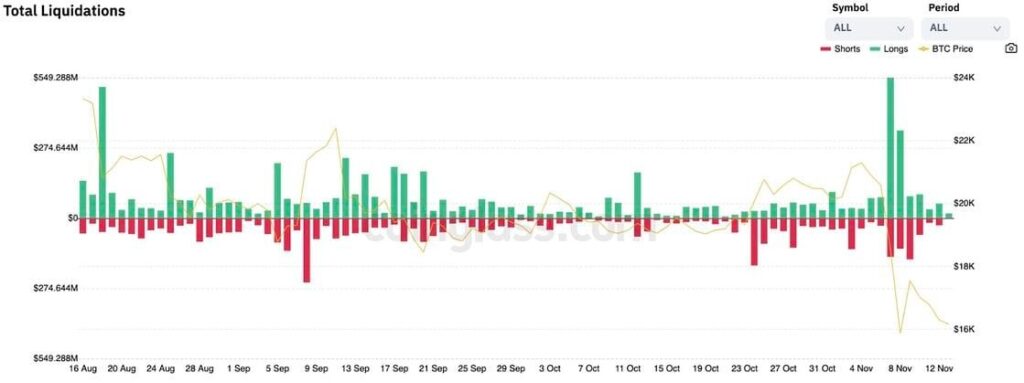
Source: Coinglass, Data as of November 13, 2022
If we look at the derivatives market, between November 6 and 11, we saw more than $1.5 billion of liquidations (primarily longs) as BTC’s price breached below $16,000 for the first time since November 2020. This event constituted the most significant long liquidations in recent months (see Figure 2), indicating that many investors were positioned to the upside amidst the FTX debacle.
On-chain Indicators
Figure 3: BTC percent supply in profit
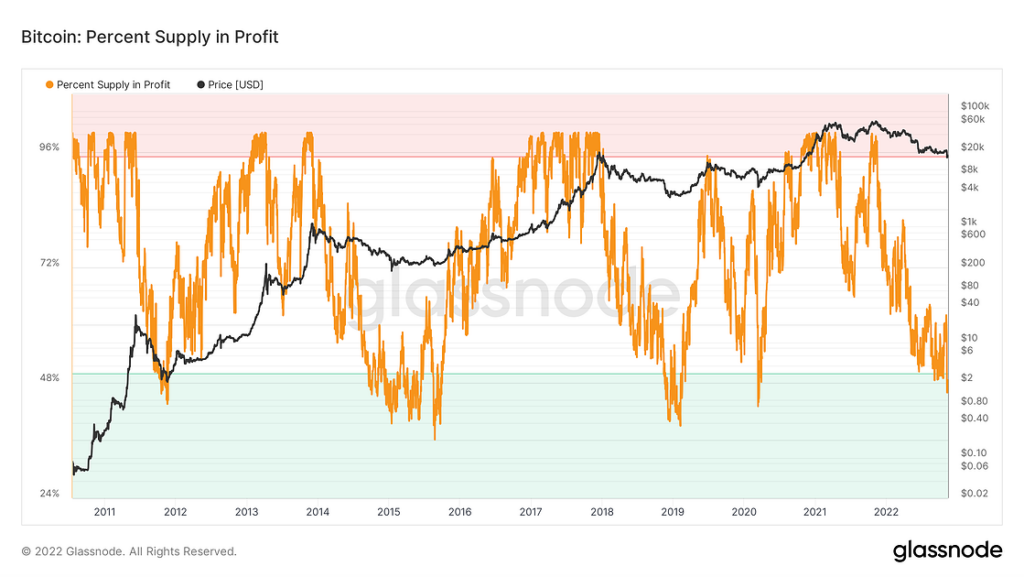
Source: Glassnode, Data as of November 13, 2022
Figure 3 highlights the percentage of the current BTC circulating supply in profit. This metric represents an oscillator that allows us to understand the current state of the market better. Historically, values above 95% have coincided with market tops, while values below 50% have preceded past cycles’ bottoms. On November 9, the BTC percent supply in profit reached 45.93%, the lowest level since March 2020.
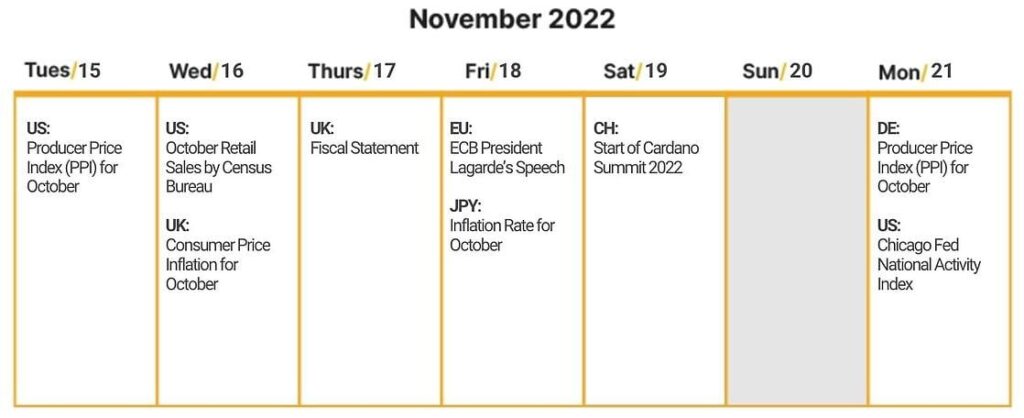
Next Week’s Calendar
Read our full report on the FTX debacle here
Research Newsletter
Each week the 21Shares Research team will publish our data-driven insights into the crypto asset world through this newsletter. Please direct any comments, questions, and words of feedback to research@21shares.com
Disclaimer
The information provided does not constitute a prospectus or other offering material and does not contain or constitute an offer to sell or a solicitation of any offer to buy securities in any jurisdiction. Some of the information published herein may contain forward-looking statements. Readers are cautioned that any such forward-looking statements are not guarantees of future performance and involve risks and uncertainties and that actual results may differ materially from those in the forward-looking statements as a result of various factors. The information contained herein may not be considered as economic, legal, tax or other advice and users are cautioned to base investment decisions or other decisions solely on the content hereof.


Nyheter
HANetf och Infrastructure Capital Advisors samarbetar för att lansera aktivt förvaltad preferensavkastnings-ETF i Europa


HANetf och Infrastructure Capital Advisors samarbetar för att lansera aktivt förvaltad preferensavkastnings-ETF i Europa

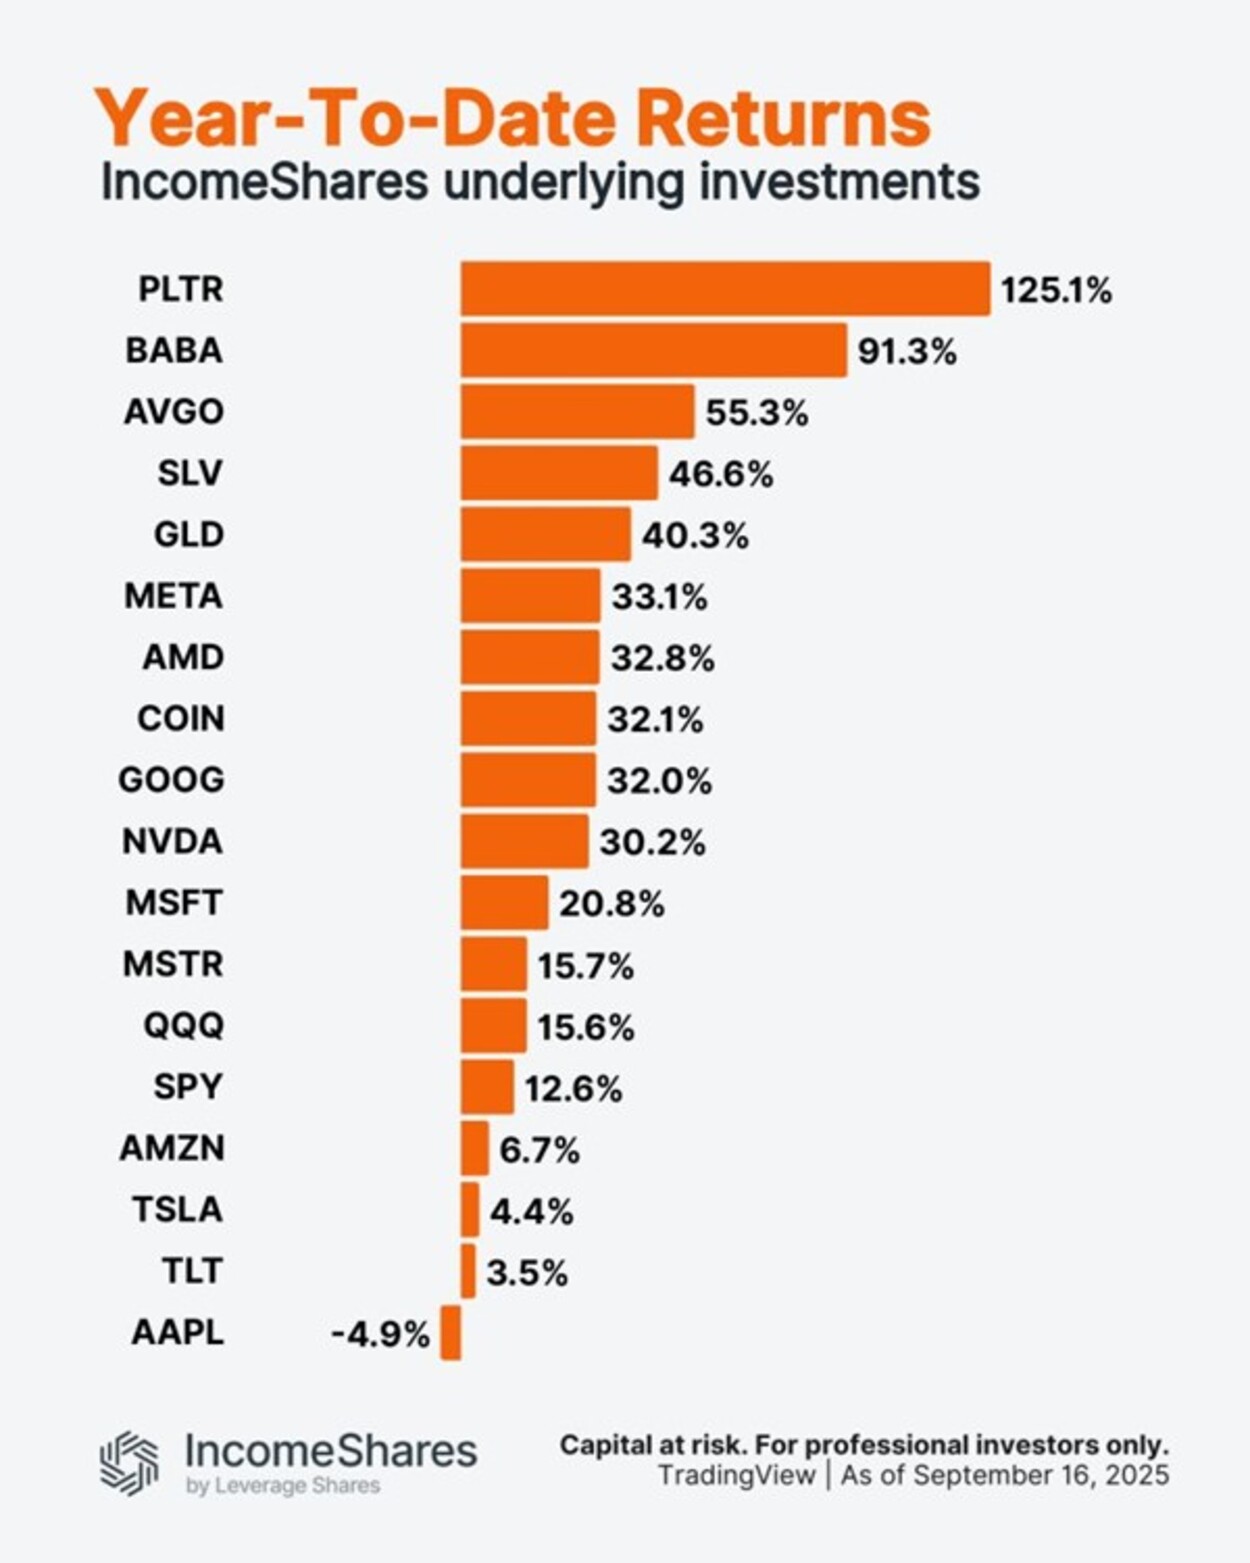
Palantir är upp 125 % i år. Apple är ner 5 %.

Utforska framtiden för AI och DeFi

ONCC ETP spårar den schweiziska dagslåneräntan

HANetf kommenterar kopparuppgången

Utdelningar och försvarsfonder lockade i augusti

Månadsutdelande ETFer uppdaterad med IncomeShares produkter

HANetfs analyserar hur ett fredsavtal kan påverka det europeiska försvaret

ADLT ETF investerar bara i riktigt långa amerikanska statsobligationer

Septembers utdelning i XACT Norden Högutdelande
-
 Nyheter3 veckor sedan
Utdelningar och försvarsfonder lockade i augusti
-
 Nyheter4 veckor sedan
Månadsutdelande ETFer uppdaterad med IncomeShares produkter
-
 Nyheter4 veckor sedan
HANetfs analyserar hur ett fredsavtal kan påverka det europeiska försvaret
-
 Nyheter4 veckor sedan
ADLT ETF investerar bara i riktigt långa amerikanska statsobligationer
-
 Nyheter2 veckor sedan
Septembers utdelning i XACT Norden Högutdelande
-

 Nyheter3 veckor sedan
Fastställd utdelning i MONTDIV augusti 2025
-

 Nyheter2 veckor sedan
HANetf kommenterar mötet mellan Kina, Ryssland och Nordkorea vid militärparad
-

 Nyheter4 veckor sedan
AICT ETF investerar i obligationer utgivna av företag från tillväxtmarknader