
Nyheter
Santa Claus Rally – Santa Arrives Early & Stays Late

Brooke Thackray, CFP, CIM, Research Analyst, Horizons ETFs Management (Canada) Inc.
Every year, investors wait for Santa Claus to come to town. They often get rewarded, but many leave with small returns because they focus on the shorter Santa Claus Rally strategy that many investment pundits have traditionally defined as the two or three days before and after Christmas. However, the best way to get the gift of Christmas is to be in the stock market earlier than the start date of the traditional Santa Claus Rally strategy and stay in the stock market later. The extended Santa Claus Rally strategy, “Santa Arrives Early & Stays Late” takes advantage of the stock market’s tendency to perform well from December 15th to January 6th. This seasonal trend has been persistent over time (Exhibit 1)

The positive performance of the strategy is mainly driven by the tendency of investors to push up the price of stocks in the second half of December, once negative pressures from tax-loss selling have abated. Investors tend to sell losing stock positions towards the year-end in order to offset any capital gains that have been generated during the year. Most of the tax-loss selling takes place in the first half of the December, creating an ideal seasonal opportunity to enter into the stock market in the second half of the month.
In addition, the stock market also tends to rally during the days after Christmas and into the beginning of January, as it benefits from the end-of-month effect of positive money flows in the last few days of the month and the first few days of the next month. This tends to be the best time of the month to be invested in the stock market: and at the end of the year there is an extra benefit with the stock market getting a boost from money managers locking in their positions for the year ahead.
The Santa Arrives Early & Stays Late strategy starts on December 15th and ends January 6th. This Christmas strategy using the S&P 500® from 1950 to 2014 has, on average, produced a gain of 2.0% and has been positive 78% of the time. Considering that the strategy has averaged only 15 trading days, it has produced very strong results (Exhibit 2).

The Santa Arrives Early and Stays Late strategy has even better results using the Nasdaq than with the S&P 500®. From December 15th to January 6th, during the period from 1971 to 2014, the Nasdaq has produced an average gain of 3.0% and has been positive 77% of the time.
This compares to the S&P 500® over the same time period which has produced an average gain of 2.3% and has been positive 77% of the time. The icing on the Christmas cake is that over the same time period, the Nasdaq has outperformed the S&P 500® 70% of the time.
The good news for Canadian investors is that, historically, Santa has been generous to the S&P/TSX Composite. From December 15th to January 6th, during the period from 1971 to 2014, the S&P/TSX Composite has produced an average gain of 2.7%, has been positive 82% of the time and outperformed the S&P 500® 61% of the time.

Technically, the S&P 500® is poised to perform well during the period of the Santa Arrives Early & Stays Late strategy, as it is currently in a trading channel between support and resistance (Exhibit 3). The target level for the S&P 500® is the May high of 2131. Although the Santa Arrives Early & Stays Late strategy does not work every year, it has a strong track record of success. If investors are looking for a short term opportunity to finish the year, it is a strategy worth considering.
Horizons ETFs is a member of Mirae Asset Global Investments. The investment manager has a direct interest in the management and performance fees of the Horizons Seasonal Rotation ETF (the “ETF”), and may, at any given time, have a direct or indirect interest in the ETF or its holdings.
Comments, charts and opinions offered in this report are produced by www.alphamountain.com and are for information purposes only. They should not be considered as advice to purchase or to sell men¬tioned securities. Any information offered in this report is believed to be accurate, but is not guaranteed. Brooke Thackray is a Research Analyst with Horizons ETFs Management (Canada) Inc. (“Horizons”). All of the views expressed herein are the personal views of the author and are not necessarily the views of Horizons, although any of the investments found herein may be reflected in positions or transactions in the various client portfolios managed by Horizons. Horizons has a direct interest in the management and performance fees of the Horizons Seasonal Rotation ETF (the “ETF”), and may, at any given time, have a direct or indirect interest in the ETF or its holdings. Commissions, trailing commissions, management fees and expenses all may be associated with an investment in the ETF which is managed by AlphaPro Management Inc. The ETF is not guaranteed, its values change frequently and past performance may not be repeated. The ETF may have exposure to leveraged investment techniques that magnify gains and losses and which may result in greater volatility in value and could be subject to aggressive investment risk and price volatility risk. Such risks are described in the ETFs prospectus. The prospectus contains important detailed information about the ETF. Please read the prospectus before investing.


Amid ongoing market volatility, gold has surged to a new record high above the $3,400 threshold, fueled by growing demand for safe-haven assets. With a YTD performance that places it as the top-performing major asset class, gold has benefitted from concerns over inflation, macro uncertainty, and a weakening US dollar. Investors have sought protection in stores of value, driving strong inflows into gold despite mixed equity performance and sluggish economic indicators. This shift reflects a broader trend that began in 2023, when both gold and bitcoin started showing strong price momentum amid rising global instability.
As digital assets continue to gain legitimacy in global finance, bitcoin increasingly stands alongside gold as a modern alternative store of value. Given gold’s significantly larger market cap, it’s reasonable to expect that fundamentals-driven triggers—such as the opening of the US institutional market and the establishment of a BTC strategic reserve—could have an even more pronounced impact on bitcoin’s price trajectory. With the same macro tailwinds now propelling gold, BTC may be poised for an outsized rally in the coming months as investors seek resilient, decentralized hedges against systemic risk.
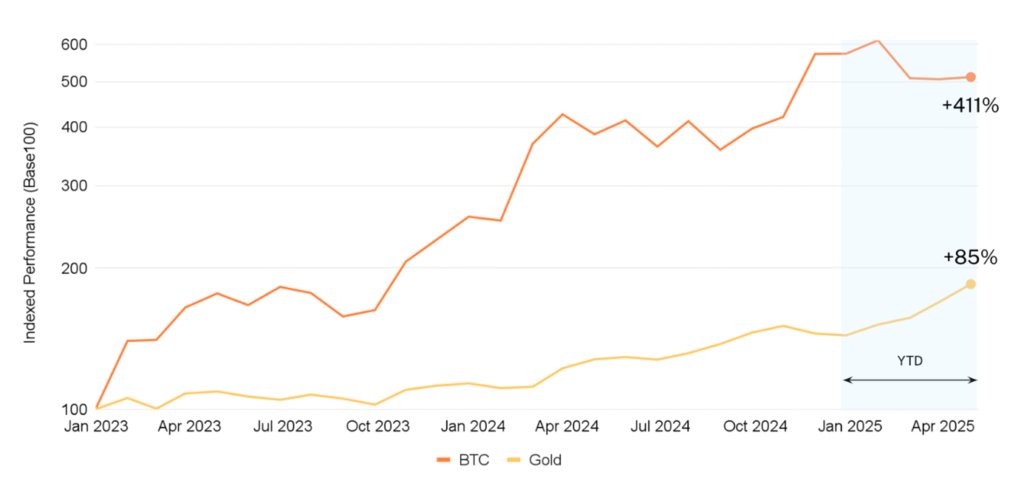
Source: Hashdex Research with data from CF Benchmarks and Bloomberg (from Dec 31, 2022, to April 20, 2025). The last price for bitcoin and gold is from April 20 as the month is not closed yet.
MARKET HIGHLIGHTS
Apr 14 2025 – Apr 20 2025
Powell signals easing of crypto rules for banks
• Federal Reserve Chair Jerome Powell signaled the potential easing of crypto-related regulations applicable to banks.
• Such a shift could facilitate greater institutional adoption of digital assets globally, as cryptocurrencies become more closely integrated into the traditional financial system of the world’s largest economy.
Arizona advances crypto reserve legislation
• Arizona’s Senate Bill 1373, which seeks to establish a state-managed digital asset reserve, has passed a House committee.
• This development positions Arizona as a leader in state-level crypto initiatives and may set a precedent for other states to follow.
Hyperliquid dominates on-chain perp market
• It was recently disclosed that the decentralized exchange Hyperliquid has captured 70% of the on-chain perpetual contracts market.
• This underscores the growing relevance of perpetual contracts for this protocol within DeFi and signals the emergence of another potential blue-chip in the digital assets space.
• The emergence of solid players in this niche could trigger a shift from centralized derivatives platforms to decentralized alternatives highlights the evolving landscape of crypto trading.
MARKET METRICS
The Nasdaq Crypto Index™
NCI™ constituents delivered mixed results last week. SOL (+6.9%) and LINK (+6.1%) stood out as top performers, while ADA lagged behind with a 3.3% decline—underperforming all other constituents. This divergence likely reflects a neutral macro backdrop, combined with token-specific catalysts, such as software company Janover (JVNR) purchasing $10.3 million of SOL as part of its Solana-focused digital asset treasury strategy.
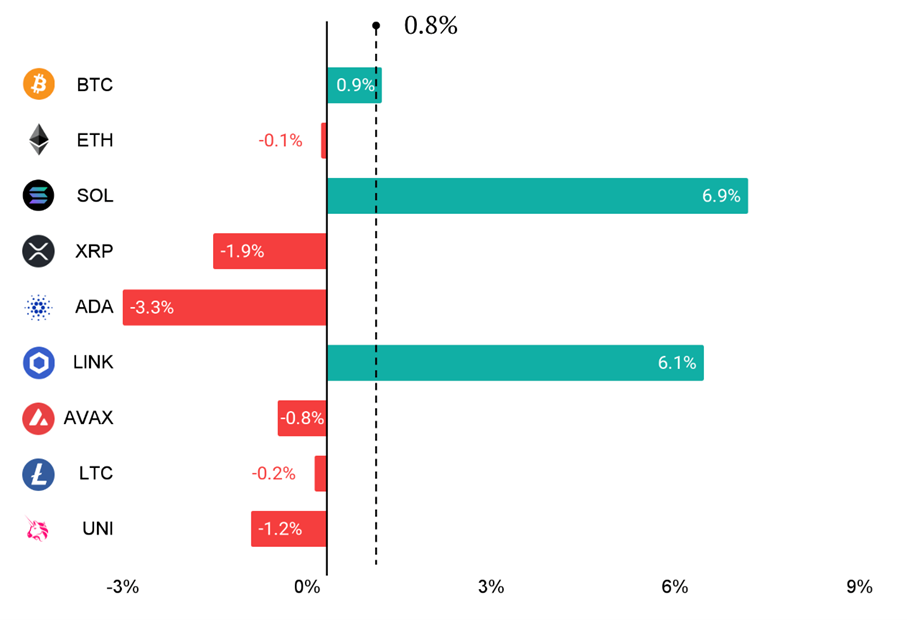
Source: Hashdex Research with data from Messari (from April 13, 2025 to April 20, 2025).
MARKET METRICS
The Nasdaq Crypto Index™
This week, the NCI™ had relatively flat performance, rising 0.8% and helping it close the gap with the Nasdaq 100 and S&P 500, which saw declines of 2.3% and 1.5%, respectively. The standout performer, however, was gold — the top-performing asset class of the year — which surged 4.7%, reaching a new record high above $3,400 amid rising global uncertainty. Gold’s strong performance may signal that other store-of-value assets, such as bitcoin, could see upward momentum soon, as it continues to lag behind gold YTD.
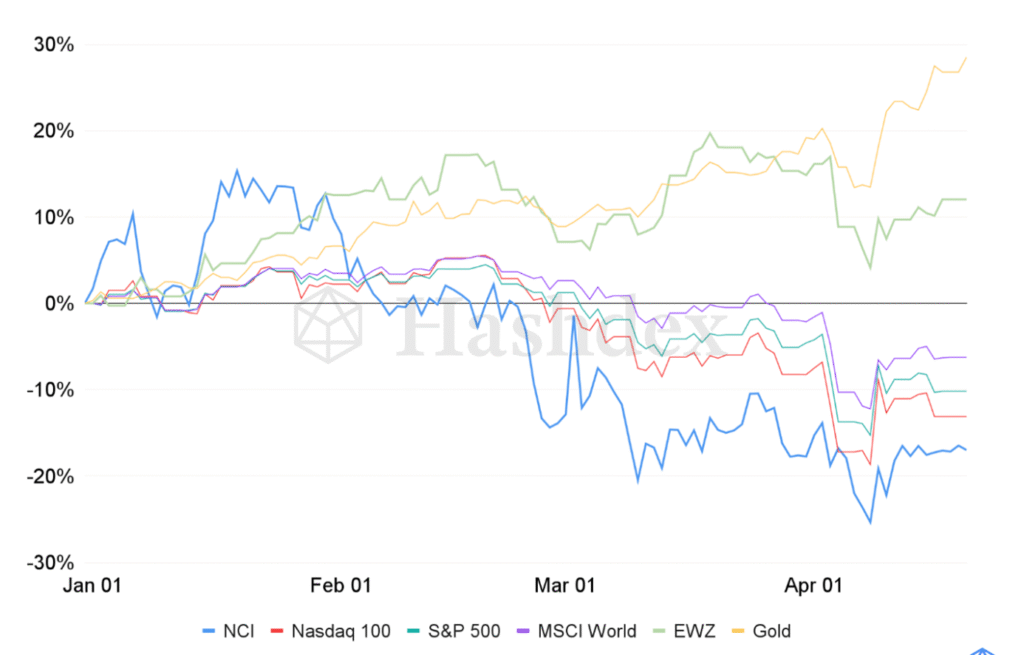
Source: Hashdex Research with data from CF Benchmarks and Bloomberg (from December 31, 2024 to April 20, 2025).
MARKET METRICS
Indices tracked by Hashdex
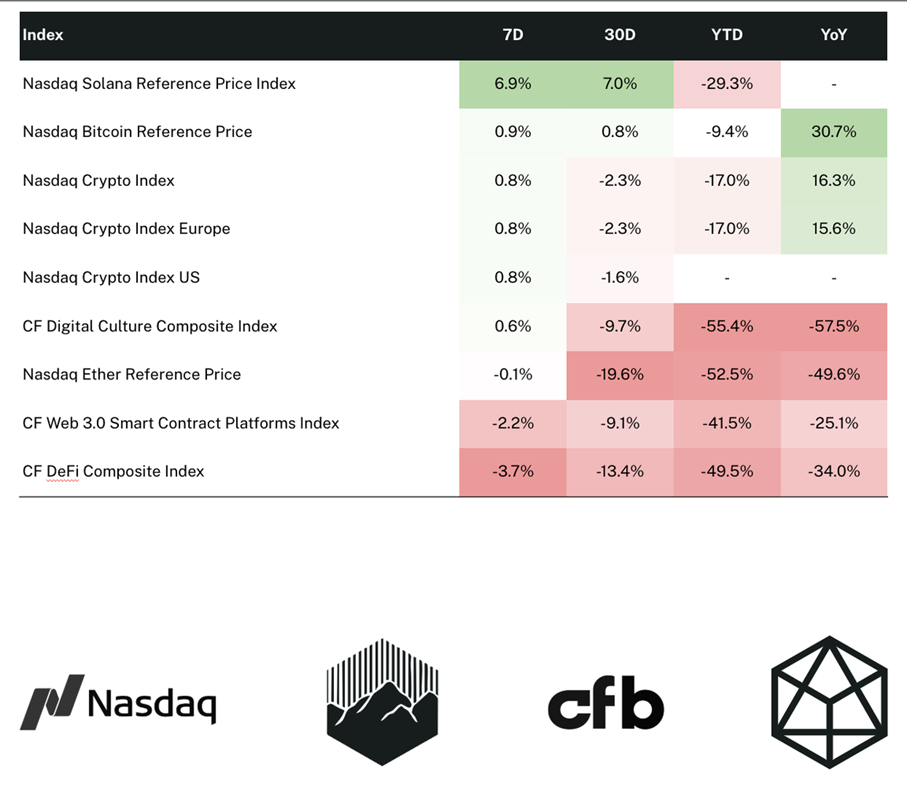
Source: Hashdex Research with data from CF Benchmarks and Vinter (from April 20, 2024 to April 20, 2025).


Gold’s rally may signal what’s ahead for BTC

HANetfs kommenterar guldpriset som når nya rekordnivåer

BE27 ETF bara företagsobligationer med förfall 2027

Bitcoin in the eye of the storm: A market shaped by two forces

SAWG ETF är en globalfond valutasäkrad i GBP

Fonder som ger exponering mot försvarsindustrin
Crypto Market Risks & Opportunities: Insights on Bybit Hack, Bitcoin, and Institutional Adoption

Montrose storsatsning på ETFer fortsätter – lanserar Sveriges första globala ETF med hävstång

Warren Buffetts råd om vad man ska göra när börsen kraschar

Svenskarna har en ny favorit-ETF
-
 Nyheter4 veckor sedan
Fonder som ger exponering mot försvarsindustrin
-

 Nyheter3 veckor sedan
Crypto Market Risks & Opportunities: Insights on Bybit Hack, Bitcoin, and Institutional Adoption
-
 Nyheter3 veckor sedan
Montrose storsatsning på ETFer fortsätter – lanserar Sveriges första globala ETF med hävstång
-
 Nyheter4 veckor sedan
Warren Buffetts råd om vad man ska göra när börsen kraschar
-
 Nyheter3 veckor sedan
Svenskarna har en ny favorit-ETF
-

 Nyheter3 veckor sedan
MONTLEV, Sveriges första globala ETF med hävstång
-

 Nyheter4 veckor sedan
Fastställd utdelning i MONTDIV mars 2025
-

 Nyheter2 veckor sedan
Sju börshandlade fonder som investerar i försvarssektorn