
Nyheter
Så här går börsen i dag 20140912

Så här går börsen i dag 20140912 Denna analys kommer från Axiers analysarkiv och skrevs den 12/9-2014. Analyserna i arkivet är tillgängliga för Axiers betalande prenumeranter.
Våra OMX-analyser läggs ut regelbundet, oftast på fredag förmiddag, och kan fungera som ett av flera beslutsstöd för den som handlar med börshandlade fonder, ETFer, som följer Stockholmsbörsens index, till exempel XACT OMX eller SpotR, nedan finner Ni Så här går börsen i dag 20140912.
OMXS30
OMXS30 öppnade dagen uppåt men lyckades inte fortsätta upp utan vi fick istället se att index tappade mark och föll tillbaka. Det blev en stängning vid 1382.85, vilket innebar att index stängde ner med 0.33%.
Index var precis över den nivå vi hade för att säga att index kommer att fortsätta upp till minst 1416-1421. Kraften hos köpare uteblev dock utan försiktighet vad istället melodin som gällde.
Det kortsiktiga dagsmomentum är på nivåer där vi tidigare har sett att det har bildats bottnar. Det kortsiktiga intradaymomentum är på nivåer där vi tidigare har sett att det har bildats bottnar.
USA terminerna är just nu marginellt på plus där SP500 är +0.01%, Nasdaq +0.05% och Dow Jones +0.01%.
Stöd har index vid 1375-1377 samt 1370
Skulle index vända ner under 1361.78 är det en signal om att den positiva trenden har vänt och vi behöver se över det positiva scenariot.
Tidsmässigt har vi den 10-12 september och därefter den 18-19 september, +/- 1 dag.
McClellan Oscillator: fortsatte att falla tillbaka och är nu nere vid nivåer där det har bildat bottnar. Men det finns fortsatt utrymme att falla tillbaka mer. Men ju lägre nivåer desto större botten kommer det att bli.
McClellan Summations Index: pekar ned och säger att vi skall vara försiktiga med att ta köpsignaler med fulla positioner.
Spread (skillnad mellan Nasdaq 100 och S&P 500) positiv på både vecka och dag. Dagsbaserat och veckobaserat skall vi fortsätta med att vara på köpsidan
VIX i USA stängde på en lite lägre nivå och VIX är fortsatt på relativt höga nivåer och det vanliga är att vi ser att det kommer en rörelse ned och då får vi en rörelse upp på börsen.
Du kan få exponering mot OMXS30 med följande Mini Futures BEST:
Uppgång: B LONGOMX KG CBK med en hävstång på 8,8 och en finansieringsnivå på 1241,415 SEK
Nedgång: B SHRTOMX KC CBK med en hävstång på 8,6 och en finansieringsnivå på 1566,219 SEK
Läs mer om Mini Futures och Warranter på Commerzbanks hemsida
Slutsats: OMXS30 är fortfarande på nivåer där en uppgång mot 1416-1421 är det som bedöms som mest sannolik så länge vi inte ser att index faller under 1361.78.
Analytiker: Fredrik Jensen


Over the last decade, crypto has evolved from a niche movement led by cryptographers and anti-establishment thinkers into a financial ecosystem that peaked at nearly $4 trillion in market capitalization. Yet, despite this exponential growth, the crypto market remains uniquely vulnerable.
Figure 1 – Total Crypto Market Capitalization
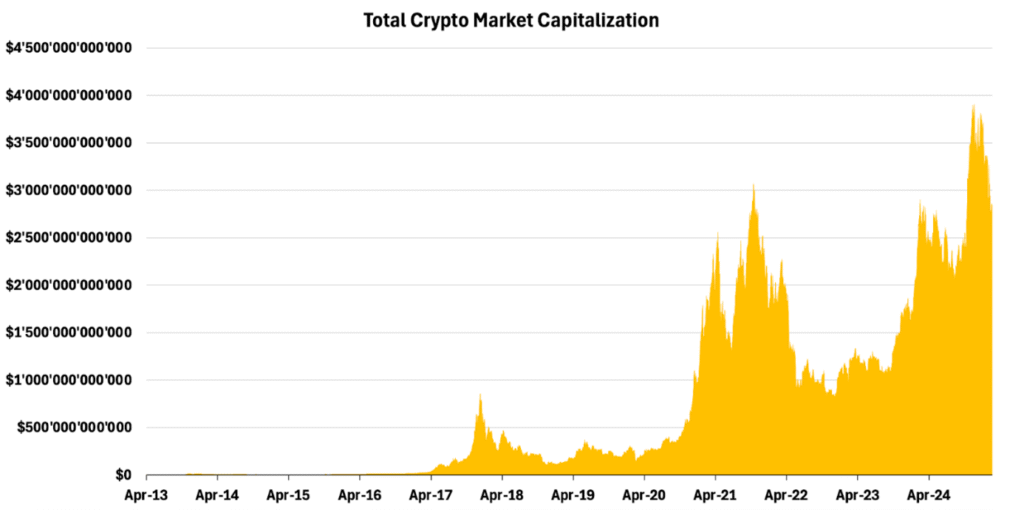
Source: 21Shares, Coingecko
Some market crashes stem from broader systemic turbulence, impacting equities and risk assets alike. Others are idiosyncratic black swan events, exposing vulnerabilities within the crypto industry itself. To assess Bitcoin’s resilience, we analyzed six key crises—evaluating price performance, investor sentiment, and on-chain fundamentals. Each event falls into one of the following categories:
Ultimately, we examine how each event reshaped the market and what it could indicate for Bitcoin’s trajectory today—following its 25% drawdown from the early 2025 peak and amid growing concerns over whether the bull market has truly run its course.
Key Findings: Lessons from the Past, Signals for the Future
To understand how Bitcoin has weathered past storms and what this means for the current market, let’s first review the key findings from our analysis of historical shocks. While no two market cycles are identical, historical patterns often rhyme. This analysis underscored five key insights that not only contextualize Bitcoin’s recent performance but also hint at what may lie ahead.
Bitcoin reacts differently to macroeconomic shocks vs. industry failures
• External systemic macro shocks often trigger sharp drawdowns but are typically followed by strong recoveries as conditions stabilize and fundamentals remain intact. In some cases, the shocks even reinforce the case for Bitcoin.
• Crypto-native idiosyncratic failures typically lead to deeper, more prolonged sell-offs due to shaken confidence and capital flight—but Bitcoin and the wider industry’s core value proposition survive these storms intact.
The perception of Bitcoin as a hedge against uncertainty is growing
• Bitcoin’s response to the SVB collapse signaled a shift in perception, behaving more like an asset detached from counterparty risk such as in traditional finance.
• In countries suffering from extreme currency depreciation, such as Argentina and Turkey, Bitcoin adoption continues to rise as individuals seek protection against inflation and monetary instability.
• Similarly, in regions with restricted access to traditional banking or financial censorship, Bitcoin proved its value as a borderless and censorship-resistant alternative.
Industry failures no longer shake faith in Bitcoin fundamentals
• Whereas exchange collapses once induced widespread doubt in Bitcoin itself, recent market behavior suggests investors are now able to separate centralized participant risk from the industry’s fundamentals.
o The swift recovery following the Bybit hack is a prime example: sentiment dipped—but did not collapse—showing the market’s growing sophistication.
2021 offers a comparable—but not identical—blueprint
The current drawdown shares structural similarities with the 2021 cycle, particularly in how a major external shock (then: China Ban, now: macro-policy disillusionment) preceded a healthy mid-cycle reset.
o Like 2021, we’re seeing price resilience, pre-peak distribution followed by reaccumulation, and signs of foundational support—not panic.
The setup for the rest of the year remains bullish
• On-chain signals (Accumulation Trend Score, LTH/STH ratios) suggest this is a consolidation phase—not a terminal top.
• Liquidity is rising again, with global M2 ticking upward and leading indicators pointing toward a potential boost in demand.
• Meanwhile, crypto-native tailwinds—including institutional ETF flows, regulatory clarity, and integration with traditional finance—add a second engine of momentum.
While further downside cannot be ruled out—particularly if Bitcoin retests the 200-day MA near $77,000—the broader picture remains constructive. Assuming no immediate black swan, we maintain our recently revised target of $138,555 by year-end representing a 64% upside from the current price of around $84,000.

With these insights in mind, let’s examine the current market dynamics in detail.
The Post-Election Reality: Bull Market or Topping Structure?
2024 began in a predominantly bullish state, fueled by the long-awaited approval of U.S. spot ETFs for Bitcoin. This structural shift cemented Bitcoin’s status as a commodity and introduced a new wave of demand, providing a strong tailwind for price appreciation.
Despite seasonal summer weakness and more than $16 billion in forced selling—including Mt. Gox repayments, German government liquidations, and other large distributions—Bitcoin remained resilient, ranging between $50,000 and $70,000. In previous cycles, such events triggered deep corrections, but this time, liquidity depth and sustained demand absorbed several supply shocks, signaling the market’s growing maturity.
The U.S. election results fueled a final leg of the rally, as expectations of a pro-crypto administration drove Bitcoin to a new all-time high of $109,000. Equities followed suit, as markets priced in a more market-friendly stance.
However, that optimism has begun to unwind. While several Executive Orders were signed—including one addressing the long-anticipated crypto strategic reserve—and other key regulatory steps have been taken, markets are left largely underwhelmed. At the same time, the looming return of trade protectionism reignited fears over global trade wars. These policy uncertainties—combined with escalating geopolitical tensions in Europe and signs of rising borrowing costs amid a potential economic downturn—have ultimately triggered a broad risk-off retracement.
Figure 2 – Bitcoin Performance in Last Year

Source: Coinmetrics, 21Shares
While the broader equity pullback appears to be a natural part of the market cycle—especially considering major indices haven’t experienced a drawdown greater than 10% since 2022—Bitcoin’s relative resilience stands out. All major indices, including the S&P 500, have turned red for the year, erasing their post-election gains. Meanwhile, high-growth tech stocks like Tesla (TSLA) have plunged over 30% in recent weeks. Bitcoin, by contrast, has held structurally higher levels—trading roughly $10,000 above its pre-election pricing, reinforcing the notion that Bitcoin is shedding its high-beta identity and is increasingly viewed as a distinct investment case–even in the face of macro uncertainty.
The market structure remains intact, with key support just below $80,000 holding firm—a sign that this may be a healthy mid-cycle reset rather than a full-blown reversal. The Fear & Greed Index supports this view. While sentiment has cooled, it hasn’t collapsed. The current dip mirrors past bull market corrections—such as the May 2021 China Ban—where temporary shakeouts gave way to renewed accumulation.
Figure 3 – Current Market Fear & Greed
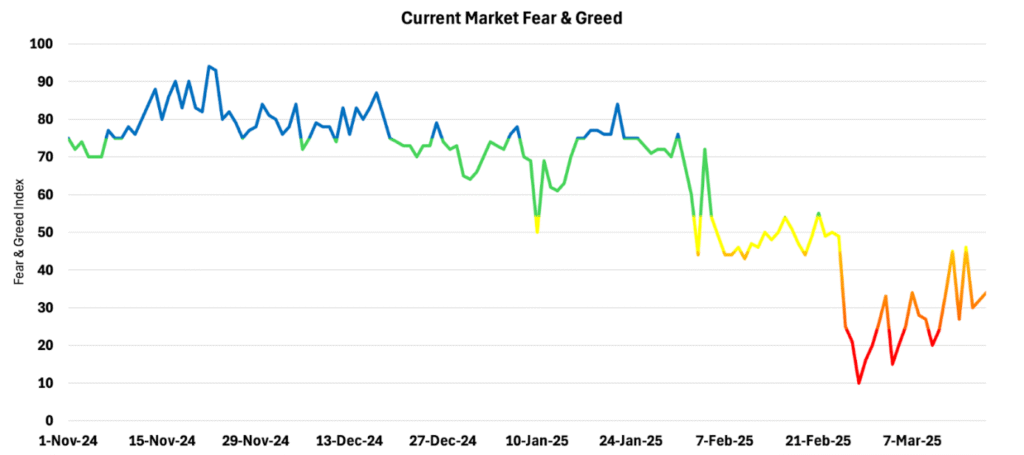
Source: Glassnode, 21Shares
Further evidence of the market’s maturity came in February during the Bybit hack—the largest cyber attack in internet history. While sentiment briefly dropped to its lowest point since the FTX collapse, it rebounded swiftly, highlighting the ongoing shift of investors increasingly being able to differentiate between failures in centralized infrastructure and the enduring value proposition of the broader ecosystem.
To better assess whether this recent correction signals deeper weakness or simply a mid-cycle reset, it’s worth zooming out to examine how drawdowns have historically unfolded across previous Bitcoin bull markets.
Significant corrections are not anomalies but a feature of Bitcoin’s cyclical nature. Take 2021, for example: the China Ban triggered a drawdown of more than 50%, yet Bitcoin rebounded to complete a double-top rally, ultimately reaching a new all-time high of $69,000. This pattern isn’t unique. Every major bull cycle has included retracements that cleared excess froth before setting the stage for higher highs.
More encouragingly, the severity of these drawdowns appears to be moderating over time. In earlier cycles, Bitcoin routinely saw larger declines. This shift reflects a less emotionally reactive market, where participants increasingly treat Bitcoin as a long-term allocation. As a result, sell-offs are being absorbed more efficiently. With more investors ready to step in at discounted levels, volatility is being dampened by growing liquidity depth and stronger hands.
Figure 4 – Bull Market Correction Drawdowns
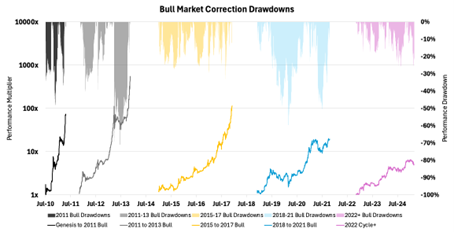
Source: Glassnode, 21Shares
As the industry matures, trade-offs become evident. While price appreciation may be less explosive than in past parabolic runs, both rallies and pullbacks are now more organic—driven by fundamentals and sustained conviction rather than speculative excess. Short-term sentiment may remain cautious in the absence of an immediate catalyst, but history suggests that such consolidations often act as a springboard for the next leg higher in structurally strong markets. If past cycles are any indication, this pullback is more likely a healthy reset than a definitive end to the bull market.
On-chain data also provides valuable insights into the recent correction. One of the most telling indicators is the Bitcoin Accumulation Trend Score, which tracks the buying and selling behavior of market participants. A score closer to 1 indicates strong accumulation by large holders or a broad segment of investors, while a score near 0 suggests distribution—signaling that participants are offloading their holdings.
Historically, Bitcoin bull market peaks have been characterized by strong accumulation at the top, immediately followed by a sharp reversal into distribution, marking definitive cycle tops. However, this cycle is unfolding differently. Instead of distribution occurring after the peak, it began pre-peak—a pattern also last observed during the 2021 China Ban event. In both cases, early distribution was driven by external shocks rather than pure market exhaustion, suggesting that sentiment shifted in response to specific events rather than a natural overheating of the market.
Figure 5 – Bitcoin Accumulation Trend Score
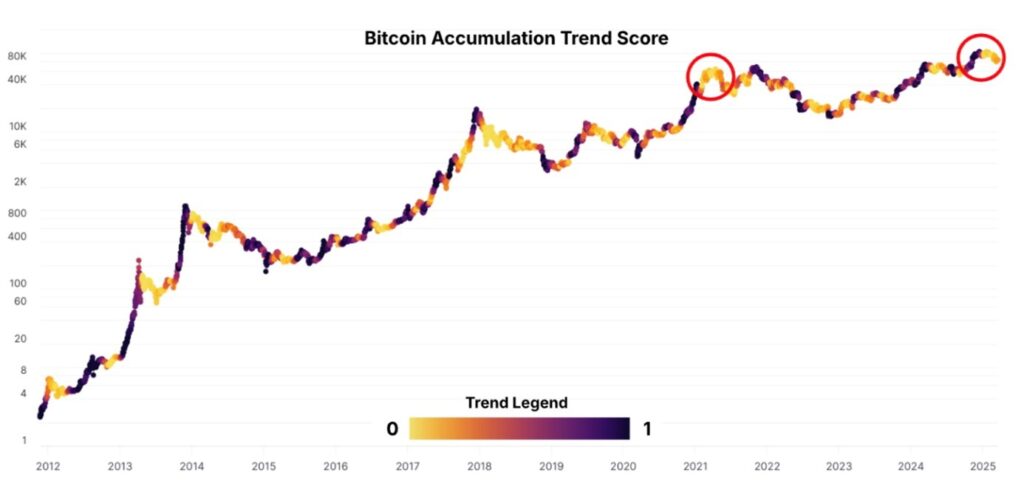
Source: Glassnode, 21Shares
This preemptive distribution often results in healthier corrections, rather than full-scale market breakdowns. Unlike euphoric tops—where aggressive selling triggered deep, cascading liquidations—this correction has been more measured. There’s been no extreme spike in fear or widespread capitulation, reinforcing the idea that the market structure remains ripe. While some investors took profits during the rally, a strong underlying bid for Bitcoin persists at levels the market now perceives as discounted. This steady absorption of dips has helped prevent sharp dislocations and will foster longer and more sustainable uptrends.
Notably, the Accumulation Trend Score now signals a transition away from heavy distribution, with accumulation and distribution entering a more balanced state. Hence, while short-term action may appear fragile, the foundations for a potential reversal are forming already.
Another key metric reinforcing this constructive outlook is the Long-Term Holder (LTH) to Short-Term Holder (STH) Supply Ratio—a measure of how much Bitcoin is held by seasoned investors (155+ days) compared to newer market entrants. Recently, this ratio reversed sharply, hitting its lowest mark since 2021.
Figure 6 – Bitcoin Price vs. Long-Term / Short-Term Holder Supply Ratio
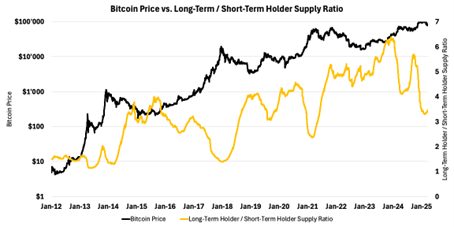
Source: Glassnode, 21Shares
Over the past year, a surge of short-term holders, fueled by crypto’s growing mainstream adoption, flooded the market. However, the bottom-out suggests that these hands have been recently shaken out, potentially setting the stage for long-term holders to regain dominance. Historically, they have played a critical role in fueling the next leg of sustained uptrends. If they begin accumulating at scale once again, it could serve as a powerful platform for recovery —especially if paired with more favorable macro conditions.
Figure 7 – Bitcoin Performance Multiplier vs. Global Money Supply
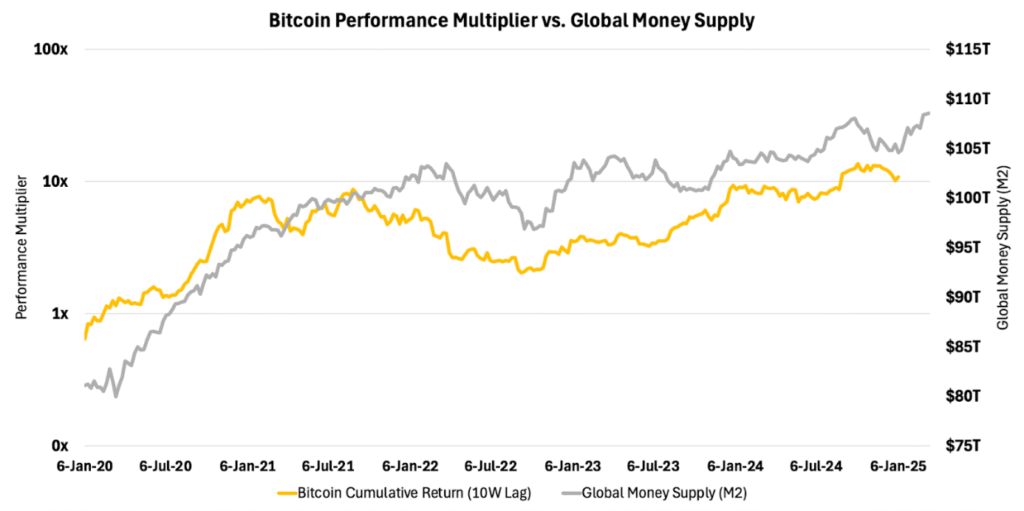
Source: Coinmetrics, BGeoMetrics, 21Shares
While Bitcoin’s price can be influenced by many factors, global liquidity remains a core driver, as previously mentioned. Historically, Bitcoin has shown a significantly strong relationship with global M2 money supply—more specifically when returns are offset by 10 weeks. This suggests that increases in global liquidity tend to filter into Bitcoin with a slight delay, making it a valuable leading indicator. Recent data shows global liquidity has been ticking higher over the past weeks, potentially setting the stage for a near-term boost in Bitcoin demand.
But this isn’t the full picture. Bitcoin and the industry’s outlook for the remainder of the year is supported by plenty of emerging crypto-specific catalysts—including additional ETF launches in the U.S., increasing regulatory clarity in key markets, and the accelerating integration of crypto infrastructure into traditional finance.
Even so, the macro backdrop remains murky—marked by persistent inflation, rising borrowing costs, and elevated geopolitical risk. Nevertheless, these headwinds merely delay a decisive breakout, as they haven’t derailed the broader setup, which still leans bullish. Bitcoin’s recent price resilience, robust market structure, and healthier holder behavior suggest this is more likely a consolidation phase than a cycle top, and it may only be a matter of time before macro clarity returns and unlocks the next leg higher.
COVID-19 Pandemic
The outbreak of COVID-19 in early 2020 triggered one of the most severe financial shocks in modern history. On March 11, 2020, the World Health Organization declared a global pandemic, sending markets into a tailspin. The S&P 500 and Dow Jones Industrial Average each lost 25% in a matter of days, while oil, real estate, and hospitality sectors saw drawdowns exceeding 70%.
Figure 8 – COVID-19 Performance
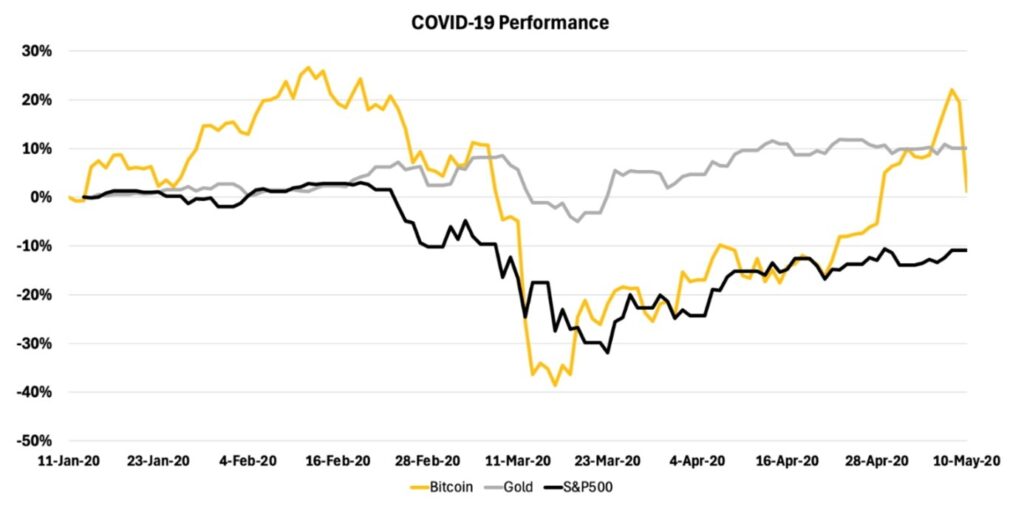
Source: Bloomberg, Coinmetrics, 21Shares
Bitcoin, widely perceived as a risk asset, was not spared. Within a week, BTC plunged 35%, as investors scrambled to de-risk and raise cash. The Fear & Greed Index, which measures investor sentiment, collapsed into extreme fear, reflecting peak market panic as capital fled higher-volatility assets.
Figure 9 – COVID-19 Fear & Greed
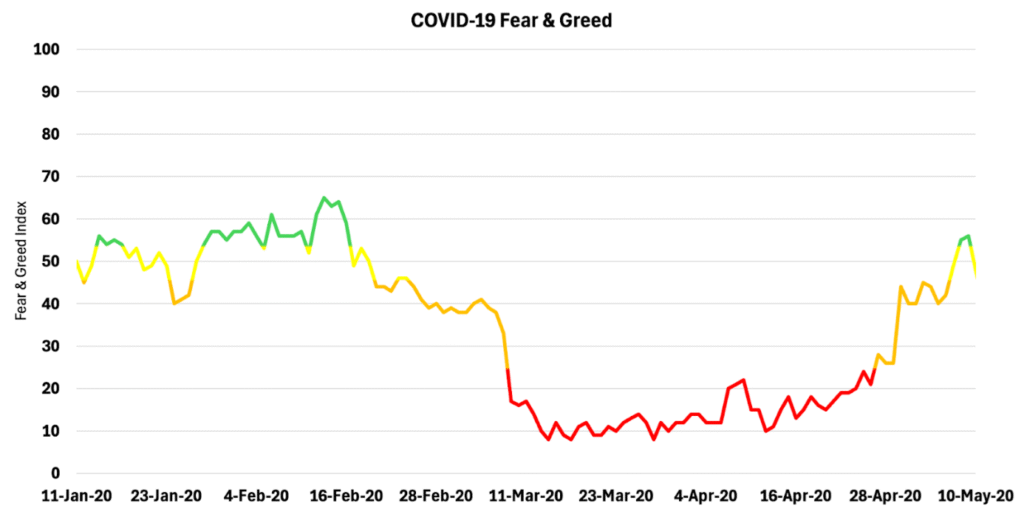
Source: Glassnode, 21Shares
However, unlike industry-specific crises—such as exchange collapses or failures of overly centralized protocols—which can undermine confidence in the crypto economy itself, COVID-19 was a broader macroeconomic shock. This meant that despite the extreme volatility, Bitcoin’s fundamental thesis remained intact. As a result, sentiment rebounded relatively quickly.
Initially, Bitcoin mirrored equities, experiencing sharp initial drawdowns. However, as central banks responded with unprecedented stimulus measures—including interest rate cuts, balance sheet expansion, and direct stimulus payments—liquidity flooded the system, triggering a rapid shift in risk sentiment. Nevertheless, while equities remained relatively volatile, Bitcoin rebounded faster.
A potential driver of Bitcoin’s outperformance may be the behavior of long-term holders, who capitalized on the post-crash environment to accumulate at scale. Notably, this coincided with a surge in global liquidity, suggesting that investors increasingly viewed Bitcoin as an asymmetric opportunity. At times, long-term holders absorbed over $1M BTC per week, closely mirroring the growth in global money supply, which expanded from $81T in March 2020 to over $90T by September 2020.
Figure 10 – Bitcoin Long-Term Holder Supply Change vs. Global Money Supply
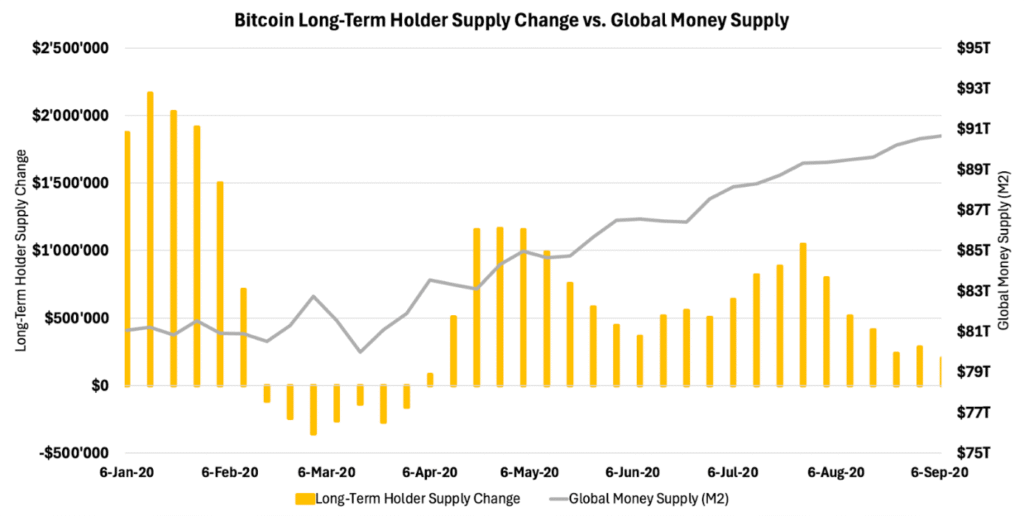
Source: Glassnode, BGeometrics, 21Shares
However, this wasn’t just a short-term rally fueled by cheap liquidity—it marked a pivotal moment in Bitcoin’s evolution. With concerns mounting over the long-term consequences of excessive monetary expansion, Bitcoin increasingly emerged as a hedge against fiat erosion, bolstered by its provable scarcity. Individuals who had previously dismissed Bitcoin as a speculative asset began to recognize its potential as an emerging store of value, gradually accelerating its shift from a risk-on asset to a macro hedge. This shift is particularly evident in emerging markets, where local currencies have suffered severe depreciation. Countries like Turkey (19.3%), Argentina (18.9%), and Thailand (17.6%) exhibit some of the highest Bitcoin adoption rates, as individuals seek alternatives to protect their wealth from inflation. With inflationary pressures intensifying in these regions, Bitcoin’s appeal has become increasingly pronounced. Rather than derailing the market, this shock brought both a lesson in Bitcoin fundamentals and set off the accumulation phase, propelling Bitcoin into the 2021 bull run.
The China Bitcoin Ban
By early 2021, Bitcoin was in full bull mode. Retail enthusiasm was fueled, and the market just set a new all-time high just shy of $64,000. But on May 21, 2021, the Chinese government unleashed its most aggressive crackdown on the industry yet—banning financial institutions from providing crypto services and forcing domestic Bitcoin miners to shut down. Unlike macro-driven crashes—where Bitcoin was collateral damage in a broader market meltdown—this was a direct hit to the ecosystem itself.
Figure 11 – China Bitcoin Ban Performance
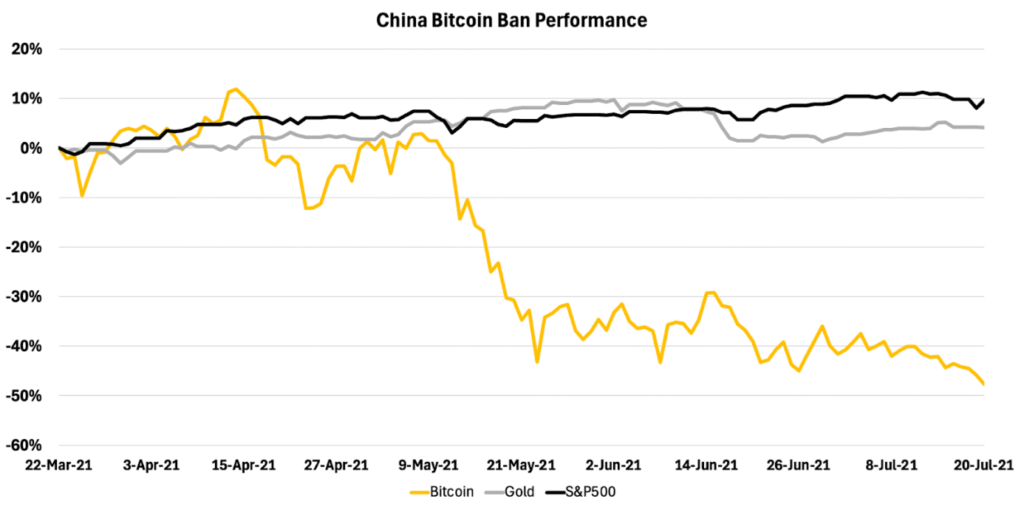
Source: Bloomberg, Coinmetrics, 21Shares
Fear spread rapidly. Bitcoin tumbled into a 50% drawdown from its cycle peak. The Fear & Greed Index, which had been in extreme greed just months earlier, collapsed into extreme fear, reflecting the wave of uncertainty gripping the market. But price action wasn’t the only concern—larger existential questions loomed:
• Was Bitcoin’s network security at risk?
• Would the network survive the loss of such a massive portion of its infrastructure? With nearly half of its mining power gone, the network faced an unprecedented test.
Figure 12 – Bitcoin Mean Hash Rate
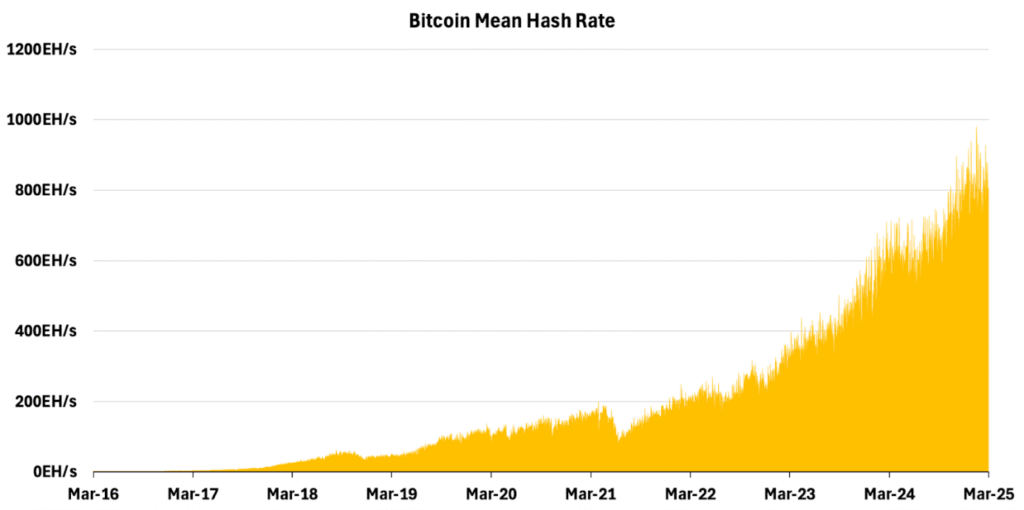
Source: Glassnode, 21Shares
Despite initial panic, Bitcoin’s core design remained intact. While the hash rate declined, this wasn’t an instantaneous collapse—Bitcoin’s censorship-resistant nature meant mining operations couldn’t be forcefully shut down overnight. Additionally, its difficulty adjustment mechanism—a critical feature embedded in the protocol—automatically recalibrated mining difficulty in response to the eventual hash rate drop, ensuring that transaction processing remained stable.
At the same time, miners wasted no time relocating. Faced with legal repercussions in China, they quickly sought new jurisdictions to continue operations. Within months, Bitcoin’s hash rate had fully recovered, as miners migrated to the U.S., Kazakhstan, and Canada—reinforcing Bitcoin’s resilience against localized regulatory crackdowns. This episode underscored a crucial reality: while governments can impose regional restrictions, they cannot shut down the network itself.
Figure 13 – China Bitcoin Ban Fear & Greed
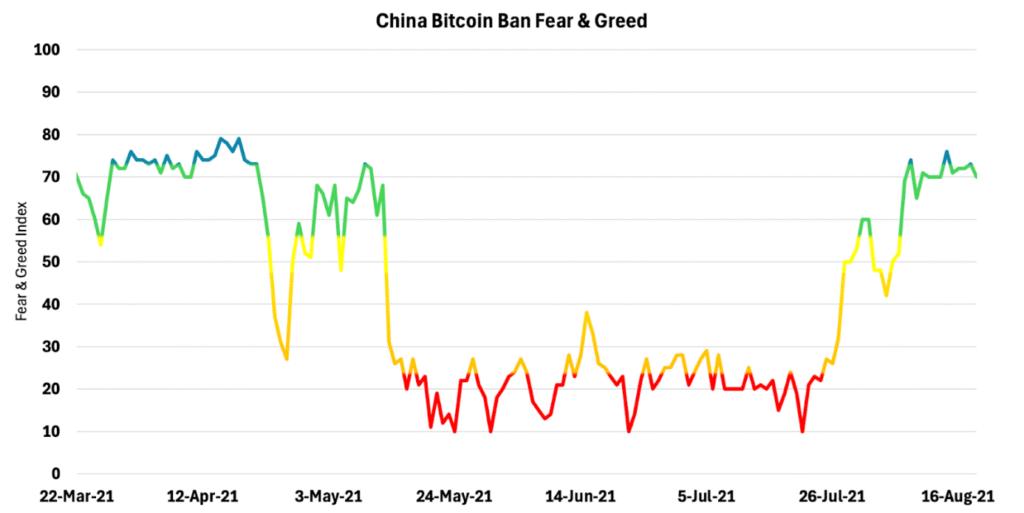
Source: Glassnode, 21Shares
Sentiment rebounded just as quickly as it had collapsed. By late July 2021, the Fear & Greed Index surged from extreme fear back into greed territory, as investors regained confidence in Bitcoin’s resilient network. Despite being one of the most severe shocks in Bitcoin’s history, the market absorbed the impact and continued its trajectory. Within a strong bullish cycle, Bitcoin recovered and went on to complete a double-top bull run, reaching a new all-time high of $69,000 by the end of 2021.
Figure 14 – Bitcoin Performance in 2021
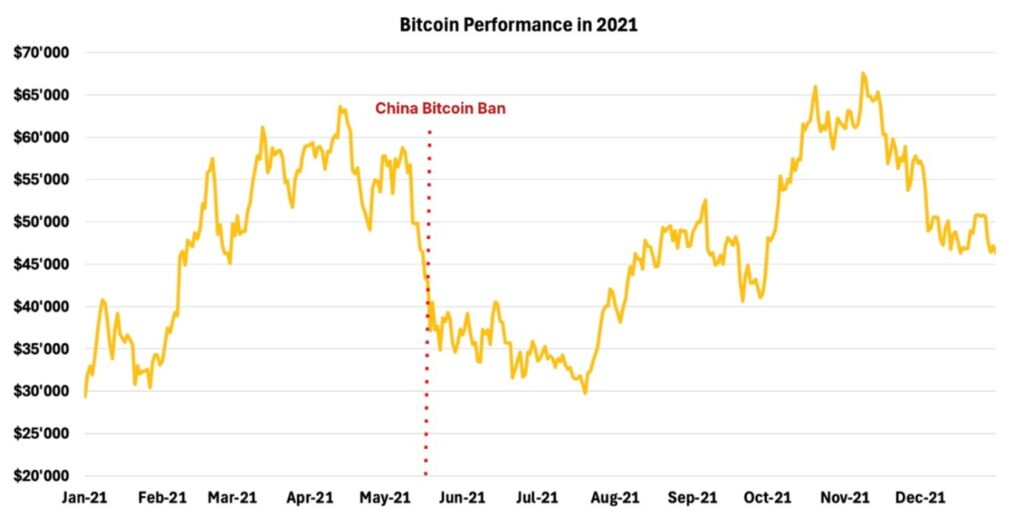
Source: Coinmetrics, 21Shares
2022: The Year of Unrelenting Shocks
The year 2022 was a perfect storm for Bitcoin and the broader crypto market. What began as a geopolitical crisis with Russia’s invasion of Ukraine in February quickly escalated into a cascading sequence of crypto-native black swan events, all compounded by the most aggressive U.S. Federal Reserve rate hiking cycle in decades.
Figure 15 – Russia-Ukraine Conflict Performance
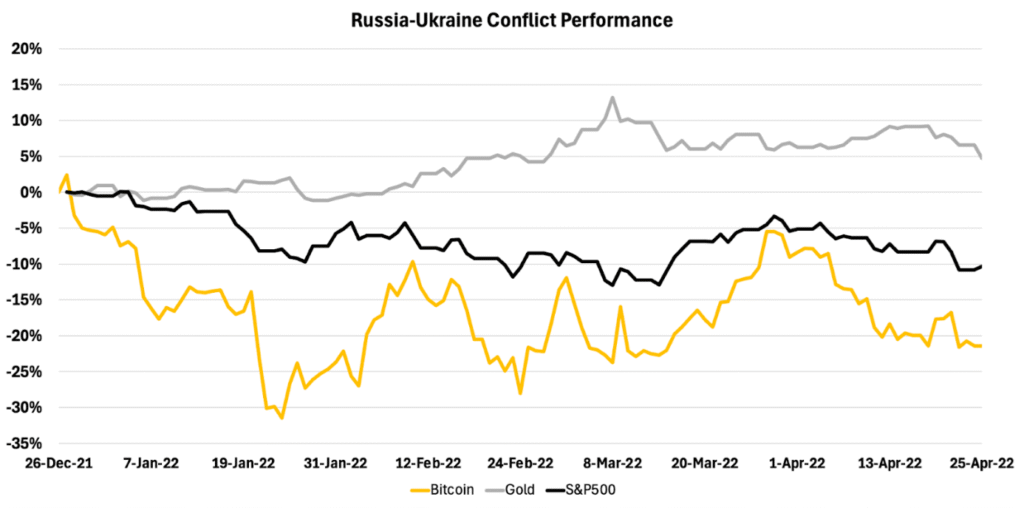
Source: Bloomberg, Coinmetrics, 21Shares
The Russian invasion sent immediate shockwaves through global markets, triggering a sharp selloff across risk assets—including Bitcoin. Within weeks, BTC plunged nearly 30%, moving in near lockstep with equities. However, the conflict reinforced Bitcoin’s utility in unexpected ways. As traditional banking infrastructure in parts of the region became compromised, crypto provided a borderless, censorship-resistant alternative, enabling cross-border donations and giving individuals access to funds when traditional financial channels were restricted.
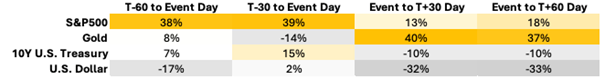
Still, from a market perspective, Bitcoin traded in alignment with equities. Bitcoin’s correlation with the S&P 500 surged from 51% pre-event to 69% within 60 days. In contrast, gold—historically the premier safe-haven asset—saw its correlation drop from -10% to -36%, reinforcing the notion that Bitcoin, at the time, was still largely perceived as a risk-on asset rather than a macro hedge.
Figure 16 – Russia-Ukraine Conflict Correlations
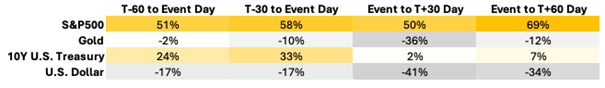
Source: Bloomberg, 21Shares
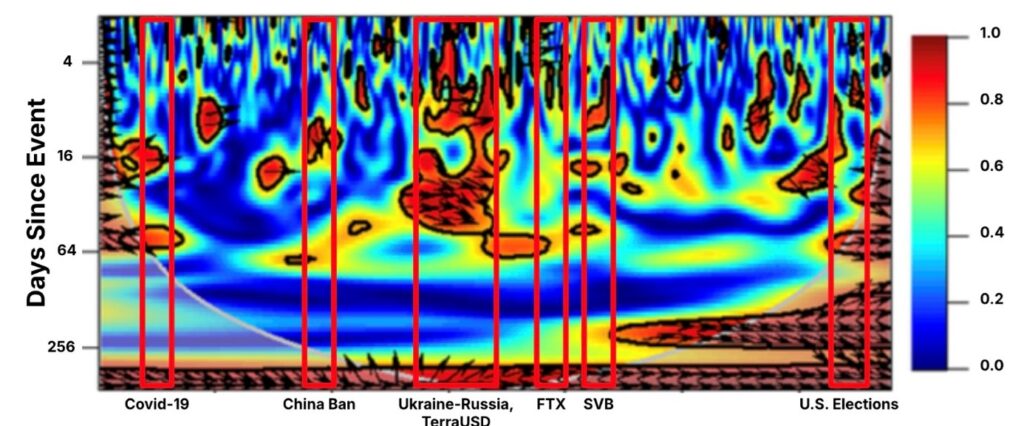
To further understand Bitcoin’s behavior, we conducted a wavelet coherence between BTC and the S&P 500. Unlike traditional correlation metrics, this offers a time-sensitive perspective, allowing us to track when Bitcoin moved in sync with equities and when it began to diverge.
Figure 17 – 2022 Wavelet Coherence Between S&P500 vs. Bitcoin
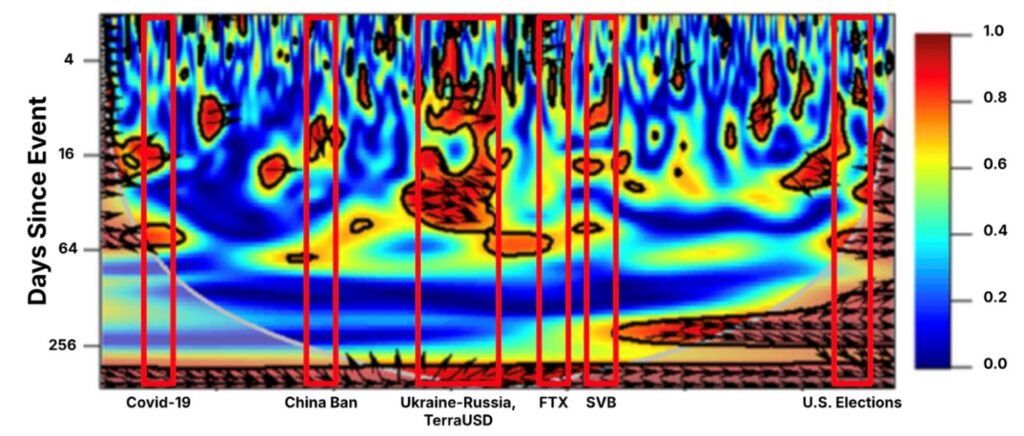
Source: Bloomberg, 21Shares
The Russia-Ukraine conflict serves as a prime example. In the immediate aftermath, Bitcoin’s correlation with equities was weak, reflected in blue regions on the chart—suggesting that the initial market reaction was chaotic and indiscriminate, as uncertainty was weighed out. However, in the following weeks, Bitcoin’s correlation with equities tightened significantly—highlighted by deep red bands—as investors processed the broader economic implications. The rightward-pointing arrows indicate a strong positive correlation, while their slight downward tilt suggests that the S&P 500 was leading Bitcoin’s price action. This pattern is consistent with other macro-driven shocks, where equities dictate broader market sentiment, and Bitcoin follows rather than leads. A similar response was observed after the recent U.S. election, reinforcing Bitcoin’s heightened sensitivity to macroeconomic shifts and continued correlation with traditional risk assets.
By May 2022, however, Bitcoin’s correlation with equities began to weaken—coinciding with the collapse of TerraUSD (UST), which triggered a wave of contagion across crypto markets. On the surface, it may seem that Bitcoin was still being led by the S&P 500, but a closer examination may suggest otherwise. TerraUSD’s depeg was an industry-specific shock—a crypto-native failure—that directly affected the broader ecosystem, while the S&P 500 was more likely reacting to the economic background, riddled with geopolitical and monetary risk. This distinction is crucial—while both assets saw downward pressure, their declines were driven by fundamentally different forces.
From this point forward, the crypto market’s decline became increasingly self-inflicted, driven more by internal failures. The 2022 Bitcoin performance chart offers a clear visualization of how successive shocks weighed on the asset. While Bitcoin found temporary stability post-invasion, the relief was short-lived.
• May 2022: The TerraUSD depeg triggered one of the most severe crises in crypto history. Where the Russia-Ukraine conflict had tied Bitcoin’s performance closely to macroeconomic conditions, TerraUSD’s collapse shifted the focus to internal risks. The resulting contagion led to the collapse of Celsius and Three Arrows Capital, sending Bitcoin into a sustained downward spiral, with every short-lived bounce met with renewed selling pressure.
• November 2022: By the time the FTX collapse hit, sentiment was at a breaking point. Equity markets had begun stabilizing, but Bitcoin remained trapped in a prolonged capitulation phase. The final leg down in November erased any remaining bullish optimism, as faith in crypto institutions crumbled alongside FTX’s balance sheet.
Figure 18 – Bitcoin Performance in 2022
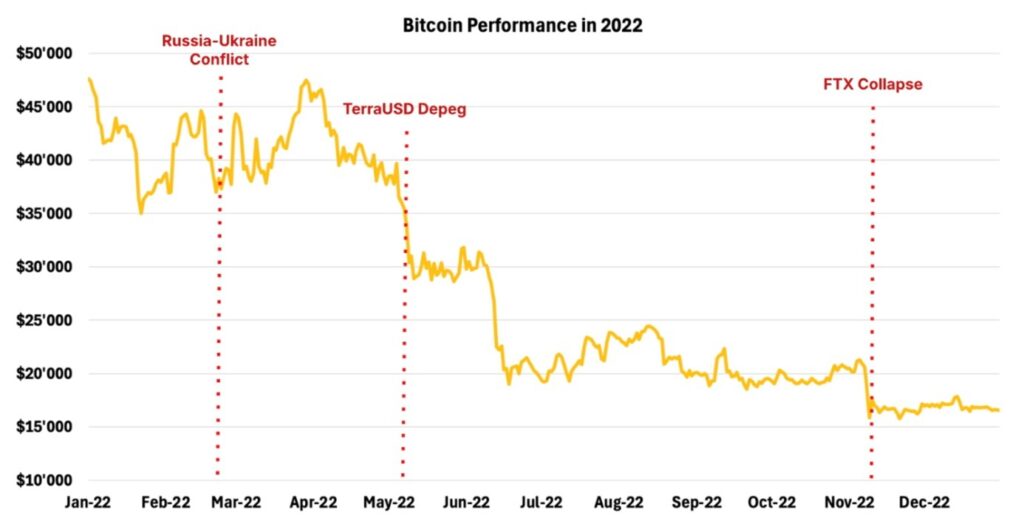
Source: Coinmetrics, 21Shares
These successive blows are reflected in the Fear & Greed Index, which remained firmly in ”fear” territory for much of the year. Unlike previous downturns—where Bitcoin eventually decoupled and recovered—2022 was defined by a series of compounding psychological shocks.
Figure 19 – 2022 Fear & Greed
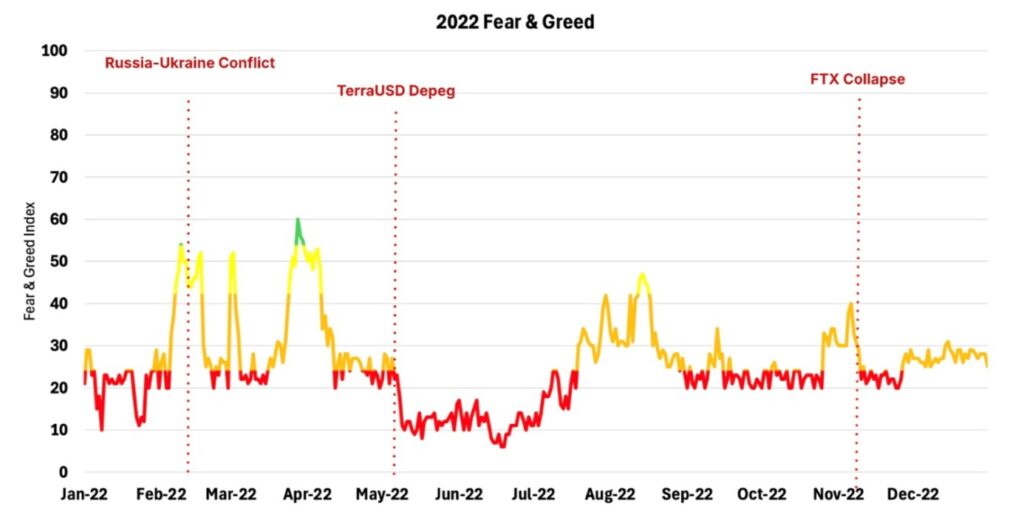
Source: Glassnode, 21Shares
Beyond sentiment collapse, 2022 marked a shift—the first time liquidity meaningfully exited the ecosystem. TerraUSD’s depeg erased nearly $20 billion, but the ripple effects extended far beyond that single event. As trust in the ecosystem deteriorated, stablecoin supply—a measure of crypto liquidity—continued contracting, signaling capital not just rotating within the ecosystem, but leaving it entirely. Unlike previous cycles, where funds remained sidelined, this time, liquidity drained from the market altogether, prolonging the bear market and deepening the downturn.
Figure 20 – Total Stablecoin Supply
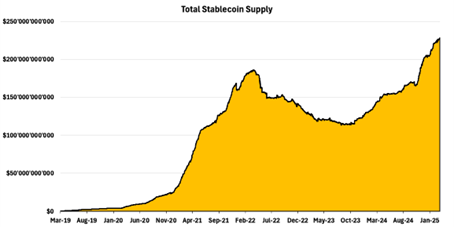
Source: DefiLlama, Artemis, 21Shares
This liquidity drain persisted until October 2023—when capital finally began flowing back as conditions stabilized, reinforcing the industry’s resilience in the face of the most brutal downturns in its history. The stabilization and eventual rebound highlight a fundamental reality: while trust in the crypto industry can be shaken, the asset class’ long-term value proposition endures.
Silicon Valley Bank Collapse
The collapse of Silicon Valley Bank in March 2023—the largest U.S. banking failure since 2008—initially triggered fears of widespread market turmoil. Yet, after a brief dip, Bitcoin defied expectations, surging over 60% in the months that followed. This event not only reinforced Bitcoin’s evolving role as a hedge against systemic financial instability and counterparty risk but also marked a potential turning point in how market participants engaged with its fundamentals.
Figure 21 – Silicon Valley Bank Collapse Performance
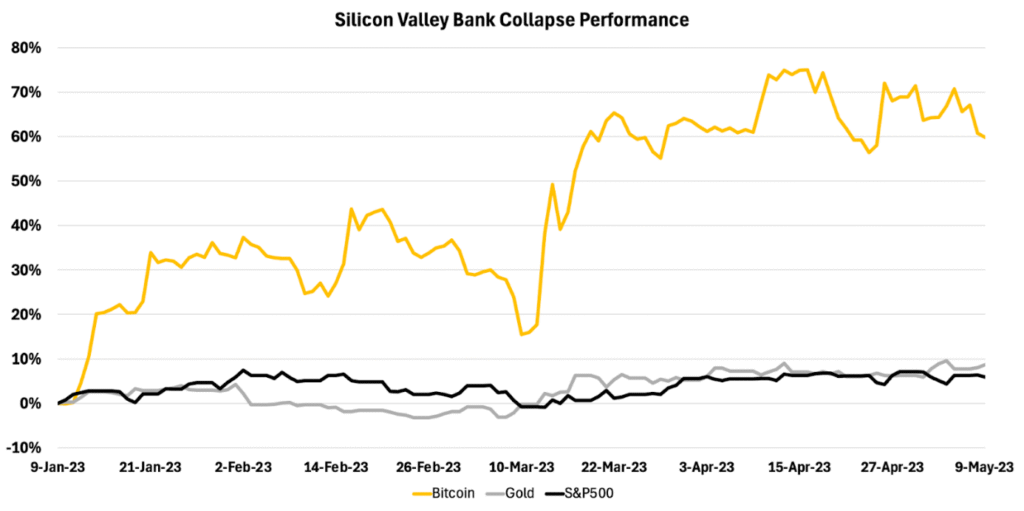
Source: Bloomberg, Coinmetrics, 21Shares
While initial uncertainty briefly saw Bitcoin move in tandem with equities, its correlation quickly broke down as market participants reassessed its role in the wake of the banking crisis.
Figure 22 – Silicon Valley Bank Collapse Correlations
Source: Bloomberg, 21Shares
As shown below, within two weeks, Bitcoin’s correlation with the S&P 500 had meaningfully weakened, with distinct periods where Bitcoin moved independently from equities. Unlike previous financial crises—where Bitcoin largely followed traditional markets—this event marked a clear shift.
Figure 23 – Silicon Valley Bank Wavelet Coherence Between S&P500 vs. Bitcoin
Source: Bloomberg, 21Shares
The Fear & Greed Index, which typically reacts sharply to financial crises, showed only a brief dip before rebounding swiftly. A financial thesis born from the 2008 crisis found renewed relevance in 2023, as another major banking failure reinforced Bitcoin’s role as a hedge against systemic instability. This time, however, the market’s response suggested a stronger conviction in Bitcoin’s independence from traditional financial risks. A validation of Bitcoin’s underlying thesis.
Figure 24 – Silicon Valley Bank Collapse Fear & Greed
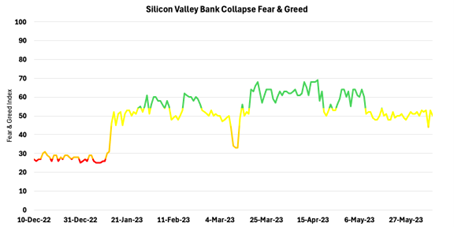
Source: Glassnode, 21Shares
Research Newsletter
Each week the 21Shares Research team will publish our data-driven insights into the crypto asset world through this newsletter. Please direct any comments, questions, and words of feedback to research@21shares.com
Disclaimer
The information provided does not constitute a prospectus or other offering material and does not contain or constitute an offer to sell or a solicitation of any offer to buy securities in any jurisdiction. Some of the information published herein may contain forward-looking statements. Readers are cautioned that any such forward-looking statements are not guarantees of future performance and involve risks and uncertainties and that actual results may differ materially from those in the forward-looking statements as a result of various factors. The information contained herein may not be considered as economic, legal, tax or other advice and users are cautioned to base investment decisions or other decisions solely on the content hereof.


HANetfs kommenterar guldpriset som når nya rekordnivåer

BE27 ETF bara företagsobligationer med förfall 2027

Bitcoin in the eye of the storm: A market shaped by two forces

SAWG ETF är en globalfond valutasäkrad i GBP

Europeisk försvars-ETF når 10 miljoner dollar under den första noteringsveckan

Fonder som ger exponering mot försvarsindustrin
Crypto Market Risks & Opportunities: Insights on Bybit Hack, Bitcoin, and Institutional Adoption

Montrose storsatsning på ETFer fortsätter – lanserar Sveriges första globala ETF med hävstång

Warren Buffetts råd om vad man ska göra när börsen kraschar

Svenskarna har en ny favorit-ETF
-
 Nyheter4 veckor sedan
Fonder som ger exponering mot försvarsindustrin
-

 Nyheter3 veckor sedan
Crypto Market Risks & Opportunities: Insights on Bybit Hack, Bitcoin, and Institutional Adoption
-
 Nyheter3 veckor sedan
Montrose storsatsning på ETFer fortsätter – lanserar Sveriges första globala ETF med hävstång
-
 Nyheter4 veckor sedan
Warren Buffetts råd om vad man ska göra när börsen kraschar
-
 Nyheter3 veckor sedan
Svenskarna har en ny favorit-ETF
-

 Nyheter3 veckor sedan
MONTLEV, Sveriges första globala ETF med hävstång
-

 Nyheter4 veckor sedan
Fastställd utdelning i MONTDIV mars 2025
-

 Nyheter2 veckor sedan
Sju börshandlade fonder som investerar i försvarssektorn