Följ oss

Nyheter

Opportunity to short agriculture with La Niña

Publicerad

den

ETF Securities Commodities Research - Opportunity to short agriculture with La Niña Crop production may increase if La Niña starts in winter

ETF Securities Commodities Research – Opportunity to short agriculture with La Niña

Crop production may increase if La Niña starts in winter

Summary

  • As El Niño fades, La Niña weather conditions look increasingly likely to emerge later in the year.
  • La Niñas that reach a “medium” strength by northern hemisphere winter tend to help the production of grains, coffee and cocoa and so a La Niña starting in winter 2016/17 could be price negative.
  • Should La Niña be delayed to spring/summer 2017, we could see mainly price positive developments.

From El Niño to La Niña

We are currently in the one of the most extreme El Niño events on record (with records dating back to 1950). El Niño refers to the warm phase of the El Niño-Southern Oscillation (ENSO) which is a scientific term that describes the fluctuations in temperature between the ocean and atmosphere in the east-central Equatorial Pacific. The warm phase of the ENSO has led to droughts in Asia and excess rain in South America, leading to a 50% rally in sugar prices between August and December 2015 for example.

According to the Australian Bureau of Meteorology, out of the past 26 El Niño events since 1900 approximately 40% have been followed by a La Niña, the cold phase of ENSO. The International Research Institute for Climate and Society’si regression models peg the probability of a La Niña  event at 53% by September.

ETFS1

(Click to enlarge) La Niña tends to have the opposite effect of El Niño: places with droughts under El Niño tend to have excess rain under La Niña and vice-versa.

ETFS2

(Click to enlarge) Source: National Oceanic and Atmospheric Organization

Our analysis of previous ENSO cycles identifies nine distinct La Niña events of a medium magnitudeii since 1959 (8 for coffee since 1972 and 6 for soybean oil since 1979 due to lack of price availability). We look at how commodity prices have performed one year from the date a certain threshold of La Niña intensity has been reached. At a first glance it appears as if there is no clear directional impact from La Niña events. For most commodities there have been a similar number of price-positive events as price negative.

ETFS3

(Click to enlarge)

Summer La Niña vs. Winter La Niña

However, a key distinguishing feature between these nine events is when the La Niña started (or more accurately when it reaches our threshold intensity). We see a clear pattern that La Niñas that reach threshold intensity in the northern hemisphere winter, drive prices of most agricultural commodities lower within one year of the event. The notable exception is sugar. La Niñas that reach threshold intensity in the northern hemisphere summer, drive prices of most agricultural commodities higher within one year of the event. Soybean is an exception here. Summer La Niñas tend to have a more substantial price impact, reflecting the fact that more northern hemisphere crops are in the ground and therefore exposed to weather changes.

ETFS4

(Click to enlarge) Based on NOAA model forecasts of a greater than 50% probability of La Niña starting in northern hemisphere Autumn, we could hit threshold intensity by winter 2016.

Looking at past price trends has limitations. We are not accounting for length or amplitude of each weather event. Nor are we conditioning for other drivers of price including: planting decisions, competing weather patterns, crop infections, starting stocks and currency movements.

Crop cycle and weather impacts by geography

Looking at the crop cycle and weather impacts at different times of the year in various geographies, we believe there is a logical reason why prices should rise or fall in a winter La Niña. The table below is a summary of our findings. We believe that if a winter La Niña 2016 is confirmed, there is good reason to short wheat, corn, soybeans, coffee and cocoa and go long sugar.

At meteorologists’ mercy

We caution investors however, to wait for a confirmation that the weather pattern will emerge as early as winter 2016/17. If the weather event is delayed until spring/summer 2017, then the price impacts could be very different. Remember, the El Niño expected in 2014 did not emerge until 2015. In the meantime, lingering weather impacts from El Niño could provide upside price risks for cocoa in the short-term as the market has underestimated the impact of dryness on the mid-crop which will be harvested from May in most of Africa. Cocoa prices have fallen more than 20% since December as the market has focused on ample port deliveries failing to recognise that supply overall this year could be tight.

ETFS5

(Click to enlarge)

i The organisation that jointly produces the official US meteorological forecasts with the National Oceanic and Atmospheric Organization. The official forecast is based on a consensus of forecasters and committee discussion. The probability from the regression is a purely objective input to the discussion.
ii We use an Oceanic Niño Index (ONI) of less than or equal to -1° to identify a “medium” La Niño event. The ONI is based on Sea Surface Temperature (SST) departures in a specific region of the Pacific Ocean away from its 30-year average. While a La Niña event is technically marked by a ONI of less than or equal to -0.5°, we have chosen to look at medium intensity of -1°, to judge events of significant strength and reduce spurious analysis. We call this the “threshold intensity” for the purpose of this article.

Important Information

General

This communication has been issued and approved for the purpose of section 21 of the Financial Services and Markets Act 2000 by ETF Securities (UK) Limited (“ETFS UK”) which is authorised and regulated by the United Kingdom Financial Conduct Authority (the “FCA”).

The information contained in this communication is for your general information only and is neither an offer for sale nor a solicitation of an offer to buy securities.

Fortsätt läsa
Annons
Klicka för att kommentera

Skriv en kommentar

Din e-postadress kommer inte publiceras. Obligatoriska fält är märkta *

Nyheter

Time in Bitcoin beats timing Bitcoin

Publicerad

den

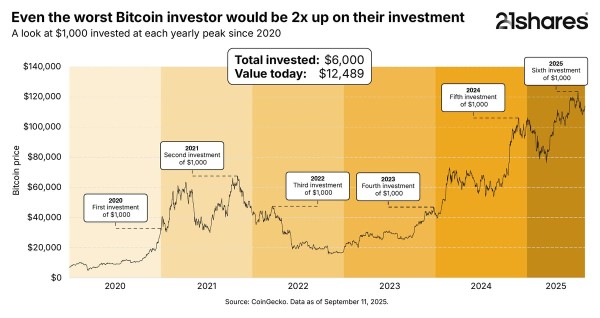
Even buying Bitcoin at its yearly peak since 2020 would still have doubled your investment, proving the power of long-term growth versus trying to time the market.

Even buying Bitcoin at its yearly peak since 2020 would still have doubled your investment, proving the power of long-term growth versus trying to time the market.

Why Solana matters: Exploring its use cases and growing adoption

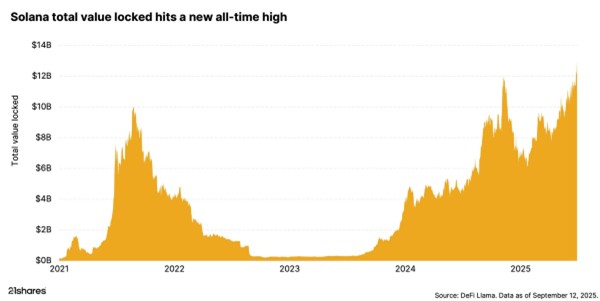
Solana’s surge isn’t just market speculation; it’s driven by real-world adoption. From payments and DeFi to tokenization, the blockchain is seeing record engagement, reflected in its all-time high total value locked (TVL).

How Raydium and Jupiter are powering Solana DeFi

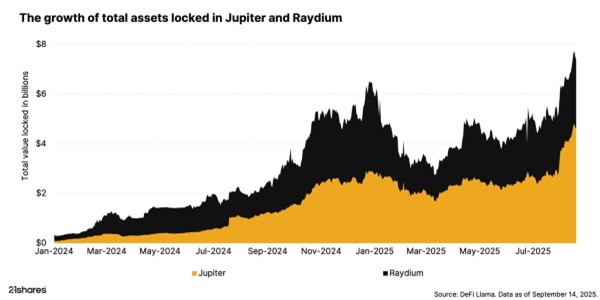
Raydium and Jupiter are the pillars of Solana’s DeFi ecosystem, delivering deep liquidity, seamless trading, and efficient execution that keep the network thriving. They make crypto markets faster, cheaper, and more accessible for everyone.

Research Newsletter

Each week the 21Shares Research team will publish our data-driven insights into the crypto asset world through this newsletter. Please direct any comments, questions, and words of feedback to research@21shares.com

Disclaimer

The information provided does not constitute a prospectus or other offering material and does not contain or constitute an offer to sell or a solicitation of any offer to buy securities in any jurisdiction. Some of the information published herein may contain forward-looking statements. Readers are cautioned that any such forward-looking statements are not guarantees of future performance and involve risks and uncertainties and that actual results may differ materially from those in the forward-looking statements as a result of various factors. The information contained herein may not be considered as economic, legal, tax or other advice and users are cautioned to base investment decisions or other decisions solely on the content hereof.

Fortsätt läsa

Nyheter

WMMV ETF en lågvolatilitetsfond som handlas i euro och pund

Publicerad

den

Amundi MSCI World Minimum Volatility Screened Factor UCITS ETF UCITS ETF Acc (WMMV ETF) med ISIN IE0001DKJVC2, försöker spåra MSCI World Minimum Volatility Select ESG Low Carbon Target-index. MSCI World Minimum Volatility ESG Reduced Carbon Target-index spårar aktier från utvecklade länder över hela världen som är valda enligt låg volatilitet och ESG-kriterier (miljö, social och företagsstyrning). Indexet har som mål att minska utsläppen av växthusgaser och ett förbättrat ESG-poäng jämfört med jämförelseindex. Jämförelseindex är MSCI World-index.

Amundi MSCI World Minimum Volatility Screened Factor UCITS ETF UCITS ETF Acc (WMMV ETF) med ISIN IE0001DKJVC2, försöker spåra MSCI World Minimum Volatility Select ESG Low Carbon Target-index. MSCI World Minimum Volatility ESG Reduced Carbon Target-index spårar aktier från utvecklade länder över hela världen som är valda enligt låg volatilitet och ESG-kriterier (miljö, social och företagsstyrning). Indexet har som mål att minska utsläppen av växthusgaser och ett förbättrat ESG-poäng jämfört med jämförelseindex. Jämförelseindex är MSCI World-index.

Den börshandlade fondens TER (total cost ratio) uppgår till 0,25 % p.a. Amundi MSCI World Minimum Volatility Screened Factor UCITS ETF UCITS ETF Acc är den enda ETF som följer MSCI World Minimum Volatility Select ESG Low Carbon Target-index. ETFen replikerar det underliggande indexets prestanda genom fullständig replikering (köper alla indexbeståndsdelar). Utdelningarna i ETF:n ackumuleras och återinvesteras.

Denna ETF lanserades den 30 oktober 2024 och har sin hemvist i Irland.

Investeringsmål

Amundi MSCI World Minimum Volatility Screened Factor UCITS ETF Acc försöker replikera, så nära som möjligt, oavsett om trenden är stigande eller fallande, resultatet för MSCI World Minimum Volatility Select ESG Low Carbon Target Index (”Indexet”). Delfondens mål är att uppnå en tracking error-nivå för delfonden och dess index som normalt inte kommer att överstiga 1 %.

Handla WMMV ETF

Amundi MSCI World Minimum Volatility Screened Factor UCITS ETF UCITS ETF Acc (WMMV ETF) är en europeisk börshandlad fond. Denna fond handlas på Deutsche Boerse Xetra.

Det betyder att det går att handla andelar i denna ETF genom de flesta svenska banker och Internetmäklare, till exempel DEGIRONordnet, Aktieinvest och Avanza.

Börsnoteringar

BörsValutaKortnamn
XETRAEURWMMV
XETRAGBPWMMX

Största innehav

Denna fond använder fysisk replikering för att spåra indexets prestanda.

NamnValutaVikt %Sektor
T-MOBILE US INCUSD2.00 %Communication Services
MOTOROLA SOLUTIONS INCUSD1.86 %Information Technology
MCKESSON CORPUSD1.57 %Health Care
ZURICH INSURANCE GROUP AGCHF1.56 %Financials
CISCO SYSTEMS INCUSD1.56 %Information Technology
WASTE MANAGEMENT INCUSD1.47 %Industrials
UNITEDHEALTH GROUP INCUSD1.42 %Health Care
MICROSOFT CORPUSD1.35 %Information Technology
KDDI CORPJPY1.32 %Communication Services
REPUBLIC SERVICES INCUSD1.32 %Industrials

Innehav kan komma att förändras

Fortsätt läsa

Nyheter

UBS AM lanserar UBS Treasury Yield Plus ETFer

Publicerad

den

UBS Asset Management lanserar EUR och USD Treasury Yield Plus UCITS ETFer· ETFerna syftar till att öka avkastningen samtidigt som riskegenskaperna hos deras referensindex bibehålls

· UBS Asset Management lanserar EUR och USD Treasury Yield Plus UCITS ETFer

· ETFerna syftar till att öka avkastningen samtidigt som riskegenskaperna hos deras referensindex bibehålls

· En egenutvecklad regelbaserad modell används för att bredda investeringsuniversumet för att förbättra tillgången till en större uppsättning möjligheter

UBS Asset Management (UBS AM) tillkännager idag lanseringen av två nya ETF:er som syftar till att leverera förbättrad avkastning, samtidigt som riskprofilen för deras underliggande statsobligationsindex bevaras. UBS EUR Treasury Yield Plus UCITS ETF och UBS USD Treasury Yield Plus UCITS ETF syftar till att överträffa sina respektive Bloomberg Treasury-index genom att rikta in sig på högre optionsjusterad spread (OAS), samtidigt som de bibehåller en strikt anpassning till duration, kreditkvalitet och landsexponering1.

Portföljkonstruktion

· Universumsdefinition: Varje ETF börjar med sitt respektive Bloomberg Treasury Index (EUR eller USD) och utökar uppsättningen möjligheter till att inkludera högkvalitativa statsobligationer, överstatliga obligationer och agentobligationer (SSA), vilka kan erbjuda en högre avkastning än statsobligationer.
· Optimering: SSA-obligationerna väljs ut med hjälp av en egenutvecklad regelbaserad modell som maximerar OAS samtidigt som strikta begränsningar för rating, land, sektor, duration och kurvrisk följs.

· Dynamisk allokering: Portföljförvaltaren kan använda sitt eget omdöme för att ytterligare förbättra portföljens avkastning och/eller riskprofil.

André Mueller, chef för kundtäckning, UBS AM, sa: ”De snabbt ökande tillgångarna i förbättrade ränte-ETF:er signalerar en växande investerarefterfrågan på fonder som går utöver traditionella passiva riktmärken. UBS AM har långvarig expertis inom regelbaserade strategier, så jag är glad att vi för första gången kan erbjuda denna möjlighet till ett bredare spektrum av kunder genom det bekväma, transparenta och effektiva ETF-omslaget.”

Fonden är registrerad för försäljning i Österrike, Danmark, Finland, Frankrike, Tyskland, Irland, Italien, Liechtenstein, Luxemburg, Nederländerna, Norge, Spanien, Sverige, Schweiz och Storbritannien.

ETFShare classTERISINBörsValutaBloomberg Ticker
UBS EUR Treasury Yield Plus UCITS ETF EUREUR acc0.15%LU3079566835SIX SwissEUREUTYP SW
Borsa ItalianaEURETY IM
XETRAEURCHSW GY
EUR   dis0.15%LU3079566918XETRAEURCHSZ GY
UBS USD Treasury Yield Plus UCITS ETF USDUSD acc0.15%LU3079567056SIX SwissUSDUSTYP SW
Borsa ItalianaEURUTY IM
XETRAEURCHSY GY
USD   dis0.15%LU3079567130XETRAEURCHSX GY
London Stock ExchangeGBPUTYP LN

Fortsätt läsa

21Shares

Prenumerera på nyheter om ETFer

* indicates required

21Shares

21Shares

Populära