
Nyheter
Is VIX the next market blunder?

ETF Securities Equity Research: Is VIX the next market blunder?
Highlights
- The VIX index is currently demonstrating a complete absence of fear. In the context of current world affairs and political instability, we believe this is demonstrating a worrying complacency amongst investors.
- Shorting the VIX is a dangerously crowded trade. The risk of market dislocation increases as interest rates rise.
- The VIX and equity valuations are unusually closely correlated, implying that investors are buying equities due to their low volatility, and are comfortable with high valuations as a result. As we believe the VIX is likely understating risk, this puts equity investors in a vulnerable position.
Changing course after failure
The VIX index, coined as the fear index, is currently demonstrating a complete absence of fear. Except for the occasional spike upwards this year it has been exceptionally low. The average level of VIX for this year sits in the lowest 5% in history (since 1991) with the current level being in the lowest 1%. Furthermore, the low of 9.75 this year was the 5th lowest in history, a level last achieved in late 1993. In the context of current world affairs and political instability, we believe this is demonstrating a worrying level of complacency amongst investors.

Recent spikes in the VIX highlight how this complacency can leave investors going short the VIX index vulnerable. The spike on 17th May is a good example. The VIX rose 46% from 10.6 to 15.6 overnight on the back of revelations that Donald Trump asked ex FBI Director James Comey to drop the FBI investigation into Russian involvement in the US Presidential elections.
From a superficial perspective, the low VIX suggests investors’ perception of future volatility is sanguine. We believe the VIX is understating risk. Our model of the VIX, which uses a combination of the Global Financial Stress Index (GFSI) and the US Economic Policy Uncertainty Index (detailed in VIX & Tax promises lulling equity investors into a false sense of security) highlights a widening deviation between our model results of the VIX and the actual VIX index. Our model suggests the VIX should be closer to 15, not its current level of 10.6. Thus, our model indicates that market perception of risk should be much higher. Perversely, we believe this disparity has been partly due to unstable macro events. A broad rise in the S&P500 is masking unusually low correlation between market sectors and individual stocks. This does not fully explain why the VIX has been deviating from our model, as this is a more recent phenomenon.
Since 2013 a worrying trend has arisen amongst a group of investors who are shorting the VIX. The subdued level of the VIX has likely been driven by investors, on the hunt for yield, motivated by years of loose monetary policy. The steep term structure gives these investors who are short the VIX a yield.

According to the CFTC (Commodity Futures Trading Commission), investors are holding record short positions – over 3x standard deviation from its historical range relative to long positions – suggesting shorting the VIX is an increasingly crowded trade.

We question how long this can last given the VIX is so low. We also remain concerned that an unwind of this trade will hurt, potentially prompting a VIX short squeeze and the resultant higher volatility prompting a risk asset sell-off. Timing a potential shift in sentiment is difficult although shorting the VIX will become increasingly less attractive every time the US Federal Reserve (FED) increases interest rates. The short VIX yield will therefore look increasingly less attractive as yields in other assets increase with rising interest rates. Conversely, an unexpected sharp move in equities or a significant political event could also precipitate an unwind in short VIX positioning.
On the other side of this trade are investors who see record lows in the VIX as an opportunity to buy long positions, fearing that volatility may rise. As illustrated by the shares outstanding from a selection of ETFs, short VIX ETF shares have been falling recently while long VIX ETF shares have risen sharply. This trend emerged not long after the first FED rate hike in December 2015.

The challenge in owning long VIX products is their ability to track the index. As the term structure is steep, it means as the products switch from one contract to the next, there is a cost incurred, meaning over time there is an increasing decay in relative performance.
The low measures of the VIX does have implications for the equity market. Historically there has been a poor relationship between the VIX and price/earnings (PE) valuations in the US, with a regression between of the two demonstrating an R-squared of 0.1 since 1990. However, over the last 2 years the R-squared his risen sharply to 0.58, suggesting a much closer correlation between the VIX and PEs.

The worrying aspect in the relationship is that the further the VIX falls, the higher valuations are, implying that investors are buying equities due to their low volatility, and are happy paying higher valuations to do so. As we believe the VIX is likely understating risk, this puts equity investors in a vulnerable position.
In short, we believe equity investors are becoming too complacent, valuations are high at a time when margins are likely to be squeezed further, whilst many promised corporate tax cuts may not come to fruition this year. Furthermore, we believe the VIX is lulling some investors into a false sense of security when holding equities. These factors leave equity markets vulnerable to a sell-off in the event of further interest rate rises and continued lack of clarity from the US political administration.
For more information contact:
ETF Securities Research team
ETF Securities (UK) Limited
T +44 (0) 207 448 4336
E info@etfsecurities.com
Important Information
This communication has been issued and approved for the purpose of section 21 of the Financial Services and Markets Act 2000 by ETF Securities (UK) Limited (“ETFS UK”) which is authorised and regulated by the United Kingdom Financial Conduct Authority (the “FCA”).


As April winds down, markets remain on edge, with escalating tariffs and renewed trade tensions keeping volatility in focus. In this summary of our full-length newsletter, we spotlight gold and gold equities, both of which have surged to record levels. We also take a step back from the day-to-day noise in crypto to explore the broader shifts in the regulatory landscape in our latest Whitepaper and present Celestia in detail. Finally, we assess how Moat indexes have held up and evolved amid the turbulence.
Your VanEck Europe team wishes you a great read.
Featured Articles
 Are Gold Mining Equities Regaining Attention Amid Rising Gold Prices?
Gold & Gold mining equities tend to shine during stress periods
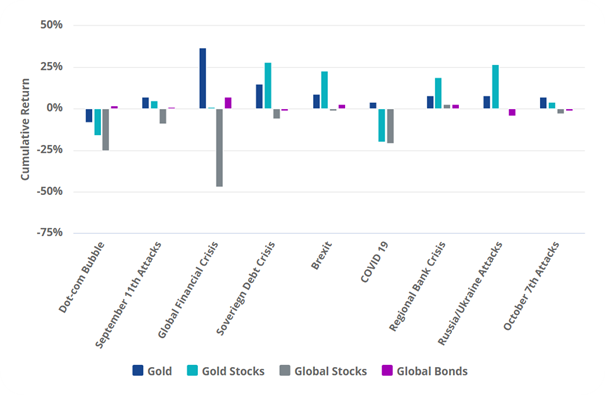
Source: VanEck, World Gold Council.
Gold has attracted renewed interest from investors amid concerns about inflation, currency volatility, and overall market uncertainty. Gold mining companies have recently reported improved profit margins and cash generation, with some initiating share buybacks and maintaining relatively strong balance sheets. Despite these developments, many continue to trade below their historical valuation averages.
While historical trends indicate that gold and gold mining equities have outperformed during certain periods of market stress, these patterns may not repeat under different economic conditions. Performance can be influenced by a range of factors including interest rates, central bank policy, geopolitical developments, and investor sentiment.
→ Read more
 Whitepaper Highlights: How New Crypto Regulations May Shape the Future
Cryptocurrencies are entering a new era. With the re-election of Donald Trump and the implementation of the European Union’s Markets in Crypto-Assets (MiCA) regulation, digital assets are moving into a landscape defined not just by innovation, but also by regulatory clarity.
MiCA’s structured and transparent approach aims to promote legitimacy, safeguard investors, and enhance trust in digital asset markets across Europe. It could also serve as a blueprint for other jurisdictions looking to regulate crypto effectively.
→ Read the Whitepaper Highlights
 Introduction to Celestia
Most blockchains, like Ethereum or Bitcoin, are monolithic which means they perform all major functions (consensus, data availability, and execution) on a single layer. This design ensures security but according to new modular networks, limits scalability and flexibility.
The modular blockchain thesis, which Celestia is leading, proposes separation of layers and respective responsibilities in the network.
→ Read more
Note: This article in not accessible to our UK readers.
 Riding the Gold Wave
Chasing the Vein: Fund Flows into Gold Miners
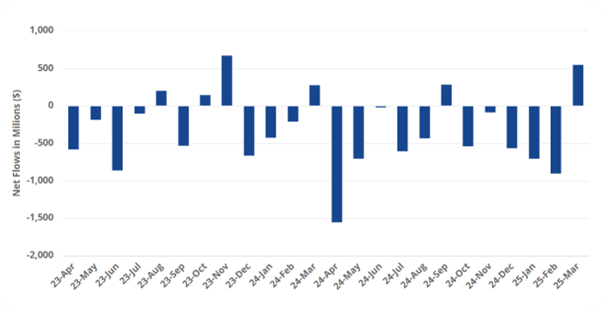
Source: Mining.com. Data as of 21 March 2025. Note: Data covers 493 funds with combined assets under management of $62 billion.
U.S. equity markets experienced significant declines during the month of March. Meanwhile, spot gold price recorded new all-time highs, surpassing the $3,000 per ounce mark on 14 March and closing at a record price of $3123.57 on March 31, a 9.30% ($265.73) monthly gain. As of 31 March, gold prices have risen by 93.61% over the past five years (1). Investors should keep in mind that past performance is not representative of future results.
The gold miners, as represented by the NYSE Arca Gold Miners Index (GDMNTR), outperformed significantly, up 15.51% during March (2). This gain reflects both their operational leverage to rising gold prices and market perceptions of relative value. However, gold miners can also be subject to heightened volatility, operational risks, and sensitivity to commodity price swings.
While gold and gold equities may serve as diversifiers in a portfolio due to their historically low correlations with many asset classes, investors should remain mindful of the inherent risks, including price volatility, currency movements, and shifts in investor sentiment that can lead to rapid reversals in performance.
→ Read more
 Moat Stocks Weather Tariff Tumble
Market turbulence in March weighed on stocks. The Moat Index was not immune to the market turmoil, as it declined along with the broad U.S. equity market ending the month lower. However, the Moat Index showed resilience relative to the S&P 500—thanks in part to defensive sector resilience and underweight exposure to mega-caps.
At the same time, the SMID Moat Index lagged small and mid-caps in March. Smaller U.S. stocks were also impacted by global trade tensions and economic growth concerns with the broad small- and mid-cap benchmarks falling during the month. However, year-to-date, the SMID Moat Index remains ahead of the broader small- and mid-cap markets.
This is a preview of our monthly ETF insights email newsletter.
To receive the full version, sign up here.
(1) Source: World Gold Council, ICE Data Services, FactSet Research Systems Inc.
(2) Source: Financial Times.
IMPORTANT INFORMATION
This is marketing communication. Please refer to the prospectus of the UCITS and to the KID/KIID before making any final investment decisions. These documents are available in English and the KIDs/KIIDs in local languages and can be obtained free of charge at www.vaneck.com, from VanEck Asset Management B.V. (the “Management Company”) or, where applicable, from the relevant appointed facility agent for your country.
For investors in Switzerland: VanEck Switzerland AG, with registered office in Genferstrasse 21, 8002 Zurich, Switzerland, has been appointed as distributor of VanEck´s products in Switzerland by the Management Company. A copy of the latest prospectus, the Articles, the Key Information Document, the annual report and semi-annual report can be found on our website www.vaneck.com or can be obtained free of charge from the representative in Switzerland: Zeidler Regulatory Services (Switzerland) AG, Neudtadtgasse 1a, 8400 Winterthur, Switzerland. Swiss paying agent: Helvetische Bank AG, Seefeldstrasse 215, CH-8008 Zürich.
For investors in the UK: This is a marketing communication targeted to FCA regulated financial intermediaries. Retail clients should not rely on any of the information provided and should seek assistance from a financial intermediary for all investment guidance and advice. VanEck Securities UK Limited (FRN: 1002854) is an Appointed Representative of Sturgeon Ventures LLP (FRN: 452811), which is authorised and regulated by the Financial Conduct Authority (FCA) in the UK, to distribute VanEck´s products to FCA regulated firms such as financial intermediaries and Wealth Managers.
This information originates from VanEck (Europe) GmbH, which is authorized as an EEA investment firm under MiFID under the Markets in Financial Instruments Directive (“MiFiD). VanEck (Europe) GmbH has its registered address at Kreuznacher Str. 30, 60486 Frankfurt, Germany, and has been appointed as distributor of VanEck products in Europe by the Management Company. The Management Company is incorporated under Dutch law and registered with the Dutch Authority for the Financial Markets (AFM).
This material is only intended for general and preliminary information and shall not be construed as investment, legal or tax advice. VanEck (Europe) GmbH and its associated and affiliated companies (together “VanEck”) assume no liability with regards to any investment, divestment or retention decision on the basis of this information. The views and opinions expressed are those of the author(s) but not necessarily those of VanEck. Opinions are current as of the publication date and are subject to change with market conditions. Information provided by third party sources is believed to be reliable and have not been independently verified for accuracy or completeness and cannot be guaranteed.
Morningstar® Wide Moat Focus IndexSM, Morningstar® US Sustainability Moat Focus Index, Morningstar® US Small-Mid Cap Moat Focus IndexSM, and Morningstar® Global Wide Moat Focus IndexSM are trademarks or service marks of Morningstar, Inc. and have been licensed for use for certain purposes by VanEck. VanEck’s ETFs are not sponsored, endorsed, sold or promoted by Morningstar, and Morningstar makes no representation regarding the advisability of investing in the ETFs. Morningstar bears no liability with respect to the ETFs or any securities.
Effective December 15, 2023, the carbon risk rating screen was removed from the Morningstar® US Sustainability Moat Focus Index. Effective December 17, 2021, the Morningstar® Wide Moat Focus IndexTM was replaced with the Morningstar® US Sustainability Moat Focus Index. Effective June 20, 2016, Morningstar implemented several changes to the Morningstar® Wide Moat Focus Index construction rules. Among other changes, the index increased its constituent count from 20 stocks to at least 40 stocks and modified its rebalance and reconstitution methodology. These changes may result in more diversified exposure, lower turnover, and longer holding periods for index constituents than under the rules in effect prior to that date.
NYSE Arca Gold Miners Index is a service mark of ICE Data Indices, LLC or its affiliates (“ICE Data”) and has been licensed for use by VanEck UCITS ETF plc (the “Fund”) in connection with the ETF. Neither the Fund nor the ETF is sponsored, endorsed, sold or promoted by ICE Data. ICE Data makes no representations or warranties regarding the Fund or the ETF or the ability of the NYSE Arca Gold Miners Index to track general stock market performance. ICE DATA MAKES NO EXPRESS OR IMPLIED WARRANTIES, AND HEREBY EXPRESSLY DISCLAIMS ALL WARRANTIES OF MERCHANTABILITY OR FITNESS FOR A PARTICULAR PURPOSE WITH RESPECT TO THE NYSE ARCA GOLD MINERS INDEX OR ANY DATA INCLUDED THEREIN. IN NO EVENT SHALL ICE DATA HAVE ANY LIABILITY FOR ANY SPECIAL, PUNITIVE, INDIRECT, OR CONSEQUENTIAL DAMAGES (INCLUDING LOST PROFITS), EVEN IF NOTIFIED OF THE POSSIBILITY OF SUCH DAMAGES. ICE Data Indices, LLC and its affiliates (“ICE Data”) indices and related information, the name “ICE Data”, and related trademarks, are intellectual property licensed from ICE Data, and may not be copied, used, or distributed without ICE Data’s prior written approval. The Fund has not been passed on as to its legality or suitability, and is not regulated, issued, endorsed’ sold, guaranteed, or promoted by ICE Data.
The S&P 500 Index (“Index”) is a product of S&P Dow Jones Indices LLC and/or its affiliates and has been licensed for use by Van Eck Associates Corporation. Copyright © 2020 S&P Dow Jones Indices LLC, a division of S&P Global, Inc., and/or its affiliates. All rights reserved. Redistribution or reproduction in whole or in part are prohibited without written permission of S&P Dow Jones Indices LLC. For more information on any of S&P Dow Jones Indices LLC’s indices please visit www.spdji.com. S&P® is a registered trademark of S&P Global and Dow Jones® is a registered trademark of Dow Jones Trademark Holdings LLC. Neither S&P Dow Jones Indices LLC, Dow Jones Trademark Holdings LLC, their affiliates nor their third party licensors make any representation or warranty, express or implied, as to the ability of any index to accurately represent the asset class or market sector that it purports to represent and neither S&P Dow Jones Indices LLC, Dow Jones Trademark Holdings LLC, their affiliates nor their third party licensors shall have any liability for any errors, omissions, or interruptions of any index or the data included therein.
It is not possible to invest directly in an index.
Investing is subject to risk, including the possible loss of principal. Investors must buy and sell units of the UCITS on the secondary market via an intermediary (e.g. a broker) and cannot usually be sold directly back to the UCITS. Brokerage fees may incur. The buying price may exceed, or the selling price may be lower than the current net asset value. The indicative net asset value (iNAV) of the UCITS is available on Bloomberg. The Management Company may terminate the marketing of the UCITS in one or more jurisdictions. The summary of the investor rights is available in English at: complaints-procedure.pdf (vaneck.com). For any unfamiliar technical terms, please refer to ETF Glossary | VanEck.
No part of this material may be reproduced in any form, or referred to in any other publication, without express written permission of VanEck.
© VanEck (Europe) GmbH ©VanEck Switzerland AG © VanEck Securities UK Limited


April in ETFs: Gold at New Highs, Crypto in Transition, and Moat Index Holding Steady

BBVAE ETF är en spansk ETF som spårar Eurostoxx 50
The Art of Meme-ing: How Dogecoin Redefined Value

VGGF ETF köper statsobligationer från hela världen

Vilka ETFer investerar i europeiska Small Cap-aktier?

Montrose storsatsning på ETFer fortsätter – lanserar Sveriges första globala ETF med hävstång

MONTLEV, Sveriges första globala ETF med hävstång

Sju börshandlade fonder som investerar i försvarssektorn

Världens första europeiska försvars-ETF från ett europeiskt ETF-företag lanseras på Xetra och Euronext Paris

Europeisk försvarsutgiftsboom: Viktiga investeringsmöjligheter mitt i globala förändringar
-
 Nyheter4 veckor sedan
Montrose storsatsning på ETFer fortsätter – lanserar Sveriges första globala ETF med hävstång
-
 Nyheter4 veckor sedan
MONTLEV, Sveriges första globala ETF med hävstång
-
 Nyheter4 veckor sedan
Sju börshandlade fonder som investerar i försvarssektorn
-
 Nyheter4 veckor sedan
Världens första europeiska försvars-ETF från ett europeiskt ETF-företag lanseras på Xetra och Euronext Paris
-
 Nyheter4 veckor sedan
Europeisk försvarsutgiftsboom: Viktiga investeringsmöjligheter mitt i globala förändringar
-

 Nyheter3 veckor sedan
21Shares bildar exklusivt partnerskap med House of Doge för att lansera Dogecoin ETP i Europa
-

 Nyheter2 veckor sedan
HANetfs Tom Bailey om framtiden för europeiska försvarsfonder
-

 Nyheter1 vecka sedan
Fastställd utdelning i MONTDIV april 2025