
Nyheter
Is This Rally Over? Breaking Down How We Got Here and What The Current Data Shows
The recent crypto market rally has been predominantly focused on Bitcoin, with its performance closely tied to the U.S. presidential elections and their potential impact on the largest digital asset. This heightened focus on Bitcoin is likely to continue, as it gains increased attention from market participants and solidifies its position as a recognized store of value, particularly in the wake of the ETF approval earlier this year.
That said, the crypto market has shown clear signs of maturation, particularly evident in the remarkable growth of established DeFi protocols. Aave, for instance, if classified as a traditional bank, would rank as the 64th largest banking institution globally based on its deposit base, highlighting the significant impact of DeFi platforms. This maturity is further underscored by the impressive performance of the top 5 DeFi projects, which have yielded over 48% in the past month, while the total value locked (TVL) across the sector reached $118.4 billion, the highest since the Luna collapse in 2022. However, despite the flourishing DeFi sector, Bitcoin is expected to maintain its market dominance due to its unique advantages in regulatory clarity and social acceptance.
So, how did we reach here?
A key factor influencing Bitcoin’s recent trajectory has been Trump’s election victory, which is already making a notable impact on the U.S. crypto asset market. Within just three weeks, his administration has nominated several pro-crypto officials to prominent government positions, signaling the potential for a more favorable regulatory environment that could drive further development and adoption of the burgeoning asset class. Here’s a snapshot:
• Scott Bessent for Treasury Secretary. He is the founder of Key Square Group and a former executive at Soros Fund Management, who expressed strong support for cryptoassets.
• Howard Lutnick for Commerce Secretary. The chairman of Cantor Fitzgerald and a renowned crypto proponent. Last week his company acquired a minority stake in Tether, the world’s biggest stablecoin issuer by market capitalization, and is investing in Bitcoin-backed lending also in partnership with Tether.
• Elon Musk to lead the Department of Government Efficiency (DOGE). The new body is aimed at combating bureaucracy by pursuing three major kinds of reform: regulatory rescissions, administrative reductions, and cost savings. Most notably, Elon is a fond supporter of crypto.
• Vivek Ramaswamy to co-chair the DOGE alongside Musk. Ramaswamy is a politician and runs a $1.7-billion asset management company that just announced its plan to “integrate Bitcoin into standard portfolios of everyday Americans.”
• Brian Brooks for chairing the SEC. He is best known for his tenure at the Office of the Comptroller of the Currency in the prior Trump administration. He also took several roles in the crypto industry, the last being the former Binance U.S. CEO.
• Paul Atkins for chairing the SEC. A former SEC chair under the second President Bush (2002 to 2008), Atkins could return to the post. In the years between, he’s become an advocate for the digital-asset industry. He has since founded a consultancy, Patomak Global Partners, and has worked with the industry advocacy group, the Digital Chamber of Commerce since 2017.
• Chris Giancarlo for Crypto Szar: For the first time, the US government will have a dedicated crypto-focused position that will advise on crypto policies and regulations.
• Crypto Advisory Council: Brian Armstrong of Coinbase, Charles Hoskinson of Cardano or Bard Garlinghouse of Ripple are all alleged to take a role in the proposed council that will advise on a crypto regulatory framework to promote innovation.
Proposed Economic and Political Policies Benefiting Bitcoin and Crypto
Although Trump’s tariffs strategy has sent the dollar to the highest level against the yuan since July. it has been scrutinized to be an inefficient tool as it would burden end consumers in the pursuit of slowing cross-border trade and putting pressure on certain countries to contain the illicit flow of drugs and migration. Nevertheless, other initiatives have been praised to directly benefit the crypto industry in the U.S, while certain broader economic policies are expected to significantly influence the market indirectly:
• Zero Capital Gains Tax for US-Based Crypto Companies: A push to eliminate capital gains taxes could attract more crypto businesses, and investors into the United States.
• Favorable Tax Treatment to Make the U.S. the “Bitcoin Capital of the World”: Proposals may aim to provide preferential tax rates or incentives for crypto-mining operations, particularly those focusing on sustainable energy sources.
• Accelerating Quantitative Easing and Reducing Interest Rates: Trump wants a weaker U.S. dollar in order to boost American exports and make them more attractive. This policy, achieved by lower interest rates and potential quantitative easing, typically increases demand for inflation-resistant assets. The resulting economic liquidity might drive investment towards high-growth assets like Bitcoin.
• Bitcoin Strategic Reserve: While it’s unlikely that Trump’s advertised policy would be adopted in the US, the proposal has nevertheless triggered a global race to adopt Bitcoin as a strategic asset. Brazil and Poland are already moving in this direction, while Pennsylvania is considering legislation to invest up to 10% of its $7B reserves in Bitcoin for inflation hedging and portfolio diversification.
• GDP – Scott Bessent’s economic agenda is what he calls a ”3/3/3” approach to policy: cutting the budget deficit to 3% of GDP, achieving 3% annual growth through deregulation, and boosting domestic oil production by 3 million barrels per day, which could lower energy costs for miners. More importantly, he openly expressed enthusiasm for crypto, viewing it as a critical component of the U.S. economy’s future growth.
• Ending Geopolitical Conflicts and Resolving Supply Chain Disruptions: Efforts to mediate the Russia-Ukraine war and the Israel-Palestine conflict could stabilize global markets and reduce supply chain bottlenecks, particularly in critical trade routes like the Suez Canal. This would lower inflationary pressures and create a more favorable borrowing environment, potentially boosting investments in equities and high-growth assets like crypto.
Figure 1: Polymarket: Will Trump End the War in Ukraine Within 90 Days of Taking Office?
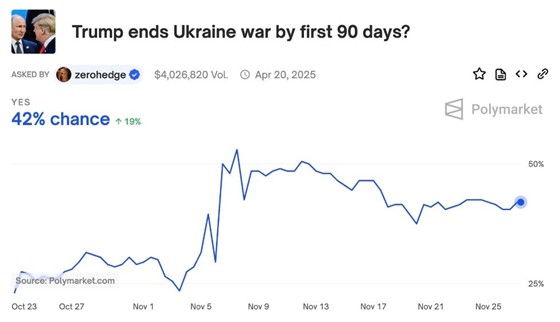
Source: Polymarket
So, despite Bitcoin almost eclipsing the $100K milestone, the market has entered a correction and consolidation period. This downturn can be attributed to several factors:
- Profit-Taking: Traders cashing out after the impressive rally since October.
- Leverage Unwinding: Record-high open interest led to forced position closures as prices dropped to $95K, causing a cascade of liquidations north of $500M.
- Geopolitical Tensions: Escalating Russia-Ukraine conflict, with the U.S. approving long-range missiles for Ukraine and Russia’s subsequent use of its new Oreshnik experimental hypersonic missile.
Thus, despite the market’s temporary pause, the majority of metrics we’ll examine next indicate a healthy Bitcoin ecosystem.
So, what conclusions can we draw from existing data?
MVRV Z-score
The MVRV Z-Score is an on-chain metric that measures the deviation of Bitcoin’s Market Value (current market capitalization) from its Realized Value (aggregate value of all coins at the price they were last moved) in terms of standard deviations from the historical mean.
To simplify, It’s a valuable tool for analyzing Bitcoin market cycles, with scores above 7 typically indicating market tops and below 0 suggesting potential bottoms. Currently, the score of 2.5-3 signals a possible local top, reminiscent of patterns seen before previous price realignments. While this suggests a potential minor correction, it’s important to note that major cycle tops are usually associated with scores near 7. To reach such levels, assuming a constant realized price, Bitcoin would need to surpass $200K.
However, the current market dynamics, including the introduction of US spot Bitcoin ETFs and a high interest-rate environment, may alter the behavior of these metrics compared to previous cycles. This new market regime, characterized by increased institutional demand and constant Bitcoin movement caused by the US spot Bitcoin ETFs, could impact both components of the metric, potentially leading to different dynamic this cycle.
Figure 2: Bitcoin MVRV Z-Score vs Bitcoin Price
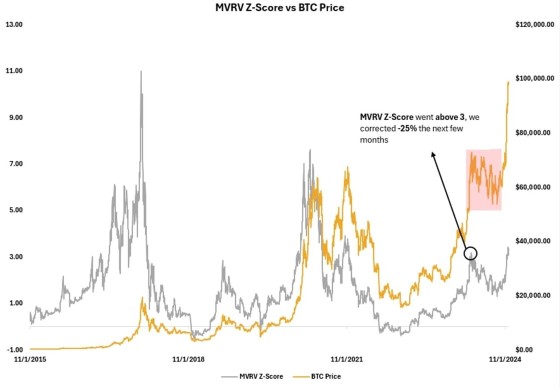
Source: 21Shares, Glassnode
NUPL – Net Unrealized Profit and Loss is an on-chain indicator that measures the difference between the current market value of all Bitcoins and the price at which they were last traded. In simple terms, it shows whether the overall market is in profit or loss if all Bitcoins were sold at the current price.
If NUPL > 0 then it indicates that the market as a whole is in profit, whereas if NUPL < 0, then it suggests that the market is in loss.
Figure 3: Bitcoin Net Unrealized Profit & Loss (NUPL)
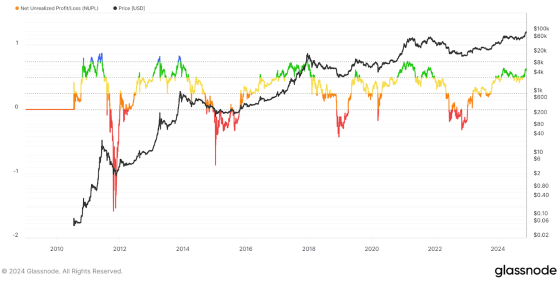
Source: Glassnode
The chart can be broken down into five different categories.
- Red zone (0 and below): Capitulation – strong buying opportunity.
- Orange zone (0 to 0.25): Hope/Fear – potential accumulation phase.
- Yellow zone (0.25 to 0.50): Optimism/Anxiety – market uncertainty.
- Green zone (0.50 to 0.75): Belief/Denial – potential selling opportunity.
- Blue zone (0.75 and above): Euphoria/Greed – market peak, high selling pressure.
Despite Bitcoin nearly reaching $100K, its NUPL remains in the ’Belief’ stage rather than progressing to ’Euphoria’. This suggests that while some profit-taking has occurred above $70K, the current rally still has momentum. The absence of a transition to the ’blue zone’ indicates that the recent selling pressure is likely temporary, with potential for further upside.
NVT Ratio – The Bitcoin Network Value to Transaction (NVT) Ratio is the crypto equivalent of the Price-to-Earnings (P/E) ratio in traditional finance. It compares Bitcoin’s market capitalization to its daily transaction volume, offering insights into the crypto’s valuation relative to its network activity.
Figure 4: 7D Moving Average of Bitcoin’s NVT Ratio
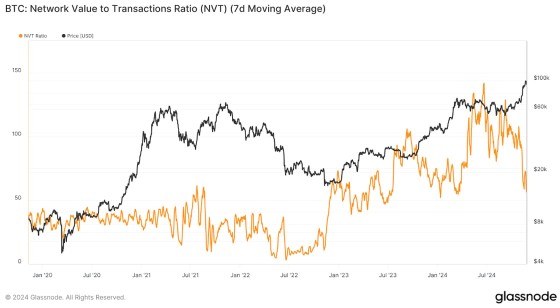
Source: Glassnode
• High NVT: Suggests potential overvaluation; market cap exceeds network usage.
• Low NVT: Indicates possible undervaluation; strong network usage relative to price.
• Stable NVT: Implies balanced growth between price and usage.
Bitcoin’s current valuation appears slightly undervalued compared to early November, despite breaching the previous $70K all-time high. In fact it is experiencing increased network activity, which suggests continued upward momentum. This trend is likely driven by two key factors:
- Newly approved Bitcoin ETFs purchasing BTC from the open market through authorized market makers, which is ultimately settled on the network.
- A noticeable uptick in users engaging with Bitcoin’s on-chain economy.
The latter is facilitated by re-staking platforms like Babylon and the growing adoption of new scaling solutions such as Merlin Chain and Build on Bitcoin (BOB).
In line with this, the growth of Bitcoin’s re-staking economy demonstrates surging demand for the leading crypto. Since the start of August, the total amount of liquid-restaking tokens (LRTs) has skyrocketed by nearly 2000%, expanding from ~2K BTC to approximately 42K BTC by late November.
Figure 5: Total Number of Bitcoin LRT Tokens
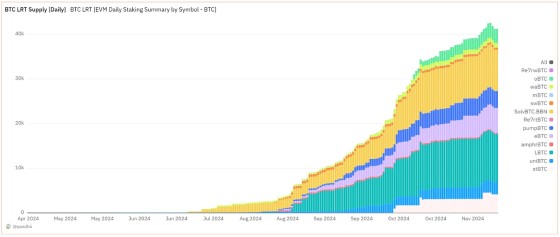
Source: Dune
Similarly, Bitcoin’s Layer 2 solutions have seen significant growth, with an 8% increase in Total Value Locked (TVL) over the past month, reaching 37K BTC (≈$3.5B). Particularly, The BOB protocol, a hybrid L2 built on Optimism but connected to Bitcoin, has been the primary driver, adding nearly 250 BTC in the last 30 days.
Figure 6: Bitcoin Scaling Solution TVL
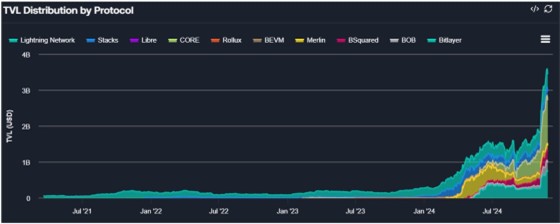
Source: FlipSideCrypto
While these figures may appear modest compared to the ETF flows and long-term holder activity that we cover in the next section, they represent unprecedented BTC usage and highlight the network’s emerging role as a settlement layer for DeFi activities. This trend mirrors Ethereum’s relationship with its L2 ecosystem, positioning Bitcoin as a robust foundation for decentralized financial activities.
Long-Term vs Short-Term Holders
Investors holding assets over 6 months are long-term holders (LTHs), while those under 6 months are short-term holders (STHs). Sustained market rallies require LTHs for stability, but STHs’ fresh capital provides the momentum for continued growth. This LTH-STH dynamic creates a balanced market, combining stability with necessary dynamism.
The recent Bitcoin rally to $99.5K was driven by significant capital inflows, totaling $62.9B in the last 30 days, primarily from ETF inflows and spot market demand. That said, LTHs began profit-taking, selling 128K BTC between October 8 and November 13. Following Trump’s victory, LTHs sold an additional 391K BTC, while STHs acquired 505K BTC over the same period. This dynamic illustrates the ongoing interplay between LTH profit-taking and sustained ETF demand in fueling market growth.
Figure 7: Total Supply of Long vs Short Terms Holders
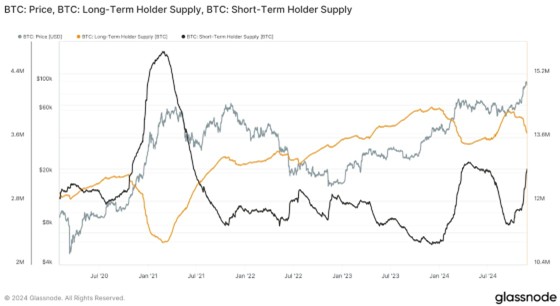
Source: Glassnode
All in all, the key takeaway is STHs have continued accumulating Bitcoin, indicating the market hasn’t peaked, as profit-taking at the $100K psychological milestone—while expected—aligns with past cycles and suggests a natural response rather than a market top. Analogously, while the long-term holder sell-side risk ratio is currently higher than its March peak, it remains well below the levels observed during the market tops of 2017 and 2021, as shown in the chart below.
Figure 8: Bitcoin’s Long Term Holder Sell-Side Risk Ratio
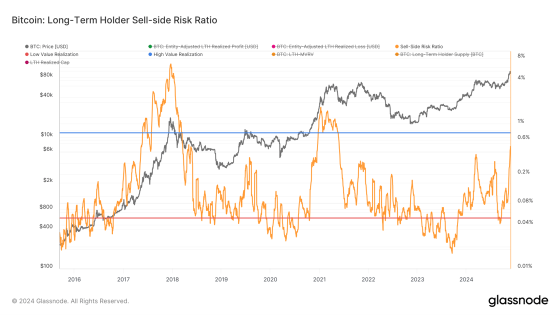
Source: Glassnode
Finally, looking at The Value Days Destroyed (VDD) metric, which compares short-term to annual average Bitcoin spending velocity, gives us further confluence. The metric currently stands at ~1.36, which is well below the 2.9+ threshold, typically indicating market tops. The current VDD suggests we’re not near a market peak or experiencing significant profit-taking by long-term holders, which often precedes major corrections.
Figure 9: Bitcoin’s Value Days Destroyed
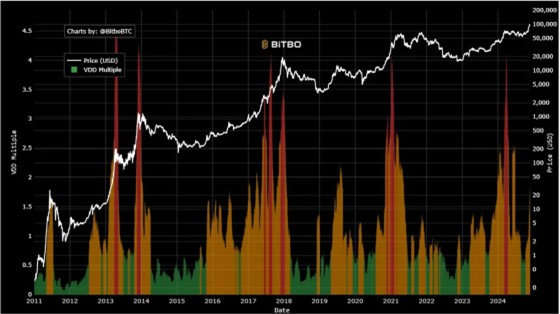
Source: Bitbo.io
Open Interest And Funding Rate
Bitcoin’s derivatives market is exhibiting heightened activity, with open interest recently reaching a record $64 billion as prices touched $99.5K before a correction led to an 8% decline to $59.1 billion, according to Coinglass. The current average funding rate of 0.032, while elevated, is significantly lower than previous peaks – about 50% below March’s 0.069 and 80% less than February 2021’s 0.167, as shown below. Historically, Bitcoin tends to experience temporary deleveraging when funding rates exceed 0.03. However, rates can remain high during extreme bull markets for extended periods, often leading to brief pullbacks before continuing upward.
Thus, the current price action appears healthy, allowing for market structure consolidation and potentially setting the stage for the next upward move. This could coincide with the Christmas period and the lead-up to Trump’s inauguration, as traders may position themselves to capitalize on the anticipated excitement surrounding his return to the White House.
Figure 10: Bitcoin’s 3M Annualized Perpetual Funding Rate
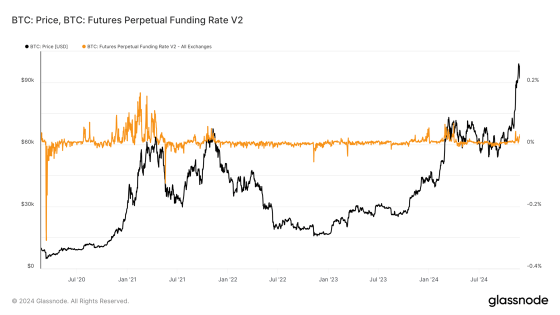
Source: Glassnode
Fear and Greed Index
The Fear & Greed Index has dropped from 90 to 79 this week, remaining in the extreme greed range and reflecting strong market confidence. While this optimism suggests continued upward momentum for Bitcoin and other cryptoassets, it also signals potential for increased volatility. Investors should stay cautious, as extreme greed can persist while prices keep climbing, as shown in Figure 11.
Figure 11: Bitcoin Fear & Greed Index
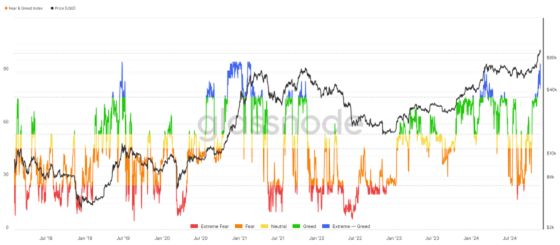
Source: Glassnode
So, What Are Our Expectations Moving Forward?
In conclusion, Bitcoin may enter a period of sideways movement, with a potential correction toward $80K. However, the holiday season could reignite momentum, with Christmas acting as a catalyst to push past $100K, much like December 2020, when holiday optimism drove Bitcoin to double its previous all-time high.
Looking ahead, we expect Bitcoin to retest and surpass $100K as investors position for the presidential inauguration. Similar preemptive moves around Election Day sparked rapid price gains, and this consolidation phase is likely just the setup for Bitcoin’s next significant growth phase.
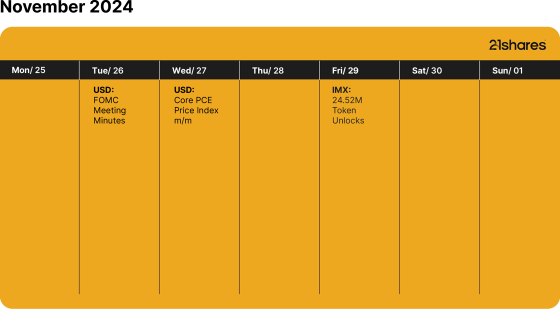
What’s happening this week?
Research Newsletter
Each week the 21Shares Research team will publish our data-driven insights into the crypto asset world through this newsletter. Please direct any comments, questions, and words of feedback to research@21shares.com
Disclaimer
The information provided does not constitute a prospectus or other offering material and does not contain or constitute an offer to sell or a solicitation of any offer to buy securities in any jurisdiction. Some of the information published herein may contain forward-looking statements. Readers are cautioned that any such forward-looking statements are not guarantees of future performance and involve risks and uncertainties and that actual results may differ materially from those in the forward-looking statements as a result of various factors. The information contained herein may not be considered as economic, legal, tax or other advice and users are cautioned to base investment decisions or other decisions solely on the content hereof.


Fastställd utdelning i MONTDIV april 2025

WELG ETF en satsning på healthcareföretag världen över
Amundi noterar ETF för globala företagsobligationer

JLOC ETF är obligationer från emerging markets i lokal valuta

Robeco lanserar aktivt förvaltad ETF på Xetra
Crypto Market Risks & Opportunities: Insights on Bybit Hack, Bitcoin, and Institutional Adoption

Montrose storsatsning på ETFer fortsätter – lanserar Sveriges första globala ETF med hävstång

Svenskarna har en ny favorit-ETF

MONTLEV, Sveriges första globala ETF med hävstång

Sju börshandlade fonder som investerar i försvarssektorn
-

 Nyheter4 veckor sedan
Crypto Market Risks & Opportunities: Insights on Bybit Hack, Bitcoin, and Institutional Adoption
-
 Nyheter3 veckor sedan
Montrose storsatsning på ETFer fortsätter – lanserar Sveriges första globala ETF med hävstång
-
 Nyheter4 veckor sedan
Svenskarna har en ny favorit-ETF
-
 Nyheter3 veckor sedan
MONTLEV, Sveriges första globala ETF med hävstång
-
 Nyheter3 veckor sedan
Sju börshandlade fonder som investerar i försvarssektorn
-

 Nyheter2 veckor sedan
Världens första europeiska försvars-ETF från ett europeiskt ETF-företag lanseras på Xetra och Euronext Paris
-

 Nyheter3 veckor sedan
Europeisk försvarsutgiftsboom: Viktiga investeringsmöjligheter mitt i globala förändringar
-

 Nyheter2 veckor sedan
21Shares bildar exklusivt partnerskap med House of Doge för att lansera Dogecoin ETP i Europa