
Nyheter
Is Sui a Solana Killer?
While the markets were busy turmoiling, one rising decentralized settlement layer made 89% in weekly gains since Monday, August 5. Sui is a smart-contract platform blockchain focused on processing transactions faster.
Sui’s mainnet went live in May 2023 and has since attracted millions of users by offering an intuitive experience akin to popular Web 2 applications like Facebook. It achieves this by allowing users to create wallets with familiar credentials such as Gmail accounts and Face ID, eliminating the need for seed phrases, and simplifying transactions through QR codes. Interestingly, the developers behind Sui used to work at Meta (previously Facebook) to build their crypto wallet Novi, which sunset in September 2022.
But what happened last week that made Sui rally to almost double in price?
• August 6: Sui’s mainnet was successfully upgraded to Mysticeti, after launching it on the testnet in May, making it officially faster than Solana in theory (65,000 TPS vs. Sui’s 297,000 TPS).
• August 7: Grayscale introduced its SUI Trust for eligible individual and institutional accredited investors.
Figure 1 – Daily Price Performance of SUI and SOL
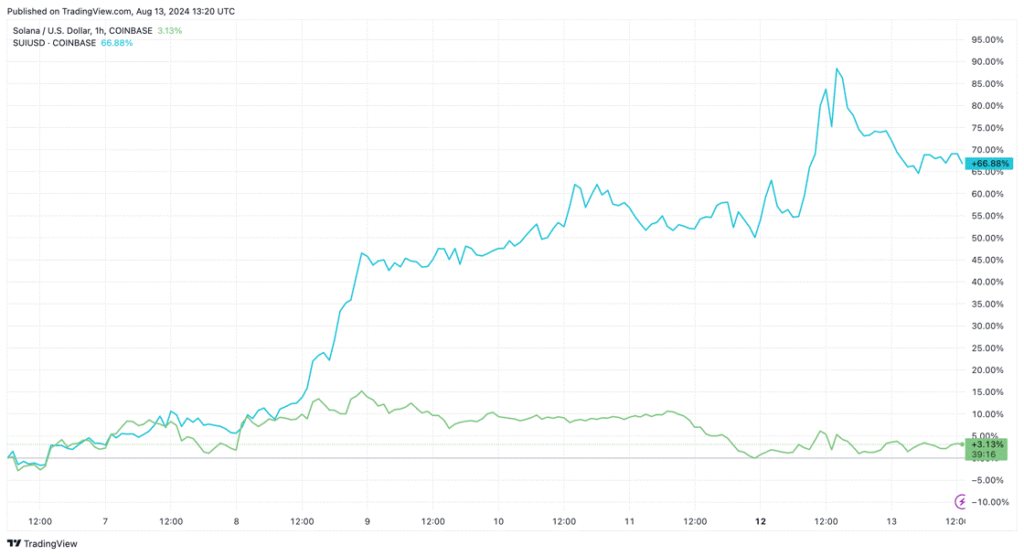
Source: TradingView
As explained in our last newsletter, when the Bank of Japan hiked interest rates, markets experienced a simultaneous selling pressure that brought the crypto market cap down by 17% overnight. When compared with other assets, Sui was largely unaffected and came out as one of the biggest beneficiaries, as shown in Figure 1.
In the past, the question on everyone’s mind was: “Will Solana overtake Ethereum?” But now, a new challenge emerges: Could Sui overtake Solana? That’s the 68 billion dollar* question.
*Solana’s market cap: $68,832,842,930
The Answer Is in the Fundamentals: the Leading Indicator
Because past performance isn’t indicative of future price movements, it’s worth focusing on the development being worked on in the backend of each cryptoasset, in addition to some market indicators. By doing that, investors will be able to gauge the real value beyond any exaggerated hype or volatility.
Sui’s Catalysts:
• Mysticeti upgrade cuts down latency to 390 milliseconds and reduces hardware requirements for Sui validators.
• Architecture: As a refresher, Sui’s high performance is primarily due to its parallel transaction execution as opposed to the linear standard.
• Low fees: Sui’s gas-pricing mechanism delivers low, predictable transaction fees, even when network demand is high, incentivizing validators to optimize their transaction processing operations and preventing denial of service attacks.
Solana’s Catalysts:
• Solana ETF soon in Brazil: The Brazilian securities regulator approved the country’s first Solana exchange-traded fund (ETF) on August 7, however it still needs to be greenlit by the stock exchange B3.
• Network security is getting more proactive. On August 9, Solana developers, validators, and client teams addressed a critical security vulnerability by securing a supermajority of its network stake before publicly disclosing the issue.
• Thriving DeFi ecosystem: Solana’s decentralized applications (dApps) have made strides in terms of adoption and fee generation, surpassing even Ethereum’s pioneering ecosystem. Solana’s Decentralized Exchange (DEX) volume made it the network of choice for on-chain trading activity. For example, at the height of Solana’s activity on March 18, 2024, DEX volume reached over $7B.
In terms of countering network congestion and encouraging validators, Jito is a high-performance block builder for Solana that allows validators to increase their rewards while reducing network congestion. Tips paid through Jito can be used as a proxy for Solana’s financial opportunities. Thanks to Solana’s thriving ecosystem, as shown in the chart below, Jito validator tips reached an all-time high of 17,290 SOL (approximately $3.19M) on July 27. For context, at around the same time, 68K tokens were minted on Solana.
Figure 2 – Jito Validator Tips
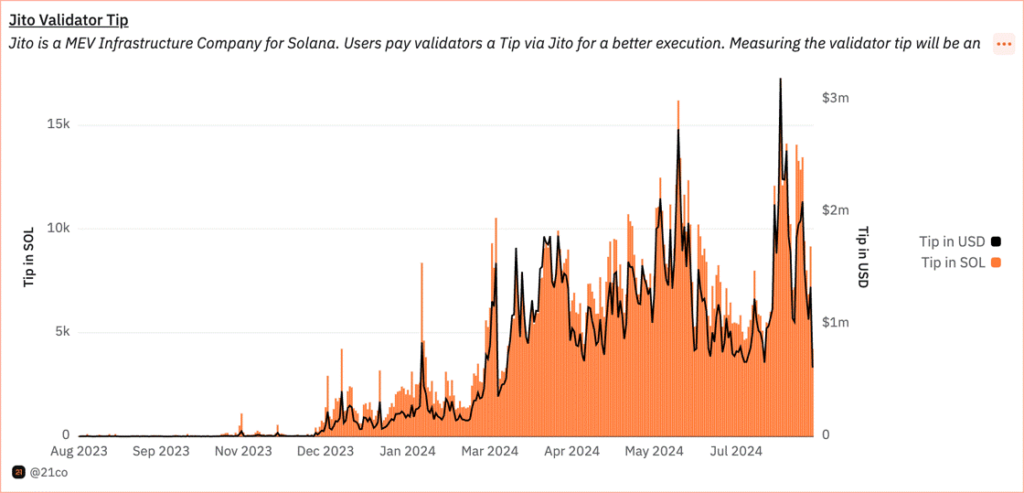
Source: 21co on Dune Analytics
With just a hundred validators verifying transactions on Sui’s network, Solana would be at an advantage with 1,500 validators on its network, making it more decentralized. However, it’s important to note that Sui’s mainnet just turned 1 this May; it may be too soon to judge. Solana’s network has been live since March 2020.
Nevertheless, we broke down some on-chain metrics that measure the fundamentals of both high-performance settlement layers.
Does Sui Have What it Takes?
Total Value Locked (TVL) is a measure of the overall value of assets locked in a smart contract or DeFi platform, and can be thought of as the crypto-equivalent of assets under management. On this front, Sui has recently seen a massive jump. In dollar terms, Sui’s TVL has catapulted from $498.65M last Monday, to $902.2M yesterday!
Figure 3 – SUI Total Value Locked
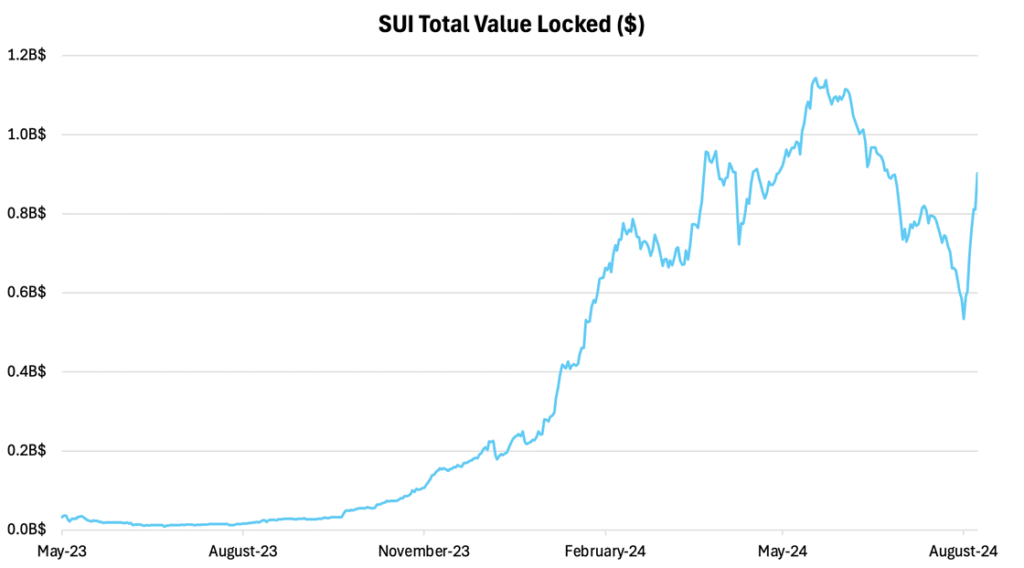
Source: DefiLlama, 21Shares
That is an 81% increase in just 8 days. However, in SUI terms, the TVL only grew by 2.4%. The surge in TVL was driven by SUI’s largest money market protocol Navi protocol – reaching an all-time high in its total value to grow by $100M in less than 5 days.
Figure 4 – SOL vs. SUI Total Value Locked

Source: DefiLlama, 21Shares
As can be seen in the chart above, Sui still has a long way to go to catch up to Solana, which currently has a TVL of $10.39B, up 922% since Sui’s inception in May 2023. Furthermore, Solana’s massive TVL dwarfs Sui by a factor of 11.5X. To catch up to Solana, or eventually topple it, Sui needs to find its product-market fit similar to how Solana has. Solana’s TVL growth is a testament to its ability to capture user attention and its growing importance in the space as a fast, cheap, and scalable settlement network.
Nevertheless, Sui had an impressive leap in terms of active addresses towards the end of May this year, when it sprung to a peak of 2.2M daily users, beating Solana’s 1.4M on May 23rd.
Figure 5 – SOL vs. SUI Daily Active Addresses
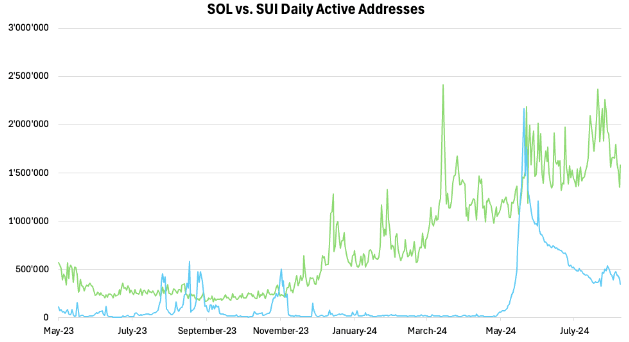
Source: Artemis, 21Shares
Looking at the chart, one thing becomes clear. Sui’s traction is largely driven by spikes in activity, such as those seen in August 2023, November 2023 and May 2024. The latest jump associated with the deployment of Mysticeti on testnet, has led to a stickier user base, evidenced by the subsequent drop-off being a lot slower.
That said, Solana has a much more sustained growth in active addresses. In order for Sui to gain greater adoption, it needs to find a consistency to sustain further growth. This trend is also witnessed in Sui and Solana’s daily transactions.
Figure 6 – SOL vs. SUI Daily Transactions

Source: Artemis, 21Shares
The graph above paints a similar picture, of Sui needing to sustain activity over a longer period, in order to build a healthy user base that can help spur the network into the mainstream.
For this to happen, developer activity to ship new features is crucial. On this front, Sui is well positioned. They have a dedicated team at Mysten Labs, fully focused on creating foundational infrastructure for Web3, composed of highly skilled former Meta executives. Their release of Sui Move, the project’s native programming language focused on augmenting transaction throughput via parallelized transactions, underscores their dedication to the space.
Figure 7 – SOL vs. SUI Number of Code Commits
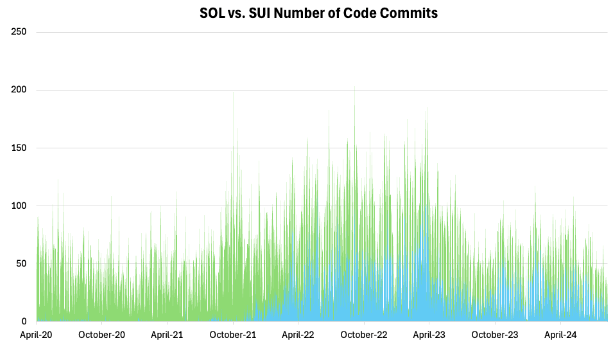
Source: TokenTerminal, 21Shares
Figure 8 – SOL vs. SUI Number of Core Developers

Source: TokenTerminal, 21Shares
As shown above, in recent months Sui has kept an active developer ecosystem similar to the size of Solana. It is important to note while Sui’s code commits are still slightly lagging behind Solana’s, the retention of Sui developers is crucial to the network’s ability to ship new features to its user base. On the other hand, Solana has lost nearly half of their developer count since October 2021, as developers potentially seek alternative opportunities.
Despite the question marks surrounding Sui’s adoption levels, the one angle it beats Solana in is in its affordability. Both Solana and Sui promise low-cost, high-throughput solutions, but as can be seen below, Sui’s average transaction fees remain a lot lower, consistently under the $0.02 mark. The only time Sui’s transaction fees were consistently higher than Solana’s was around May 2023, when the Sui network had just launched!
Figure 9 – SOL vs. SUI Average Transaction Fees
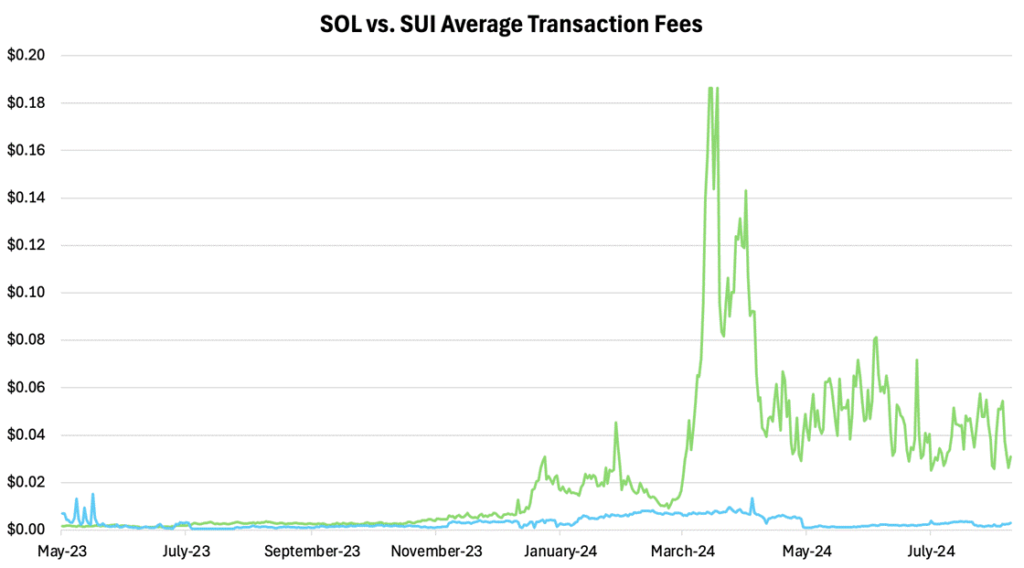
Source: Artemis, 21Shares
It can be argued that this is due to Sui’s relatively lower activity than Solana. However, a closer look tells us that even during Sui’s surge in transactions in May, the average transaction fee didn’t spike but decreased! The opposite is true for Solana. During the peak of the Solana-based memecoin craze in March this year, active addresses surged to nearly 2.5M, and transaction fees followed by peaking to around $0.18, which is more than 9X what it costs to transact on Sui.
That said, Sui does have significantly lower adoption at the moment, hence the limits of its affordability and congestion are likely yet to be battle-tested. To fully understand the ability of Sui, it is necessary to gauge its upkeep and throughput performance during a moment of heightened activity, which relative to Solana, is yet to occur for the network.
What Does This Mean for Investors?
Nevertheless, with a loyal developer base and key features of low cost and high speed, Sui is well positioned to eat into Solana’s market share as an even leaner settlement layer. Sui may serve as a viable investment for investors looking for a higher-risk play, given its 1.23 beta to Solana, and as a potential satellite investment to complement an investor’s crypto portfolio.
For investors interested in investing in Solana via a regulated investment vehicle, the following ETPs are available on the European market.
Figure 10 – Top 5 European Solana ETPs by Assets under Management
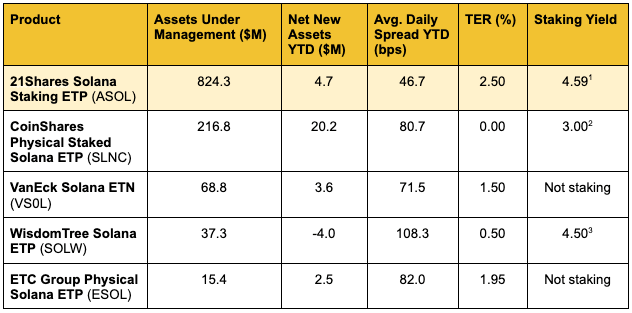
Source: Bloomberg, Data as of August 13, 2024.
Avg. Daily Spread YTD (bps): refers to the best daily average bid/ask spread this year across European exchanges.
Staking Yields: 1) 30D Trailing Yield (Annualized) 2) Fixed Annualized Rate 3) Rolling 3M (Annualized)
Off the back of Sui’s growth this year, 21Shares has made a solution available for European investors looking to allocate Sui via a regulated investment vehicle: ASUI. This is the only Sui ETP available on the European market!
Figure 11 – European Sui ETPs
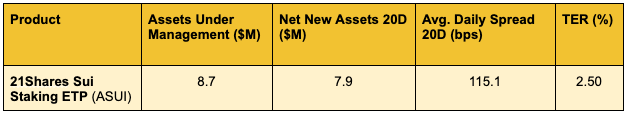
Source: Bloomberg, Data as of August 13, 2024.
Avg. Daily Spread 20D (bps): refers to the best daily average bid/ask spread over the last 20 days across European exchanges.
This Week’s Calendar
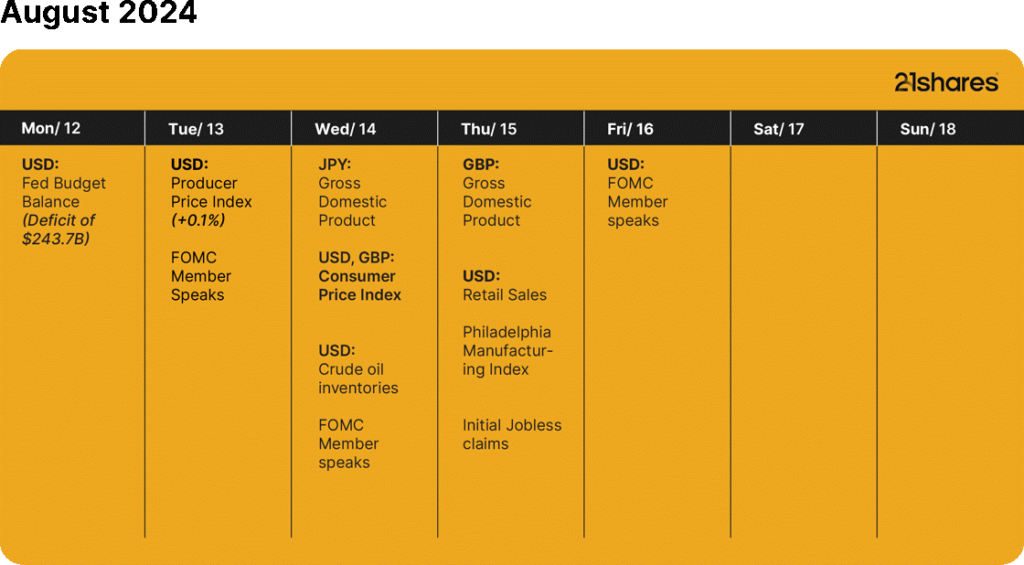
Source: Forex Factory, 21Shares
Research Newsletter
Each week the 21Shares Research team will publish our data-driven insights into the crypto asset world through this newsletter. Please direct any comments, questions, and words of feedback to research@21shares.com
Disclaimer
The information provided does not constitute a prospectus or other offering material and does not contain or constitute an offer to sell or a solicitation of any offer to buy securities in any jurisdiction. Some of the information published herein may contain forward-looking statements. Readers are cautioned that any such forward-looking statements are not guarantees of future performance and involve risks and uncertainties and that actual results may differ materially from those in the forward-looking statements as a result of various factors. The information contained herein may not be considered as economic, legal, tax or other advice and users are cautioned to base investment decisions or other decisions solely on the content hereof.


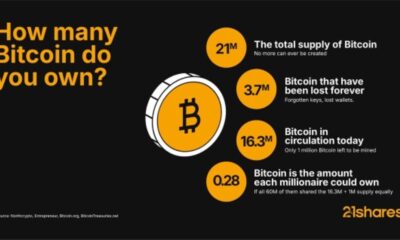

Even buying Bitcoin at its yearly peak since 2020 would still have doubled your investment, proving the power of long-term growth versus trying to time the market.


Why Solana matters: Exploring its use cases and growing adoption
Solana’s surge isn’t just market speculation; it’s driven by real-world adoption. From payments and DeFi to tokenization, the blockchain is seeing record engagement, reflected in its all-time high total value locked (TVL).


How Raydium and Jupiter are powering Solana DeFi
Raydium and Jupiter are the pillars of Solana’s DeFi ecosystem, delivering deep liquidity, seamless trading, and efficient execution that keep the network thriving. They make crypto markets faster, cheaper, and more accessible for everyone.


Research Newsletter
Each week the 21Shares Research team will publish our data-driven insights into the crypto asset world through this newsletter. Please direct any comments, questions, and words of feedback to research@21shares.com
Disclaimer
The information provided does not constitute a prospectus or other offering material and does not contain or constitute an offer to sell or a solicitation of any offer to buy securities in any jurisdiction. Some of the information published herein may contain forward-looking statements. Readers are cautioned that any such forward-looking statements are not guarantees of future performance and involve risks and uncertainties and that actual results may differ materially from those in the forward-looking statements as a result of various factors. The information contained herein may not be considered as economic, legal, tax or other advice and users are cautioned to base investment decisions or other decisions solely on the content hereof.


Time in Bitcoin beats timing Bitcoin

WMMV ETF en lågvolatilitetsfond som handlas i euro och pund
UBS AM lanserar UBS Treasury Yield Plus ETFer
COINUNI ETP spårar kryptovalutan Uniswap

ETF- och ETP-noteringar den 16 september 2025: nytt på Xetra och Börse Frankfurt

Utdelningar och försvarsfonder lockade i augusti

Månadsutdelande ETFer uppdaterad med IncomeShares produkter

HANetfs analyserar hur ett fredsavtal kan påverka det europeiska försvaret

ADLT ETF investerar bara i riktigt långa amerikanska statsobligationer

Septembers utdelning i XACT Norden Högutdelande
-
 Nyheter3 veckor sedan
Utdelningar och försvarsfonder lockade i augusti
-
 Nyheter4 veckor sedan
Månadsutdelande ETFer uppdaterad med IncomeShares produkter
-
 Nyheter4 veckor sedan
HANetfs analyserar hur ett fredsavtal kan påverka det europeiska försvaret
-
 Nyheter4 veckor sedan
ADLT ETF investerar bara i riktigt långa amerikanska statsobligationer
-
 Nyheter2 veckor sedan
Septembers utdelning i XACT Norden Högutdelande
-

 Nyheter3 veckor sedan
Fastställd utdelning i MONTDIV augusti 2025
-

 Nyheter2 veckor sedan
HANetf kommenterar mötet mellan Kina, Ryssland och Nordkorea vid militärparad
-

 Nyheter4 veckor sedan
AICT ETF investerar i obligationer utgivna av företag från tillväxtmarknader