
Nyheter
Have We Reached This Cycle’s Peak Yet?
As the crypto market navigates recent bearish macro-led developments, it’s essential to explore key on-chain metrics that can signal whether we’ve reached a market cycle peak. Despite Bitcoin’s dominance dipping slightly to 58%, it remains the industry’s bellwether. Thus, by analyzing Bitcoin’s on-chain activity and investor behavior, we can gain valuable insights into the market’s overall health and potential trajectory, helping us determine whether we’ve reached a cycle peak or if there’s still room for growth.
That said, last week’s market downturn was fueled by a combination of macroeconomic and market-specific pressures that rattled investor confidence. The Federal Reserve’s hawkish stance, underpinned by stronger-than-expected U.S. economic data, raised doubts about rate cuts in 2025. Further exacerbating the sell-off, news of a U.S. court approving the potential $6.5B Bitcoin sale from seized Silk Road assets heightened oversupply concerns. This led Bitcoin to drop to the $97K range last week, with a brief dip below $90K earlier this Monday. However, on-chain data indicates the sell-off was largely driven by short-term traders, with 86% of moved assets coming from wallets holding BTC for less than a week.
With all of this in mind, let’s tackle the metrics that shed light on where we might be in the cycle:
1) MVRV-Z Score
Top Signal: Medium
The MVRV Z-Score is an on-chain metric that measures how far Bitcoin’s market value, representing its total capitalization, deviates from its realized value, which reflects the cumulative value of all coins at their last movement price, expressed in standard deviations from the historical mean.
The MVRV Z-Score is a key indicator for analyzing Bitcoin market cycles, where scores above 7 typically signal market tops and values below 0 suggest potential bottoms. At present, the score sits between 2.5 and 3, indicating a possible local top—reminiscent of patterns observed before previous halvings. While this points to the potential for a minor correction, major cycle tops are historically associated with scores near 7. To reach such levels, and assuming the realized price remains constant, Bitcoin would need to exceed $200K.
However, the current market dynamics, including the introduction of U.S. Spot Bitcoin ETFs and a high interest-rate environment, may shift the behavior of key metrics compared to previous cycles. This evolving regime—marked by increased institutional demand and continuous Bitcoin movement driven by Spot ETFs—could alter both components of these metrics, potentially creating new patterns in this cycle. Furthermore, the supportive stance of the incoming presidential administration, which has legitimized the asset through favorable policies, could accelerate growth and foster a more robust market environment for Bitcoin, pushing beyond what we have seen up until now.
Figure 1: Bitcoin MVRV Z-Score vs Bitcoin Price
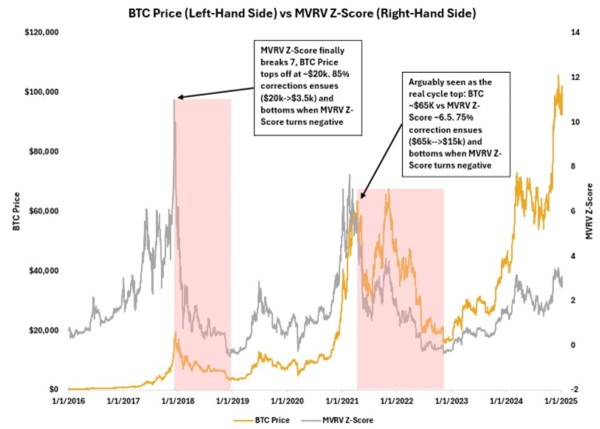
Source: 21Shares, Glassnode
2) NUPL
Top Signal: Low
NUPL (Net Unrealized Profit and Loss) is an on-chain metric that evaluates the difference between Bitcoin’s current market value and the aggregate value at which all assets were last moved. In simpler terms, it indicates whether the market as a whole is in a state of profit or loss if all Bitcoin were sold at the current price.
If NUPL is greater than 0, it indicates that the market as a whole is in profit. Conversely, if NUPL is less than 0, it suggests that the market is operating at a loss.
Figure 2: Bitcoin Net Unrealized Profit & Loss (NUPL)
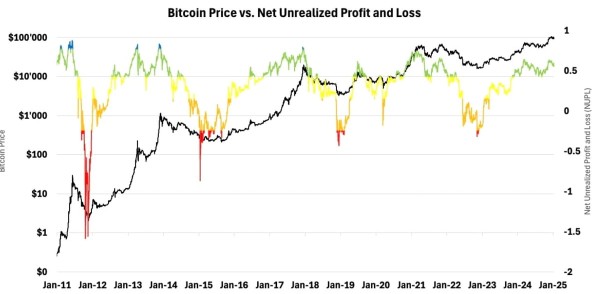
Source: 21Shares, Glassnode
The chart can be further broken down as described below:
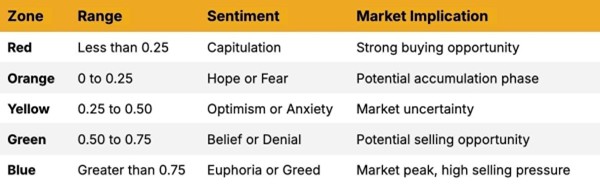
Despite Bitcoin trading near $100K, its NUPL remains in the ’Belief’ stage rather than progressing to ’Euphoria.’ This suggests that while some profit-taking has occurred above $90K, the current rally still has momentum. The absence of a transition to the ’blue zone’ indicates that the recent selling pressure is likely temporary, with potential for further upside.
3) Bitcoin Terminal Price
Top Signal: Low
The Terminal Price indicator provides a unique perspective on Bitcoin’s market dynamics by incorporating the concept of Coin Days Destroyed (CDD). CDD measures economic activity within the Bitcoin network by analyzing the volume of coins moved relative to their dormancy period. This means coins that have remained untouched for longer periods carry more weight in the calculation, effectively highlighting the behavior of seasoned, long-term investors—often regarded as ”smart money.”
The Terminal Price takes this concept further by using the transferred price (a value derived from CDD and the current Bitcoin supply) and multiplying it by 21, creating a normalized terminal value. Historically, this indicator has proven to be a reliable tool for identifying Bitcoin’s price cycle peaks, offering a framework to assess market tops and overheated conditions.
As shown in Figure 3, the Terminal Price has historically served as a reliable price ceiling, marking market tops in early 2014, late 2017, and mid-2021. Currently, with the Terminal Price estimated at $180K, this suggests that Bitcoin retains significant growth potential before approaching levels historically associated with market cycle peaks.
Figure 3: Bitcoin Terminal Price
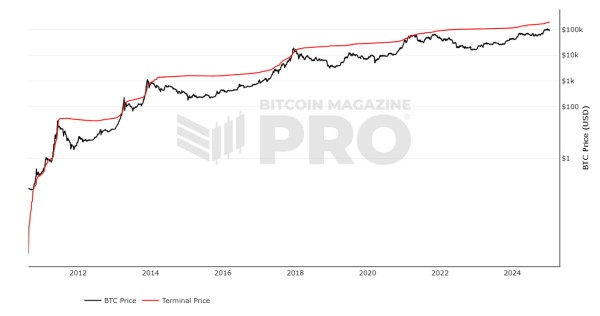
Source: Bitcoin Magazine Pro
4) Puell Multiple
Top Signal: Medium
The Puell Multiple, a key metric tracking miner behavior, evaluates their profitability by comparing the daily value of newly issued Bitcoin against its 365-day moving average. This indicator is instrumental in identifying periods of significant miner income fluctuations, which can influence their decision to sell.
Historically, high values (above 4) indicate above-average miner profitability, often triggering increased selling activity. Conversely, low values (below 0.5) signal miner income stress, typically aligning with market bottoms and presenting potential buying opportunities.
Bitcoin’s current Puell Multiple of 1.34 reflects a relatively low level, which could be attributed to earlier miner selling pressure during the pre-halving all-time high of $73K in March 2024—an unusual event typically seen in post-halving cycles. At that time, the indicator reached 2.3, indicating that a significant portion of miner profitability-driven selling may have already occurred.
This suggests that the Puell Multiple may have already peaked earlier this year, as it has consistently formed lower highs over time. As a result, this metric is quite insightful as it indicates that the expected surge in miner selling pressure may have already played out while signaling potential room for growth as selling overhang from miners diminishes, paving the way for a healthier market dynamic. The caveat here is the arrival of ETFs, which now hold over 5% of Bitcoin’s total supply at around 1.1M BTC, introduce a powerful new source of sustained buying pressure. This influx effectively offsets the selling pressure from miners, who collectively hold around 1.8M BTC, creating a more balanced market environment.
Figure 4: Bitcoin Puell Multiple

Source: Coinglass
5) Pi Cycle Top
Top Signal: Low
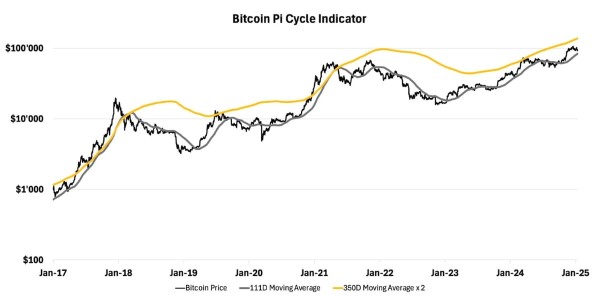
The Bitcoin Pi Cycle Top Indicator is a technical metric designed to identify potential market peaks by analyzing the relationship between the 111-day moving average (111DMA) and twice the 350-day moving average (350DMA x 2). Historically, when the 111DMA approaches or crosses the 350DMA x 2, it signals an overheated market state, often preceding the cycle’s peak. Notably, this indicator has accurately pinpointed the top of previous Bitcoin market cycles within three days.
Currently, the 350DMA stands at $137K, while the 111DMA is at $83K, suggesting the market still has substantial growth potential before entering the overheated phase. This implies that the cycle top is not yet imminent, providing room for further upward movement.
Figure 5: Bitcoin Pi Cycle Top Indicator
Source: 21Shares, Glassnode
However, it’s important to account for the evolving nature of the Bitcoin market. While the Pi Cycle Top Indicator has been a reliable tool during Bitcoin’s growth phase, its relevance may be shifting as the asset transitions into a broader adoption phase. This new era is defined by factors such as institutional involvement, widespread adoption, and an influx of capital through instruments like ETFs, which could reshape the dynamics of Bitcoin’s cyclical behavior.
6) Long-Term Holders Sell-Side Risk Ratio
Top Signal: Medium
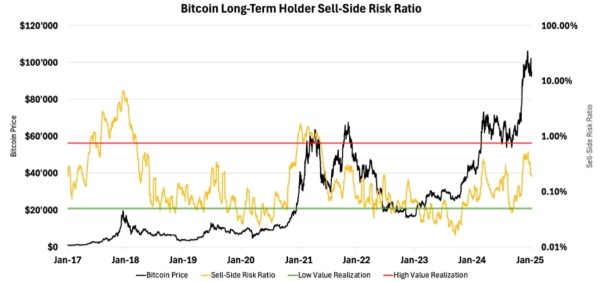
This metric measures the ratio of total realized profits and losses to the realized market capitalization of Bitcoin’s long-term holders. Elevated values are typically observed during late-stage bull markets and are associated with heightened volatility and increased selling pressure from whales and long-term holders. Therefore, the market is considered to be entering an overheated state when this ratio approaches or exceeds 0.8%. As such, rising levels of distribution can serve as an early indicator of market exhaustion and potential trend reversals.
In March 2024, Bitcoin’s ratio reached 0.35%, aligning with the local cycle top at $73K. It climbed again to 0.43% as Bitcoin hit $106K in mid-December. However, when compared to previous cycles, these values remain below the levels typically seen at major market peaks. This suggests that Bitcoin has not yet entered the euphoric stage of the cycle, indicating that the peak of this bull market is likely still ahead.
Figure 6: Bitcoin Long-Term Holder Sell-Side Risk Ratio
Source: 21Shares, Glassnode
7) Altcoin Season Index
Top Signal: Low
Following the pullback in Bitcoin’s dominance throughout December, many expected altcoins to rally in the coming weeks. However, this hasn’t materialized yet, as over $400B was wiped from total market capitalization since the beginning of January. This broad decline underscores the negative sentiment currently gripping the crypto market.
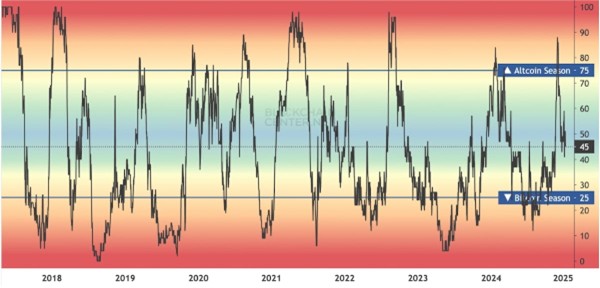
Figure 7: Altcoin Season Index
Source: BlockchainCenter
The Altcoin Season Index measures whether altcoins have outperformed Bitcoin over a 90-day period. Historically, this phase aligns with euphoric market conditions when profits rotate from Bitcoin into other cryptoassets, driving significant gains across the latter tail. Currently, the index sits at 47, well below the threshold of 75 that signals Altcoin Season. While we briefly touched this level following the election, previous cycles have seen far more prolonged and intense dominance than the fleeting uptick observed in early December.
This underscores the continued underperformance of altcoins and their widespread participation in the market’s downturn. Nevertheless, there’s potential for a shift as conditions stabilize. As Bitcoin regains momentum, it could pave the way for altcoins to drive broader market growth, signaling the start of the latter stage of the cycle.
8) Google Trends Popularity
Top Signal: Medium
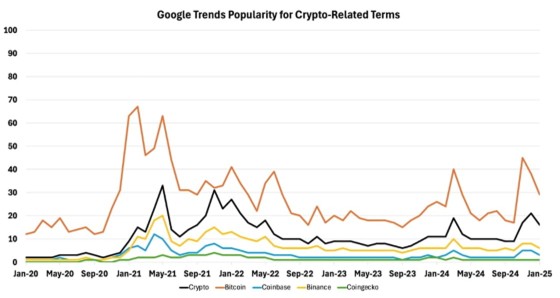
While not an on-chain indicator, Google Trends data offers valuable insights into retail interest in crypto. It tracks search interest on a scale from 0 to 100, with 100 representing peak popularity and 0 indicating minimal or no interest.
Figure 8: Google Trends Popularity for Crypto-Related Terms
Source: 21Shares, Google
Current Google Trends data for crypto-related searches reveals that retail interest remains far below the peaks of the 2021 bull market. Although there was a brief spike during the recent election—understandably so, given crypto’s unprecedented presence in political discourse—this uptick failed to sustain broader engagement.
Some might argue that retail investors onboarded during previous cycles explain the muted search activity. However, with crypto’s increasing mainstream adoption over the past year, we anticipate a wave of new retail investors entering the market. This surge of interest should drive search volumes higher, potentially exceeding the 2021 highs and a key precursor of heightened activity.
Given that current search interest is still well below prior levels, it’s reasonable to infer that this market has significant room for growth. However, to trigger this influx of retail participation, a strong catalyst is needed to reignite public enthusiasm.
9) Crypto Liquidity
Top Signal: Low
Stablecoin supply acts as a crypto-equivalent of deployable capital—a barometer of liquidity within the cryptoasset ecosystem. Historically, market tops are followed by a significant reduction in stablecoin liquidity as funds are withdrawn from the crypto space.
However, the current cycle presents a stark contrast. Despite recent market volatility, stablecoin supply is reaching all-time highs around $200B, reflecting robust liquidity and signaling a significant amount of dry powder still in play. In fact, the only notable contraction in the stablecoin market cap this cycle came from the implementation of MiCA regulations in Europe, which prompted the delisting of some stablecoins from EU-based exchanges, but ultimately led to reallocation to other stables across several jurisdictions.
This sustained growth in stablecoin supply suggests there is still considerable buying power on the sidelines. With liquidity remaining abundant, the stage could be set for another leg up in this cycle as capital flows back into the market.
Figure 9: Total Stablecoins Supply
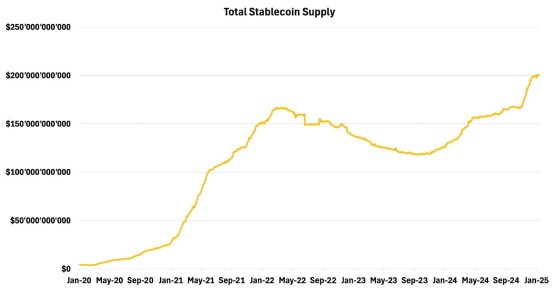
Source: 21Shares, Artemis
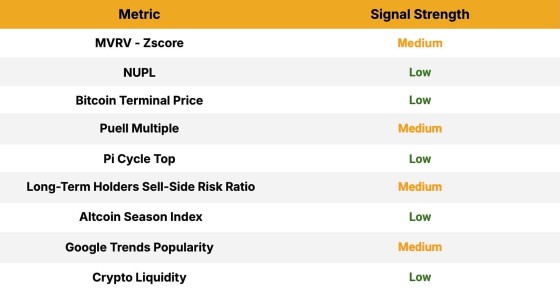
Overall, while some of the metrics discussed are approaching elevated levels, most remain below the thresholds typically seen in the late stages of a bull cycle that precede significant market downturns. It’s also worth noting that during bull cycles, markets often remain in overheated conditions longer than expected. As such, investors should exercise caution but also recognize the unique dynamics at play, particularly as we enter what could be a landmark year for crypto, driven by the new administration and its anticipated second-order effects. Lastly, no single metric should be analyzed in isolation; a comprehensive assessment of market health requires combining multiple indicators to ensure sufficient confluence.
Figure 10: Signal Summary Table
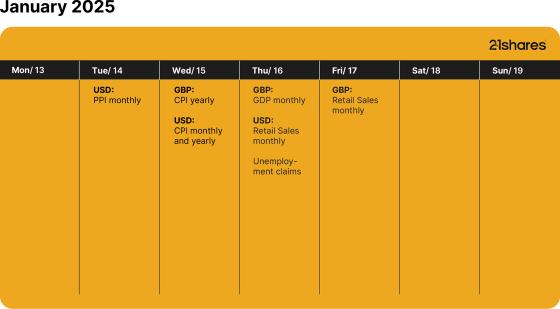
What’s happening this week?
Research Newsletter
Each week the 21Shares Research team will publish our data-driven insights into the crypto asset world through this newsletter. Please direct any comments, questions, and words of feedback to research@21shares.com
Disclaimer
The information provided does not constitute a prospectus or other offering material and does not contain or constitute an offer to sell or a solicitation of any offer to buy securities in any jurisdiction. Some of the information published herein may contain forward-looking statements. Readers are cautioned that any such forward-looking statements are not guarantees of future performance and involve risks and uncertainties and that actual results may differ materially from those in the forward-looking statements as a result of various factors. The information contained herein may not be considered as economic, legal, tax or other advice and users are cautioned to base investment decisions or other decisions solely on the content hereof.


Since U.S. President Donald Trump announced tariffs on April 2, termed ”Liberation Day,” global markets have experienced significant volatility. The S&P 500 shed $5.83 trillion in market value over just four days, marking its steepest drop since the 1950s. Asian markets saw their worst session since 2008, reflecting widespread fears of an economic slowdown.
The U.S. 10-year Treasury yields initially fell below 4% as investors sought safety, but by April 8-9, they surged to a seven-week high of 4.515%. This spike, driven by bond market sell-offs potentially from basis trading or China’s strategic moves to pressure U.S. negotiations, suggests a precarious economic situation rather than risk-on sentiment.
On April 9, President Trump announced a 90-day pause on tariffs for most countries (excluding China, where tariffs jumped to 145%) in an effort to give markets time to absorb the changes and calm volatility. The move sparked a broad rally, with the S&P 500 surging 9.5% for its best day since 2008 and Bitcoin rebounding above $80,000 after a turbulent stretch.
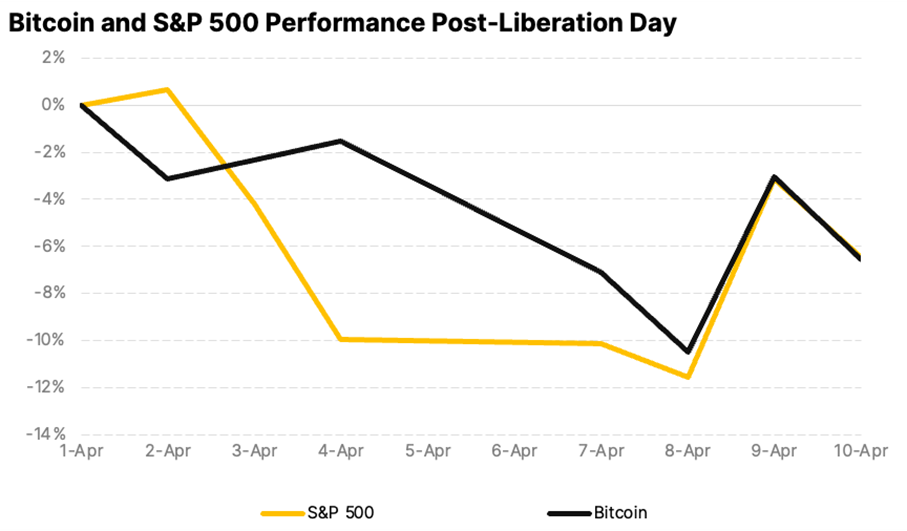
Bitcoin is macro now
Despite persistent concerns about crypto volatility, Bitcoin’s price over the past two weeks has closely mirrored the S&P 500 and has actually been less volatile. This alignment reflects Bitcoin’s growing maturity as an asset class and highlights its resilience. As a highly liquid and accessible asset, it continues to attract investors looking for relative value in turbulent markets.
Sentiment shifts toward crypto ETFs
Spot Bitcoin ETFs recorded $700 million in outflows, while Ethereum ETFs lost $400 million since March, marking a sharp reversal after nine consecutive months of inflows. The pullback points to growing institutional caution amid broader macro uncertainty. Still, on-chain data reveals that long-term holders have been steadily accumulating since January lows, signaling continued confidence in the asset class.
Macroeconomic uncertainty takes center stage
The latest U.S. CPI print came in at 2.4%, which was lower than expected. A rate cut in May still seems premature as markets assess the full impact of new protectionist measures. Federal Reserve Chair Jerome Powell has warned that tariffs could raise inflation while slowing growth. As a result, the probability of three rate cuts in 2025 now exceeds 60%. Declining yields may be an early signal of future monetary easing, which could favor risk assets like crypto if economic pressures intensify.
Bitcoin: Dollar’s ally or alternative?
In the face of policy uncertainty, the debate around the U.S. dollar’s reserve currency status is gaining momentum. With its decentralized and censorship-resistant design, Bitcoin is emerging as both a potential complement and challenger to the dollar, especially as the U.S. increasingly wields its currency as a geopolitical tool through tariffs and sanctions.
Meanwhile, Bitcoin’s fundamentals remain solid. Hashrate is at all-time highs, regulatory clarity is improving, and long-term holders continue to accumulate. With prices consolidating above $80K, the current correction may offer a strategic opportunity for investors positioning for the next leg of growth, particularly as the macro picture evolves.
Research Newsletter
Each week the 21Shares Research team will publish our data-driven insights into the crypto asset world through this newsletter. Please direct any comments, questions, and words of feedback to research@21shares.com
Disclaimer
The information provided does not constitute a prospectus or other offering material and does not contain or constitute an offer to sell or a solicitation of any offer to buy securities in any jurisdiction. Some of the information published herein may contain forward-looking statements. Readers are cautioned that any such forward-looking statements are not guarantees of future performance and involve risks and uncertainties and that actual results may differ materially from those in the forward-looking statements as a result of various factors. The information contained herein may not be considered as economic, legal, tax or other advice and users are cautioned to base investment decisions or other decisions solely on the content hereof.


iShares och Franklin Templeton listar nya ETFer på Xetra

BE28 ETF företagsobligationer med förfall 2028 och inget annat

Trump’s trade war puts Bitcoin in the spotlight

YCSH ETF är en satsning på den europeiska dagslåneräntan

Crypto’s stress-tested resilience

Fonder som ger exponering mot försvarsindustrin
Crypto Market Risks & Opportunities: Insights on Bybit Hack, Bitcoin, and Institutional Adoption

Warren Buffetts råd om vad man ska göra när börsen kraschar

Montrose storsatsning på ETFer fortsätter – lanserar Sveriges första globala ETF med hävstång

Svenskarna har en ny favorit-ETF
-
 Nyheter4 veckor sedan
Fonder som ger exponering mot försvarsindustrin
-

 Nyheter3 veckor sedan
Crypto Market Risks & Opportunities: Insights on Bybit Hack, Bitcoin, and Institutional Adoption
-
 Nyheter3 veckor sedan
Warren Buffetts råd om vad man ska göra när börsen kraschar
-
 Nyheter2 veckor sedan
Montrose storsatsning på ETFer fortsätter – lanserar Sveriges första globala ETF med hävstång
-
 Nyheter3 veckor sedan
Svenskarna har en ny favorit-ETF
-

 Nyheter4 veckor sedan
HANetf lanserar Europa-fokuserad försvars-ETF
-

 Nyheter2 veckor sedan
MONTLEV, Sveriges första globala ETF med hävstång
-

 Nyheter3 veckor sedan
Fastställd utdelning i MONTDIV mars 2025