Gold Sets a High Bar for Bitcoin, a Gold Commentary July by Joe Foster, Portfolio Manager/Strategist
Key Takeaway
- Gold bullion rallied 2.25% in July despite heavy gold bullion ETP redemptions, while gold stocks moved slightly higher.
- We see $1,200 as a resilient floor for gold, with prices yet to trend through $1,300. The most obvious catalyst is likely to be U.S. economic weakness, which might persuade the Fed to turn cautious.
- Investors are eager to understand digital currencies like bitcoin. We evaluate this ”fad” in the context of time-tested gold investing.
The most significant development that has come out of the digital currency craze is validation of distributed ledger technology.
Gold Bullion Rallies in July
The monthly low for gold came on July 10 at $1,204 per ounce. Gold then rallied to finish July at $1,269.44 per ounce, a gain of $27.89 (2.25%; YTD gold bullion has gained 10.17%). This was the third time this year that gold has successfully tested the $1,200 level. Although the U.S. dollar had a precipitous fall in July, it was not the primary driver for gold. Thus far in 2017 gold has been responding more to changes in real interest rates. Gold has an inverse correlation to real interest rates, which moved higher early in the month (coinciding with gold lows) before trending lower. The change in direction for gold and interest rates was driven by somewhat dovish Congressional testimony by Federal Reserve Chair Janet Yellen, which the market interpreted as an indication that another Fed rate increase this year is less likely.
July Gains Impressive Given ETP Redemptions
July saw heavy redemptions in the gold bullion exchange traded products. Physical demand from Asia is typically low during the summer and there were not any significant moves in futures positioning. Normally this would contribute to price weakness, so July’s modest gains for gold are somewhat impressive. It is possible that July’s gains were driven by buying in the over-the-counter market (OTC), however there is no published data for OTC transactions. We do expect that more transparency for the OTC market will be available soon. The London Bullion Market Association (LBMA) and the London Precious Metals Clearing Limited (LPMCL) recently began releasing aggregate data on gold inventories in London vaults with a three month lag. Vaulting statistics are a first step and are likely to be followed by trade reporting at a later date.
Gold stocks moved slightly higher with the gold price. For July, the NYSE Arca Gold Miners Index (GDMNTR) gained 3.6% while the MVIS Global Junior Gold Miners Index (MVGDXJTR) advanced 0.20%. Gold stocks advanced despite heavy redemptions in gold stock ETFs, a situation that parallels the curious July relationship between the rising gold price and the gold bullion ETP redemptions. Markets don’t always do what is expected of them.
Recent Momentum Suggests that $1,300 is Likely to be Tested
While $1,200 has proven to be a resilient floor for gold, the price has yet to trend through the $1,300 per ounce level. Twice this year gold turned down as it approached $1,300. The recent upward price trend suggests $1,300 may soon be tested for a third time. Gold prices typically trend higher in the fall as seasonal physical demand improves. In terms of identifying catalysts that might enable gold to break through $1,300, the most obvious candidate is economic weakness that might persuade the Fed to take a more cautious stance. The Fed is expected to announce plans in September to reduce its massive crisis-era balance sheet and there could also be significant risks surrounding these plans.
Gold is Physical, Bitcoin is Digital
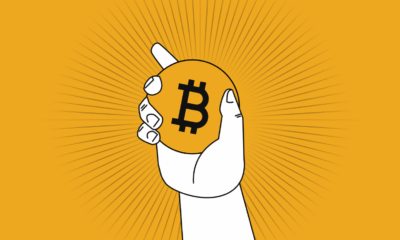
Recently, we have received many questions about digital currencies and in particular, bitcoin (defined as the world’s first decentralized digital currency). The queries range from our general opinion to concerns that bitcoin might displace gold demand. While we have no digital currency experts on our gold team, we follow the development of these new currencies with interest. It is clear that those who promote bitcoin are using gold’s image to help validate their product. Press articles are often accompanied by a picture of stacks of shiny gold colored bitcoins. Bitcoins are created by “miners”. This is aimed at creating the illusion of a solid currency. In reality, digital currencies are strings of 0s and 1s stored in a computer in some unknown location and cannot be touched or seen.
There are, however, several important similarities between gold and bitcoin. Both are outside of the mainstream financial establishment. Both are not issued or controlled by governments, and both are traded around the globe across borders. Supply of both gold and bitcoin is limited, so they are sound forms of currency. For most transactions to be used in an economy, they must be converted into paper currency.
Gold versus Bitcoin
However, there are a range of significant differences:
- Gold has been established as a store of wealth throughout human history. Gold’s market capitalization is roughly $8 trillion, of which $3 trillion is in coin and bar form. Approximately $50 billion worth of gold trades each day. Bitcoin is microscopic in comparison with a market capitalization of approximately $45 billion and $1.5 billion in daily trading volume.
- Gold can be stored anywhere. If stored at home, it can be used for barter the next time a hacker or solar flare takes down the grid. Digital currencies are worthless without electricity. Taking delivery will always be impossible with digital currency.
- Bitcoin mining is a difficult concept to fathom. Bitcoin miners use computer programs to solve complex math problems and receive in exchange new bitcoins. What does this activity have to do with creating a store of wealth?
- Most bitcoin markets are lightly regulated and are located outside of the U.S. A major potential drawback to digital currency is their use for money laundering, illegal trading, computer ransom attacks, tax avoidance, and to subvert exchange controls. Expect governments to intervene heavily if any of these activities become significant. Over the past year the People’s Bank of China (PBOC) forced the three biggest bitcoin exchanges to adhere to anti-money laundering rules, implement trading fees, and then forced them to halt bitcoin withdrawals.
- Distributed ledgers are promoted as unhackable. However, police were recently able to find the digital keys to an online criminal’s accounts and seize approximately $8 million in digital currencies.
- Digital currency has yet to stand the test of time. We do not know if a digital currency that is secure today will be secure under new technology. Distributed ledger passwords could be relatively easily broken if quantum computing becomes a reality.
Distributed Ledger Technology is Game Changing
The most significant development that has come out of the digital currency craze is validation of distributed ledger technology. This technology has the potential to revolutionize many aspects of the financial system, trade, and essentially anything where records are maintained. A secure system that eliminates middle men has obvious advantages. Imagine trading stocks without brokers, transfer agents, and custodians ― a scenario where fees are likely to disappear.
Source: Capco.com.
Equally as significant, digital currencies have caused many to question what exactly a currency should be and whether there is a better alternative to fiat currency. The monetary system is broken. Central banks seem powerless to prevent the economy from going through busts that destroy wealth and create hardship. Currency volatility under the fiat system has been extreme. Politics, corruption, and mismanagement are a constant concern.
Technology Likely to Improve Gold Ownership Efficiency
Combining distributed ledger technology with an established sound and solid currency may provide the best alternative. To this end, later in 2017 the Royal Mint in the U.K. is set to launch Royal Mint Gold (RMG). RMG will be a digital record of ownership for gold stored at its vault, while CME Group will operate the product’s distributed ledger platform. It will carry the option to convert to physical gold. It is not clear whether this product will enable consumer purchases with some type of RMG credit card. Regardless, technology is accelerating towards the day when gold can be used both as a store of wealth and an efficient medium of exchange.
Digital Currencies Are Not Likely to Replicate Gold’s Unique Role
Bitcoin and other digital currencies are a fad that has attracted the attention of programmers, speculators, and early adaptors. Given the fundamental characteristics of gold and digital currencies, we do not believe digital currencies will ever replicate or replace gold’s unique role as a form of portfolio insurance and as a hedge against tail risk. It is my opinion that governments will not allow digital currencies to reach the critical mass needed to challenge the utility of fiat currencies. At best, digital currencies may eventually occupy some middle ground as a niche product. At worst, they become a failed experiment that ends in tears. For now, the only thing we can forecast with confidence in the digital currency space is more volatility.
by Joe Foster, Portfolio Manager and Strategist
With more than 30 years of gold industry experience, Foster began his gold career as a boots on the ground geologist, evaluating mining exploration and development projects. Foster is Portfolio Manager and Strategist for the Gold and Precious Metals strategy.
Please note that the information herein represents the opinion of the author and these opinions may change at any time and from time to time.
Important Information
1 U.S. Dollar Index (DXY) indicates the general international value of the U.S. dollar. The DXY does this by averaging the exchange rates between the U.S. dollar and six major world currencies: Euro, Japanese yen, Pound sterling, Canadian dollar, Swedish kroner, and Swiss franc.
2 The correlation coefficient is a measure that determines the degree to which two variables’ movements are associated and will vary from -1.0 to 1.0. -1.0 indicates perfect negative correlation, and 1.0 indicates perfect positive correlation.
3 NYSE Arca Gold Miners Index (GDMNTR) is a modified market capitalization-weighted index comprised of publicly traded companies involved primarily in the mining for gold.
4 MVIS Global Junior Gold Miners Index (MVGDXJTR) is a rules-based, modified market capitalization-weighted, float-adjusted index comprised of a global universe of publicly traded small- and medium-capitalization companies that generate at least 50% of their revenues from gold and/or silver mining, hold real property that has the potential to produce at least 50% of the company’s revenue from gold or silver mining when developed, or primarily invest in gold or silver.
5 Black swan is an event or occurrence that deviates beyond what is normally expected of a situation and is extremely difficult to predict.
6 VIX is the ticker symbol for the Chicago Board Options Exchange (CBOE) Volatility Index, which shows the market’s expectation of 30-day volatility. It is constructed using the implied volatilities of a wide range of S&P 500 index options.
Important Disclosures
This commentary originates from VanEck Investments Limited (“VanEck”) and does not constitute an offer to sell or solicitation to buy any security.
VanEck’s opinions stated in this commentary may deviate from opinions presented by other VanEck departments or companies. Information and opinions in this commentary are based on VanEck’s analysis. Any forecasts and projections contained in the commentary appear from the named sources. All opinions in this commentary are, regardless of source, given in good faith, and may only be valid as of the stated date of this commentary and are subject to change without notice in subsequent versions of the commentary. Any projections, market outlooks or estimates in this material are forward-looking statements and are based upon certain assumptions that are solely the opinion of VanEck. Any projections, outlooks or assumptions should not be construed to be indicative of the actual events which will occur.

 Nyheter4 veckor sedan
 Nyheter3 veckor sedan
 Nyheter4 veckor sedan
 Nyheter3 veckor sedan
 Nyheter3 veckor sedan
 Nyheter3 veckor sedan
 Nyheter3 veckor sedan
 Nyheter2 veckor sedan
