
Nyheter
Gold miners caught in a value trap

ETF Securities Equity Research – Gold miners caught in a value trap
Summary
- Gold miners are historically very cheap but at this juncture are likely to be a value trap due to profitability concerns.
- Gold miners are facing deteriorating ore grades despite the CAPEX splurges from 2007 to 2013 and recent mine closures haven’t improved margins.
- The recent slide in energy prices and the depreciation of currencies in jurisdictions where local miners operate, has had minimal positive impact on cash costs.
- We prefer gold relative to gold miners until the fundamentals improve.
Download the complete report (.pdf)
Gold miners are a value trap for now
We find ourselves starting 2016 with heightened market volatility. A global sell off in financial markets has pushed up gold prices by 2%, while gold miners have fallen by 7%. This has piqued our interest in the rationality of the historical parity between gold and its miners. While the case for gold remains intact we scrutinize the current valuation of gold miners. For the purpose of this report, gold miners refer to the constituents of the DAXglobal Gold Miners USD (TR) Index.
At first glance, offering a 59% discount to the gold price since 2009, gold miners seem attractive. Coupled with a price to book value of 1.0x and an average dividend yield of 2.8% make them a compelling investment from a valuation perspective. But when comparing with the mining sector in general, which trades at a price to book of 0.69 and an average dividend yield of 5.5%, gold miners do not offer the best value in the sector.

Click to enlarge
Furthermore, the decline in median cash dividend cover to 1.4x suggests sustainability of dividend payments remains questionable.
Elevated production costs dent margins
The recent slide in energy prices, (which has historically been positive for miners), and depreciation of currencies in jurisdictions where the local miners operate, has had minimal beneficial impact on cash costs. Cash costs continue to rise and consequently narrow profit margins. Given the decline in exploration of new projects and construction of new mines we have used ”cash costs” as our metric for calculating the mining cost of production as opposed to ”all in sustaining costs” which includes the full costs of producing gold including exploration and bringing new mines online.

Click to enlarge
Declining ore grades raise production costs
A significant factor contributing to the rising cash costs is the decline in average ore grades of existing mines that have witnessed a staggering 51% decline since 2000. Either the gold is too dispersed (low grade) or buried too deep underground (high grade) making the task of gold mining quite expensive given its capital intensive nature. The average ore grades of producing mines stand at 1.18g/ton, while that of undeveloped deposits is 0.89g/ton according to Visual Capitalist. These undeveloped mines represent a staggering 66% of all deposits on earth, leaving gold miners faced with deteriorating efficiency and higher costs as current reserves are depleted.

Click to enlarge
Discovery drought weighs on profitability
In addition, the future profitability of miners has come into question as they face the brunt of aggressive reductions in capital expenditure in the form of closures of uneconomical mines and curtailed exploration budgets. The golden era that lasted from 2001 to 2011 rewarded gold miners for aggressive growth over cash flow generation, eroding company valuations over the long run as they were funded by record amount of debt.

Click to enlarge
Today, long term risks to supply remain at the forefront of the debate after capital expenditures have declined to the lowest level in 12 years.
Gold miners are much higher risk
The financial credibility of the gold miners is low. The credit default swap spreads (CDS) for gold mining companies have risen 712% on average since 2003 to 220 basis points, well above the 66bp average for the S&P500. While it is unlikely to prompt a wave of impending defaults, as the net debt to EBITDA is low at 0.5, it reflects the increased risk of owning gold miners particularly when compared to the relative safe haven of physical gold. Furthermore, it highlights gold miners’ ability to raise debt while debt costs are typically rising, is becoming more difficult.

Click to enlarge
We continue to prefer gold over gold miners
We believe that gold prices will be constrained by rising nominal interest rates and some strengthening of the US Dollar in the short-term. However, we believe the US Federal Reserve (Fed) is potentially behind the curve with risks of inflation rising by more than their expectations and the markets in the longer-term. Furthermore, we believe the US Dollar strength is likely to wane, taking some of the gold-negative pressure away.
Contrary to popular belief, historically gold tends to rise in the first year of rate hikes, having only faltered when real interest rates rose aggressively in 1994. We believe a repeat of 1994 is unlikely in light of dovish leadership at the Fed.
Despite the low valuation of gold miners, on a risk adjusted basis we prefer physical gold and other areas of the mining sector which offer much better value.
For more information contact
ETF Securities Research team
ETF Securities (UK) Limited
T +44 (0) 207 448 4336
E info@etfsecurities.com
Important Information
This communication has been issued and approved for the purpose of section 21 of the Financial Services and Markets Act 2000 by ETF Securities (UK) Limited (“ETFS UK”) which is authorised and regulated by the United Kingdom Financial Conduct Authority (the “FCA”).


President Trump announced a highly aggressive tariff package—one with broad macroeconomic implications—and global markets reacted sharply. In this environment of heightened volatility, we urge investors to maintain perspective, just as they should when prices are volatile to the upside (e.g., last year’s post-election rally).
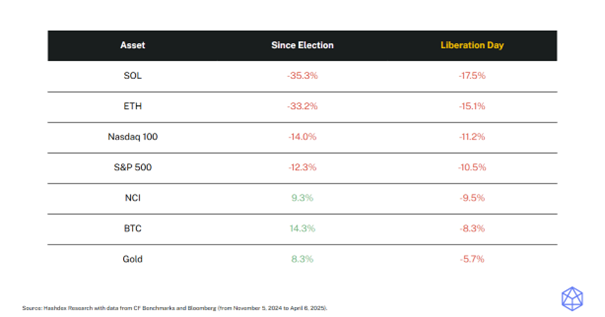
Notably, since the election, bitcoin and the Nasdaq Crypto Index have outperformed gold, the S&P 500, and Nasdaq 100. Even in the wake of the tariffs, only gold has outpaced bitcoin and the NCI—highlighting the relative strength of digital assets amid global market declines.
Market Highlights
Stablecoin legislation advances in US
The House Financial Services Committee voted to advance a monumental bill to regulate stablecoins, the STABLE Act, following the Senate Banking Committee approval of similar legislation earlier this year.
President Trump has said he wants stablecoin legislation approved by Congress before its August recess, reinforcing the new administration’s focus on establishing clear crypto regulation.
Tokenized fund sets dividend benchmark
BlackRock’s BUIDL paid an estimated $4.17 million in monthly dividends during March.
This highlights the potential of crypto to create attractive investment instruments, such as tokenized funds, which stood out this month paying massive dividends and setting a new benchmark for the class.
SEC chair orders review of crypto guidance
Acting SEC Chair Mark T. Uyeda ordered a review of past staff guidance on crypto, including risk warnings and interpretations of the Howey test.
This move, like others before, signals a broader shift toward a more open regulatory approach, potentially strengthening the presence of bitcoin and other digital assets in the US in the near future.
Market Metrics
The NCITM constituents had another negative week, with only XRP (-7.0%) and BTC (-3.8%) avoiding double-digit losses. The overall NCITM decline of -5.2% was cushioned by BTC’s relative resilience, as it performed better as a store-of-value asset. However, the drop still reflects a broader risk-off sentiment across all markets, driven by Trump’s tariff policies and growing macroeconomic uncertainties that are prompting investors to reassess their positions.
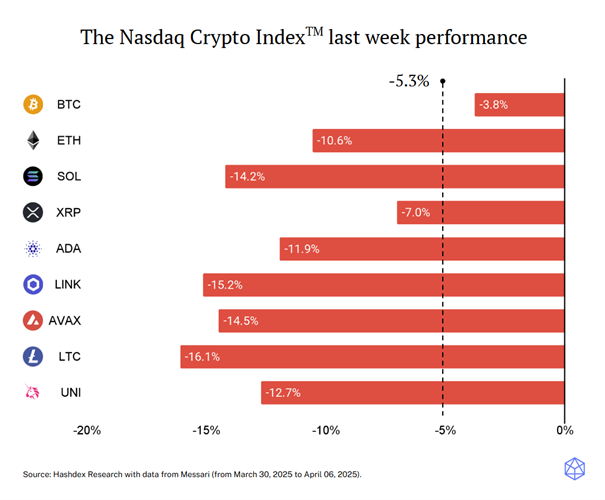
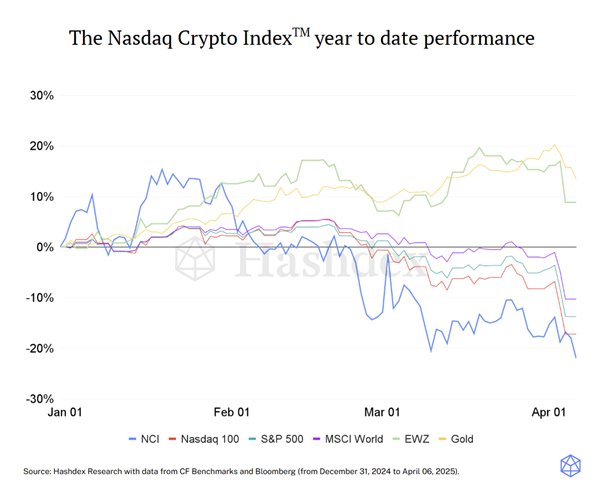
This week, the NCITM fell -5.3%, narrowing the gap with traditional indices such as the Nasdaq 100 (-9.8%) and S&P 500 (-9.1%) which experienced sharper losses following Trump’s tariff announcements. BTC (-3.8%) performed similarly to gold (-3.3%), though gold remains the top-performing asset class year-to-date. The week reinforced the risk-off sentiment, with investors broadly retreating from risk assets. Still, it also highlighted crypto’s growing relevance, as the most volatile asset class managed to outperform traditional markets in a stressed environment.


WEL8 ETF är en satsning på globala finansföretag

Tariffs spark turmoil: BTC holds its ground

JMES ETF en aktivt förvaltad fond från JPMorgan

Världens första europeiska försvars-ETF från ett europeiskt ETF-företag lanseras på Xetra och Euronext Paris

BSE7 ETF investerar i företagsobligationer med förfall 2027

Fonder som ger exponering mot försvarsindustrin

WisdomTree lanserar europeisk försvarsfond.

Warren Buffetts råd om vad man ska göra när börsen kraschar

De bästa börshandlade fonderna för tyska utdelningsaktier

Trumps återkomst får europeiska aktier att rusa
-
 Nyheter2 veckor sedan
Fonder som ger exponering mot försvarsindustrin
-
 Nyheter4 veckor sedan
WisdomTree lanserar europeisk försvarsfond.
-
 Nyheter2 veckor sedan
Warren Buffetts råd om vad man ska göra när börsen kraschar
-
 Nyheter3 veckor sedan
De bästa börshandlade fonderna för tyska utdelningsaktier
-
 Nyheter4 veckor sedan
Trumps återkomst får europeiska aktier att rusa
-

 Nyheter1 vecka sedan
Svenskarna har en ny favorit-ETF
-

 Nyheter1 vecka sedan
Crypto Market Risks & Opportunities: Insights on Bybit Hack, Bitcoin, and Institutional Adoption
-

 Nyheter3 veckor sedan
HANetf lanserar Europa-fokuserad försvars-ETF